Cities with the Highest Percentage of Population Employed in Community & Social Service in Vermont
RELATED REPORTS & OPTIONS
Community & Social Service
Vermont
Compare Cities
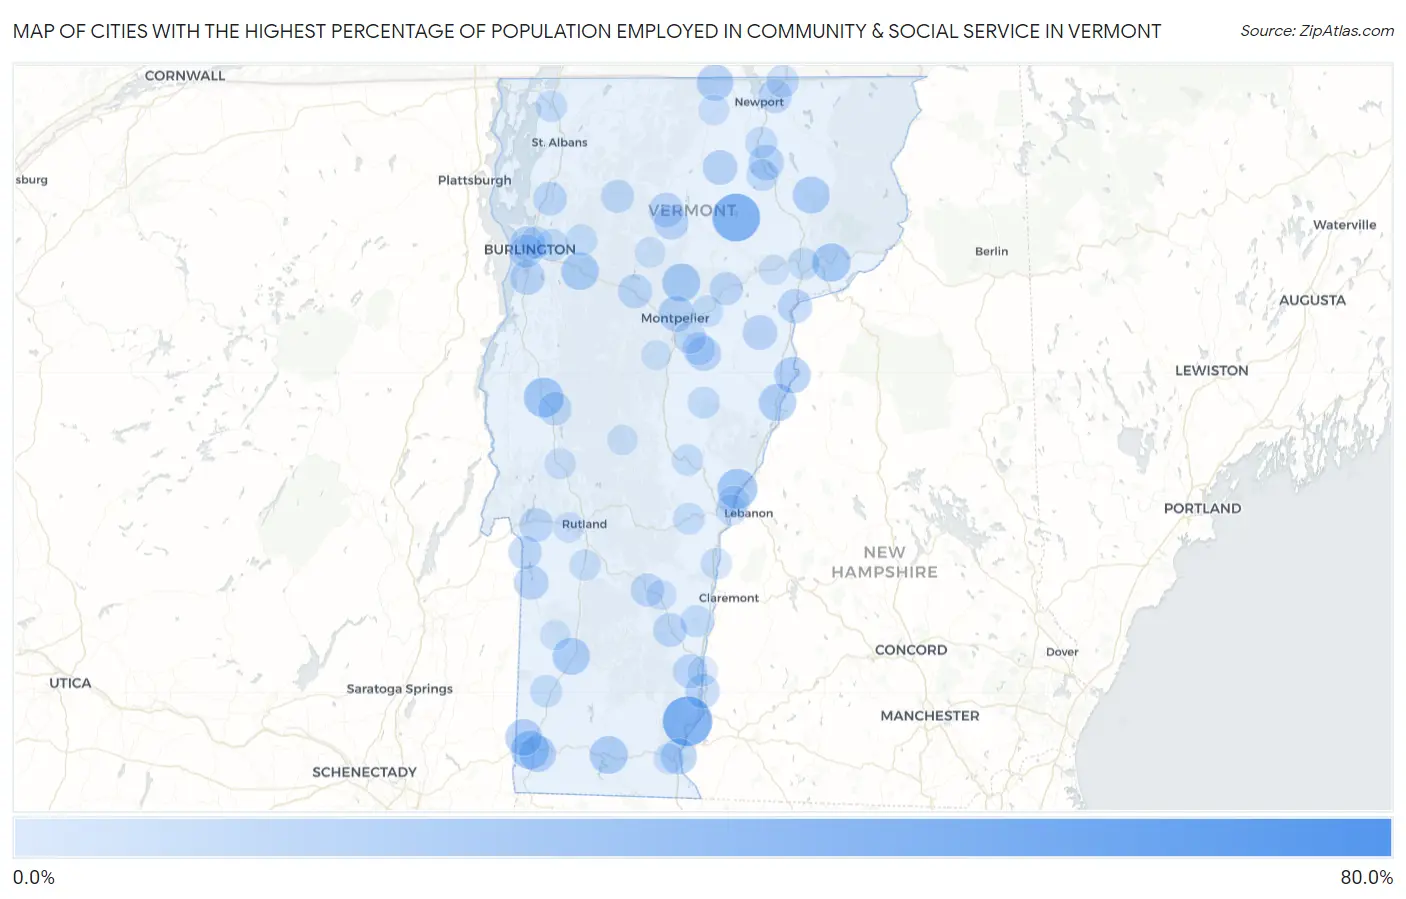
Map of Cities with the Highest Percentage of Population Employed in Community & Social Service in Vermont
0.0%
80.0%
Cities with the Highest Percentage of Population Employed in Community & Social Service in Vermont
| City | % Employed | vs State | vs National | |
| 1. | Lyndon Center | 77.1% | 15.1%(+62.0)#1 | 11.2%(+65.9)#70 |
| 2. | Grafton | 55.6% | 15.1%(+40.5)#2 | 11.2%(+44.3)#148 |
| 3. | Putney | 51.2% | 15.1%(+36.1)#3 | 11.2%(+40.0)#180 |
| 4. | Greensboro | 47.6% | 15.1%(+32.5)#4 | 11.2%(+36.4)#234 |
| 5. | West Woodstock | 47.5% | 15.1%(+32.5)#5 | 11.2%(+36.3)#236 |
| 6. | Weston | 44.4% | 15.1%(+29.4)#6 | 11.2%(+33.2)#280 |
| 7. | East Poultney | 42.4% | 15.1%(+27.3)#7 | 11.2%(+31.2)#320 |
| 8. | Norwich | 31.0% | 15.1%(+15.9)#8 | 11.2%(+19.8)#688 |
| 9. | Middlebury | 30.9% | 15.1%(+15.8)#9 | 11.2%(+19.7)#696 |
| 10. | Peacham | 30.2% | 15.1%(+15.1)#10 | 11.2%(+18.9)#742 |
| 11. | Jamaica | 28.8% | 15.1%(+13.8)#11 | 11.2%(+17.6)#838 |
| 12. | Whitingham | 28.3% | 15.1%(+13.2)#12 | 11.2%(+17.0)#886 |
| 13. | Concord | 27.9% | 15.1%(+12.8)#13 | 11.2%(+16.7)#913 |
| 14. | Old Bennington | 27.7% | 15.1%(+12.6)#14 | 11.2%(+16.5)#931 |
| 15. | Worcester | 27.0% | 15.1%(+11.9)#15 | 11.2%(+15.8)#1,003 |
| 16. | Wilmington | 26.8% | 15.1%(+11.7)#16 | 11.2%(+15.6)#1,026 |
| 17. | Richmond | 26.2% | 15.1%(+11.1)#17 | 11.2%(+15.0)#1,088 |
| 18. | Bradford | 25.9% | 15.1%(+10.8)#18 | 11.2%(+14.7)#1,111 |
| 19. | Manchester Center | 25.4% | 15.1%(+10.3)#19 | 11.2%(+14.2)#1,160 |
| 20. | West Burke | 25.0% | 15.1%(+9.92)#20 | 11.2%(+13.8)#1,218 |
| 21. | Bennington | 24.5% | 15.1%(+9.45)#21 | 11.2%(+13.3)#1,299 |
| 22. | North Bennington | 24.4% | 15.1%(+9.27)#22 | 11.2%(+13.1)#1,329 |
| 23. | South Hero | 24.2% | 15.1%(+9.09)#23 | 11.2%(+13.0)#1,359 |
| 24. | North Troy | 23.9% | 15.1%(+8.80)#24 | 11.2%(+12.7)#1,413 |
| 25. | Newbury | 23.8% | 15.1%(+8.70)#25 | 11.2%(+12.6)#1,443 |
| 26. | Middletown Springs | 23.7% | 15.1%(+8.60)#26 | 11.2%(+12.5)#1,459 |
| 27. | Brattleboro | 23.3% | 15.1%(+8.21)#27 | 11.2%(+12.1)#1,538 |
| 28. | Montpelier | 22.4% | 15.1%(+7.31)#28 | 11.2%(+11.2)#1,738 |
| 29. | Barton | 21.3% | 15.1%(+6.26)#29 | 11.2%(+10.1)#1,973 |
| 30. | Burlington | 20.7% | 15.1%(+5.58)#30 | 11.2%(+9.45)#2,154 |
| 31. | Shelburne | 20.6% | 15.1%(+5.55)#31 | 11.2%(+9.42)#2,163 |
| 32. | Huntington Center | 20.4% | 15.1%(+5.35)#32 | 11.2%(+9.22)#2,237 |
| 33. | Albany | 20.4% | 15.1%(+5.33)#33 | 11.2%(+9.19)#2,242 |
| 34. | East Barre | 20.3% | 15.1%(+5.26)#34 | 11.2%(+9.13)#2,264 |
| 35. | Groton | 20.3% | 15.1%(+5.24)#35 | 11.2%(+9.10)#2,268 |
| 36. | Hyde Park | 20.2% | 15.1%(+5.11)#36 | 11.2%(+8.97)#2,328 |
| 37. | Westminster | 19.7% | 15.1%(+4.62)#37 | 11.2%(+8.49)#2,515 |
| 38. | Wells | 19.6% | 15.1%(+4.56)#38 | 11.2%(+8.43)#2,534 |
| 39. | Barnet | 19.4% | 15.1%(+4.27)#39 | 11.2%(+8.14)#2,661 |
| 40. | Morrisville | 19.3% | 15.1%(+4.27)#40 | 11.2%(+8.13)#2,665 |
| 41. | Saxtons River | 19.0% | 15.1%(+3.89)#41 | 11.2%(+7.76)#2,802 |
| 42. | Castleton | 18.9% | 15.1%(+3.85)#42 | 11.2%(+7.72)#2,816 |
| 43. | Waterbury | 18.9% | 15.1%(+3.85)#43 | 11.2%(+7.72)#2,819 |
| 44. | Milton | 18.4% | 15.1%(+3.31)#44 | 11.2%(+7.18)#3,062 |
| 45. | Westford | 18.3% | 15.1%(+3.20)#45 | 11.2%(+7.07)#3,120 |
| 46. | Chester | 18.3% | 15.1%(+3.17)#46 | 11.2%(+7.04)#3,133 |
| 47. | Derby Center | 18.2% | 15.1%(+3.08)#47 | 11.2%(+6.94)#3,183 |
| 48. | Lunenburg | 18.1% | 15.1%(+3.03)#48 | 11.2%(+6.90)#3,203 |
| 49. | Poultney | 18.0% | 15.1%(+2.94)#49 | 11.2%(+6.81)#3,241 |
| 50. | South Burlington | 18.0% | 15.1%(+2.90)#50 | 11.2%(+6.77)#3,261 |
| 51. | East Middlebury | 17.8% | 15.1%(+2.75)#51 | 11.2%(+6.62)#3,333 |
| 52. | Highgate Center | 17.5% | 15.1%(+2.42)#52 | 11.2%(+6.29)#3,527 |
| 53. | Ludlow | 17.5% | 15.1%(+2.41)#53 | 11.2%(+6.28)#3,534 |
| 54. | Gilman | 17.4% | 15.1%(+2.36)#54 | 11.2%(+6.23)#3,562 |
| 55. | Marshfield | 17.3% | 15.1%(+2.21)#55 | 11.2%(+6.08)#3,653 |
| 56. | Jeffersonville | 17.2% | 15.1%(+2.13)#56 | 11.2%(+6.00)#3,688 |
| 57. | West Charlotte | 17.1% | 15.1%(+1.97)#57 | 11.2%(+5.84)#3,790 |
| 58. | Websterville | 17.0% | 15.1%(+1.91)#58 | 11.2%(+5.78)#3,813 |
| 59. | West Dummerston | 16.7% | 15.1%(+1.58)#59 | 11.2%(+5.45)#4,024 |
| 60. | Bakersfield | 16.4% | 15.1%(+1.30)#60 | 11.2%(+5.17)#4,211 |
| 61. | Derby Line | 16.2% | 15.1%(+1.07)#61 | 11.2%(+4.94)#4,368 |
| 62. | Barre | 16.0% | 15.1%(+0.950)#62 | 11.2%(+4.82)#4,445 |
| 63. | Arlington | 15.9% | 15.1%(+0.801)#63 | 11.2%(+4.67)#4,561 |
| 64. | Underhill Flats | 15.9% | 15.1%(+0.798)#64 | 11.2%(+4.67)#4,565 |
| 65. | Essex Junction | 15.8% | 15.1%(+0.669)#65 | 11.2%(+4.54)#4,675 |
| 66. | Winooski | 15.6% | 15.1%(+0.537)#66 | 11.2%(+4.40)#4,783 |
| 67. | Glover | 15.4% | 15.1%(+0.302)#67 | 11.2%(+4.17)#4,972 |
| 68. | Springfield | 15.1% | 15.1%(+0.065)#68 | 11.2%(+3.93)#5,192 |
| 69. | Chelsea | 15.0% | 15.1%(-0.109)#69 | 11.2%(+3.76)#5,364 |
| 70. | St Johnsbury | 14.9% | 15.1%(-0.162)#70 | 11.2%(+3.71)#5,407 |
| 71. | Woodstock | 14.9% | 15.1%(-0.202)#71 | 11.2%(+3.67)#5,436 |
| 72. | Orleans | 14.7% | 15.1%(-0.407)#72 | 11.2%(+3.46)#5,655 |
| 73. | Lincoln | 14.6% | 15.1%(-0.448)#73 | 11.2%(+3.42)#5,706 |
| 74. | East Charlotte | 14.6% | 15.1%(-0.448)#74 | 11.2%(+3.42)#5,710 |
| 75. | Jericho | 14.5% | 15.1%(-0.564)#75 | 11.2%(+3.30)#5,829 |
| 76. | Swanton | 14.1% | 15.1%(-0.960)#76 | 11.2%(+2.91)#6,248 |
| 77. | Plainfield | 13.9% | 15.1%(-1.19)#77 | 11.2%(+2.67)#6,517 |
| 78. | South Royalton | 13.8% | 15.1%(-1.25)#78 | 11.2%(+2.62)#6,593 |
| 79. | New Haven | 13.7% | 15.1%(-1.34)#79 | 11.2%(+2.53)#6,713 |
| 80. | White River Junction | 13.6% | 15.1%(-1.52)#80 | 11.2%(+2.35)#6,918 |
| 81. | Wallingford | 13.5% | 15.1%(-1.58)#81 | 11.2%(+2.29)#6,990 |
| 82. | Wilder | 13.4% | 15.1%(-1.69)#82 | 11.2%(+2.18)#7,142 |
| 83. | Stratton Mountain | 13.3% | 15.1%(-1.75)#83 | 11.2%(+2.12)#7,242 |
| 84. | Windsor | 13.3% | 15.1%(-1.82)#84 | 11.2%(+2.05)#7,336 |
| 85. | Brandon | 13.2% | 15.1%(-1.92)#85 | 11.2%(+1.94)#7,478 |
| 86. | Chittenden | 12.4% | 15.1%(-2.71)#86 | 11.2%(+1.16)#8,632 |
| 87. | West Brattleboro | 12.3% | 15.1%(-2.77)#87 | 11.2%(+1.10)#8,730 |
| 88. | West Rutland | 12.2% | 15.1%(-2.86)#88 | 11.2%(+1.01)#8,857 |
| 89. | Troy | 12.2% | 15.1%(-2.89)#89 | 11.2%(+0.981)#8,896 |
| 90. | Stowe | 12.2% | 15.1%(-2.91)#90 | 11.2%(+0.955)#8,931 |
| 91. | South Lincoln | 12.1% | 15.1%(-2.93)#91 | 11.2%(+0.935)#8,960 |
| 92. | Bolton Valley | 12.0% | 15.1%(-3.05)#92 | 11.2%(+0.816)#9,148 |
| 93. | Proctorsville | 11.7% | 15.1%(-3.43)#93 | 11.2%(+0.436)#9,748 |
| 94. | Rochester | 11.7% | 15.1%(-3.43)#94 | 11.2%(+0.436)#9,749 |
| 95. | Bellows Falls | 11.5% | 15.1%(-3.56)#95 | 11.2%(+0.306)#9,957 |
| 96. | Dorset | 11.5% | 15.1%(-3.57)#96 | 11.2%(+0.297)#9,978 |
| 97. | Danville | 11.3% | 15.1%(-3.75)#97 | 11.2%(+0.114)#10,302 |
| 98. | Proctor | 11.2% | 15.1%(-3.93)#98 | 11.2%(-0.057)#10,622 |
| 99. | Huntington | 11.1% | 15.1%(-3.93)#99 | 11.2%(-0.064)#10,633 |
| 100. | Northfield | 11.0% | 15.1%(-4.05)#100 | 11.2%(-0.181)#10,849 |
1
2Common Questions
What are the Top 10 Cities with the Highest Percentage of Population Employed in Community & Social Service in Vermont?
Top 10 Cities with the Highest Percentage of Population Employed in Community & Social Service in Vermont are:
#1
51.2%
#2
47.6%
#3
31.0%
#4
30.9%
#5
27.9%
#6
27.7%
#7
27.0%
#8
26.8%
#9
26.2%
#10
25.9%
What city has the Highest Percentage of Population Employed in Community & Social Service in Vermont?
Putney has the Highest Percentage of Population Employed in Community & Social Service in Vermont with 51.2%.
What is the Percentage of Population Employed in Community & Social Service in the State of Vermont?
Percentage of Population Employed in Community & Social Service in Vermont is 15.1%.
What is the Percentage of Population Employed in Community & Social Service in the United States?
Percentage of Population Employed in Community & Social Service in the United States is 11.2%.