Zip Codes with the Highest Percentage of Population Employed in Community & Social Service in Yorba Linda, CA
RELATED REPORTS & OPTIONS
Community & Social Service
Yorba Linda
Compare Zip Codes
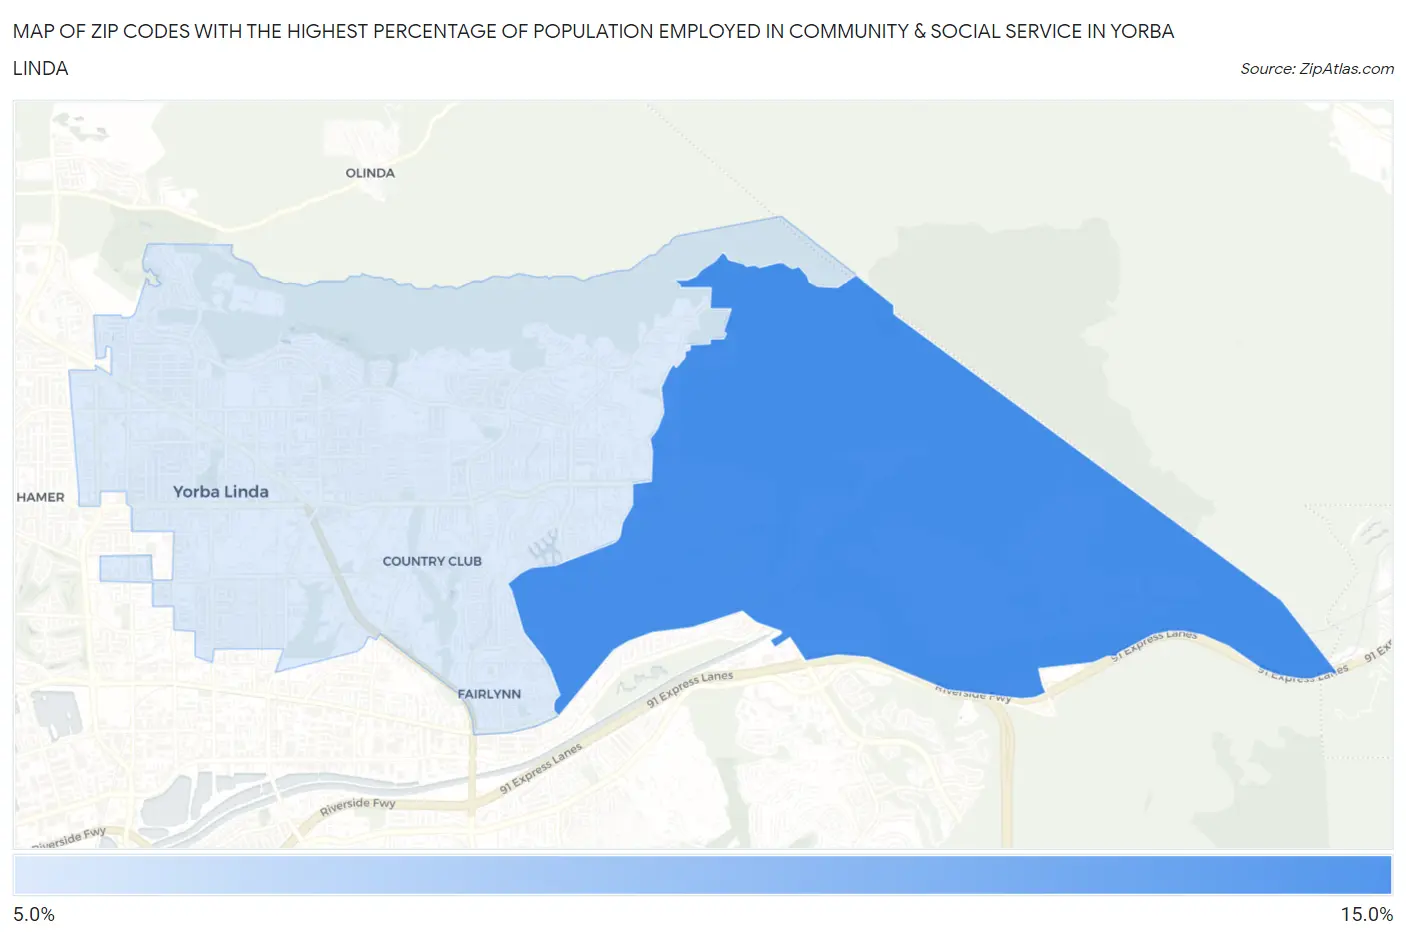
Map of Zip Codes with the Highest Percentage of Population Employed in Community & Social Service in Yorba Linda
11.5%
11.7%
Zip Codes with the Highest Percentage of Population Employed in Community & Social Service in Yorba Linda, CA
| Zip Code | % Employed | vs State | vs National | |
| 1. | 92887 | 11.7% | 11.5%(+0.249)#695 | 11.2%(+0.519)#9,913 |
| 2. | 92886 | 11.5% | 11.5%(+0.051)#724 | 11.2%(+0.321)#10,376 |
1
Common Questions
What are the Top Zip Codes with the Highest Percentage of Population Employed in Community & Social Service in Yorba Linda, CA?
Top Zip Codes with the Highest Percentage of Population Employed in Community & Social Service in Yorba Linda, CA are:
What zip code has the Highest Percentage of Population Employed in Community & Social Service in Yorba Linda, CA?
92887 has the Highest Percentage of Population Employed in Community & Social Service in Yorba Linda, CA with 11.7%.
What is the Percentage of Population Employed in Community & Social Service in Yorba Linda, CA?
Percentage of Population Employed in Community & Social Service in Yorba Linda is 11.4%.
What is the Percentage of Population Employed in Community & Social Service in California?
Percentage of Population Employed in Community & Social Service in California is 11.5%.
What is the Percentage of Population Employed in Community & Social Service in the United States?
Percentage of Population Employed in Community & Social Service in the United States is 11.2%.