Cities with the Highest Percentage of Population Employed in Community & Social Service in Nevada
RELATED REPORTS & OPTIONS
Community & Social Service
Nevada
Compare Cities
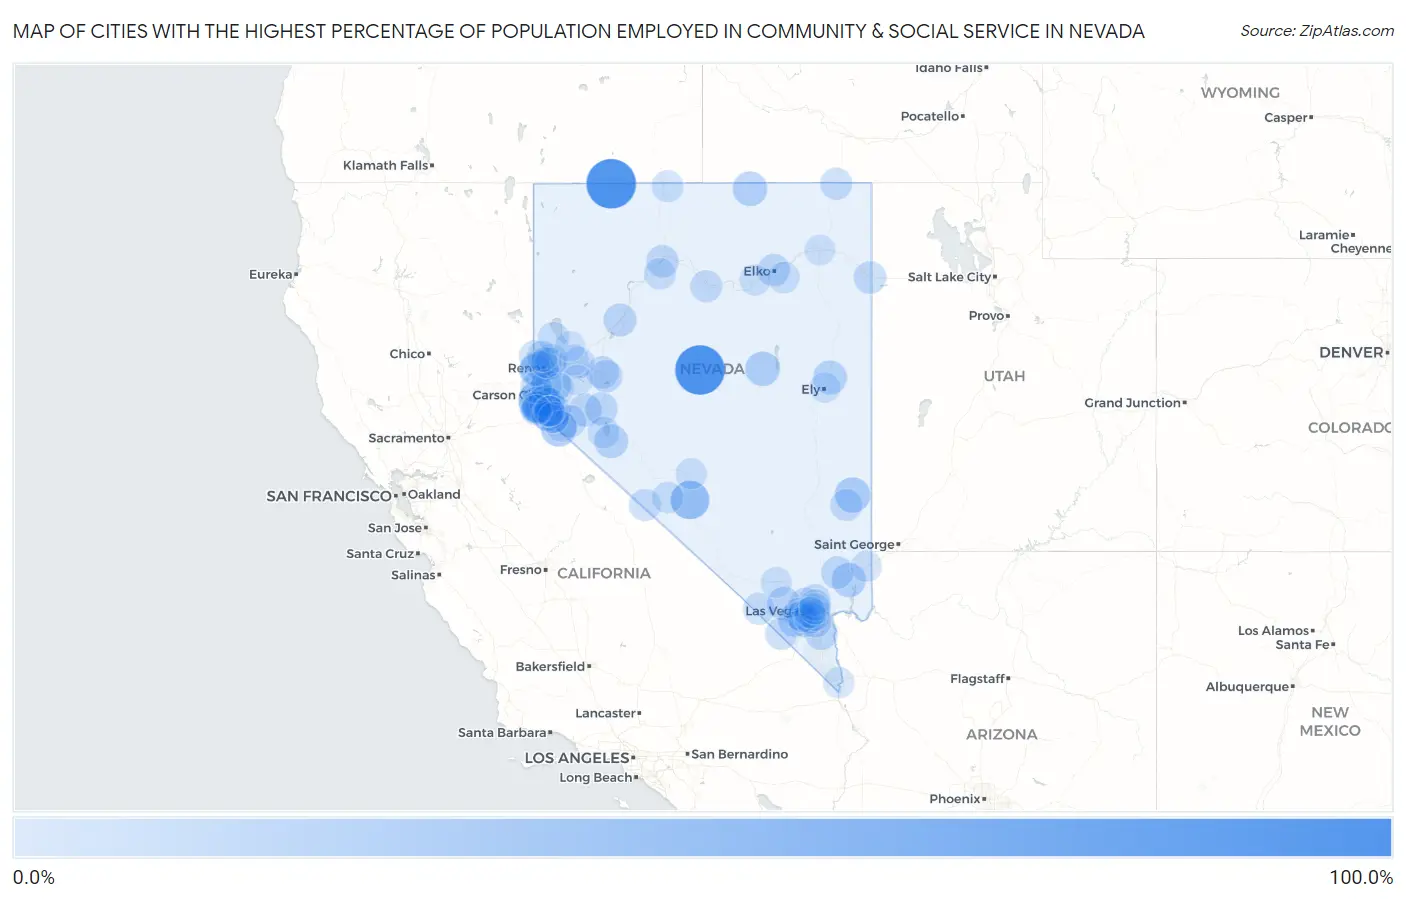
Map of Cities with the Highest Percentage of Population Employed in Community & Social Service in Nevada
0.0%
100.0%
Cities with the Highest Percentage of Population Employed in Community & Social Service in Nevada
| City | % Employed | vs State | vs National | |
| 1. | Austin | 100.0% | 9.1%(+90.9)#1 | 11.2%(+88.8)#40 |
| 2. | Denio | 100.0% | 9.1%(+90.9)#2 | 11.2%(+88.8)#43 |
| 3. | Goldfield | 42.5% | 9.1%(+33.4)#3 | 11.2%(+31.3)#318 |
| 4. | Glenbrook | 38.7% | 9.1%(+29.6)#4 | 11.2%(+27.5)#384 |
| 5. | Skyland | 31.1% | 9.1%(+22.0)#5 | 11.2%(+19.9)#682 |
| 6. | Genoa | 29.9% | 9.1%(+20.9)#6 | 11.2%(+18.7)#761 |
| 7. | Amargosa Valley | 29.3% | 9.1%(+20.2)#7 | 11.2%(+18.1)#809 |
| 8. | Ruhenstroth | 28.7% | 9.1%(+19.7)#8 | 11.2%(+17.5)#847 |
| 9. | Topaz Lake | 27.1% | 9.1%(+18.1)#9 | 11.2%(+15.9)#992 |
| 10. | Panaca | 25.7% | 9.1%(+16.6)#10 | 11.2%(+14.4)#1,135 |
| 11. | Virginia City | 23.2% | 9.1%(+14.1)#11 | 11.2%(+12.0)#1,557 |
| 12. | Mogul | 23.0% | 9.1%(+13.9)#12 | 11.2%(+11.8)#1,609 |
| 13. | Eureka | 22.1% | 9.1%(+13.0)#13 | 11.2%(+10.9)#1,805 |
| 14. | Owyhee | 21.6% | 9.1%(+12.6)#14 | 11.2%(+10.4)#1,905 |
| 15. | Moapa Valley | 20.4% | 9.1%(+11.3)#15 | 11.2%(+9.17)#2,249 |
| 16. | Mcgill | 18.6% | 9.1%(+9.55)#16 | 11.2%(+7.41)#2,955 |
| 17. | Hawthorne | 18.3% | 9.1%(+9.19)#17 | 11.2%(+7.05)#3,127 |
| 18. | Fish Springs | 17.5% | 9.1%(+8.38)#18 | 11.2%(+6.24)#3,558 |
| 19. | Mount Charleston | 16.8% | 9.1%(+7.68)#19 | 11.2%(+5.54)#3,939 |
| 20. | Blue Diamond | 16.7% | 9.1%(+7.59)#20 | 11.2%(+5.45)#3,999 |
| 21. | Minden | 15.9% | 9.1%(+6.84)#21 | 11.2%(+4.70)#4,534 |
| 22. | Lovelock | 14.6% | 9.1%(+5.48)#22 | 11.2%(+3.34)#5,793 |
| 23. | Yerington | 14.1% | 9.1%(+4.98)#23 | 11.2%(+2.84)#6,333 |
| 24. | Schurz | 13.0% | 9.1%(+3.91)#24 | 11.2%(+1.77)#7,722 |
| 25. | Boulder City | 12.4% | 9.1%(+3.34)#25 | 11.2%(+1.20)#8,542 |
| 26. | Kingsbury | 12.1% | 9.1%(+2.98)#26 | 11.2%(+0.843)#9,106 |
| 27. | Henderson | 11.8% | 9.1%(+2.77)#27 | 11.2%(+0.631)#9,414 |
| 28. | Fallon | 11.7% | 9.1%(+2.61)#28 | 11.2%(+0.475)#9,681 |
| 29. | Moapa Town | 11.5% | 9.1%(+2.39)#29 | 11.2%(+0.251)#10,059 |
| 30. | Fallon Station | 11.3% | 9.1%(+2.23)#30 | 11.2%(+0.090)#10,348 |
| 31. | West Wendover | 11.3% | 9.1%(+2.19)#31 | 11.2%(+0.049)#10,428 |
| 32. | Winnemucca | 11.2% | 9.1%(+2.15)#32 | 11.2%(+0.014)#10,507 |
| 33. | Smith Valley | 10.7% | 9.1%(+1.64)#33 | 11.2%(-0.494)#11,442 |
| 34. | Reno | 10.7% | 9.1%(+1.62)#34 | 11.2%(-0.515)#11,502 |
| 35. | Elko | 10.4% | 9.1%(+1.33)#35 | 11.2%(-0.810)#12,086 |
| 36. | Zephyr Cove | 10.2% | 9.1%(+1.09)#36 | 11.2%(-1.05)#12,566 |
| 37. | Carson | 9.8% | 9.1%(+0.710)#37 | 11.2%(-1.43)#13,289 |
| 38. | Sandy Valley | 9.8% | 9.1%(+0.683)#38 | 11.2%(-1.45)#13,349 |
| 39. | Las Vegas | 9.7% | 9.1%(+0.587)#39 | 11.2%(-1.55)#13,555 |
| 40. | Indian Hills | 9.7% | 9.1%(+0.573)#40 | 11.2%(-1.56)#13,586 |
| 41. | Johnson Lane | 9.6% | 9.1%(+0.526)#41 | 11.2%(-1.61)#13,662 |
| 42. | Jackpot | 9.4% | 9.1%(+0.369)#42 | 11.2%(-1.77)#13,991 |
| 43. | Summerlin South | 9.4% | 9.1%(+0.291)#43 | 11.2%(-1.85)#14,150 |
| 44. | Round Hill Village | 9.4% | 9.1%(+0.275)#44 | 11.2%(-1.86)#14,175 |
| 45. | Battle Mountain | 9.2% | 9.1%(+0.167)#45 | 11.2%(-1.97)#14,396 |
| 46. | Verdi | 9.2% | 9.1%(+0.148)#46 | 11.2%(-1.99)#14,436 |
| 47. | Spanish Springs | 9.1% | 9.1%(-0.024)#47 | 11.2%(-2.16)#14,832 |
| 48. | Dyer | 9.0% | 9.1%(-0.050)#48 | 11.2%(-2.19)#14,888 |
| 49. | Enterprise | 9.0% | 9.1%(-0.111)#49 | 11.2%(-2.25)#15,008 |
| 50. | Caliente | 9.0% | 9.1%(-0.118)#50 | 11.2%(-2.25)#15,037 |
| 51. | Spring Valley | 8.5% | 9.1%(-0.625)#51 | 11.2%(-2.76)#16,134 |
| 52. | Walker Lake | 8.4% | 9.1%(-0.644)#52 | 11.2%(-2.78)#16,176 |
| 53. | Cold Springs | 8.4% | 9.1%(-0.648)#53 | 11.2%(-2.79)#16,188 |
| 54. | Paradise | 8.4% | 9.1%(-0.674)#54 | 11.2%(-2.81)#16,236 |
| 55. | Sparks | 8.2% | 9.1%(-0.885)#55 | 11.2%(-3.02)#16,707 |
| 56. | Whitney | 8.1% | 9.1%(-0.966)#56 | 11.2%(-3.10)#16,902 |
| 57. | North Las Vegas | 8.0% | 9.1%(-1.06)#57 | 11.2%(-3.20)#17,112 |
| 58. | Gardnerville Ranchos | 8.0% | 9.1%(-1.07)#58 | 11.2%(-3.21)#17,130 |
| 59. | Pahrump | 7.6% | 9.1%(-1.44)#59 | 11.2%(-3.58)#17,915 |
| 60. | Fort Mcdermitt | 7.1% | 9.1%(-1.93)#60 | 11.2%(-4.07)#18,851 |
| 61. | Grass Valley | 7.1% | 9.1%(-1.96)#61 | 11.2%(-4.10)#18,927 |
| 62. | Spring Creek | 7.0% | 9.1%(-2.05)#62 | 11.2%(-4.19)#19,088 |
| 63. | Silver Peak | 6.6% | 9.1%(-2.45)#63 | 11.2%(-4.59)#19,920 |
| 64. | Washoe Valley | 6.5% | 9.1%(-2.58)#64 | 11.2%(-4.72)#20,133 |
| 65. | Dayton | 6.2% | 9.1%(-2.89)#65 | 11.2%(-5.02)#20,717 |
| 66. | Incline Village | 6.1% | 9.1%(-2.93)#66 | 11.2%(-5.07)#20,801 |
| 67. | Nellis Afb | 5.9% | 9.1%(-3.18)#67 | 11.2%(-5.31)#21,222 |
| 68. | Fernley | 5.8% | 9.1%(-3.25)#68 | 11.2%(-5.38)#21,336 |
| 69. | Sutcliffe | 5.7% | 9.1%(-3.36)#69 | 11.2%(-5.50)#21,527 |
| 70. | Winchester | 5.6% | 9.1%(-3.52)#70 | 11.2%(-5.66)#21,771 |
| 71. | Sun Valley | 5.4% | 9.1%(-3.68)#71 | 11.2%(-5.81)#22,077 |
| 72. | Topaz Ranch Estates | 5.4% | 9.1%(-3.70)#72 | 11.2%(-5.84)#22,106 |
| 73. | Sunrise Manor | 5.4% | 9.1%(-3.72)#73 | 11.2%(-5.85)#22,135 |
| 74. | Lemmon Valley | 5.3% | 9.1%(-3.74)#74 | 11.2%(-5.88)#22,172 |
| 75. | Mesquite | 5.1% | 9.1%(-3.99)#75 | 11.2%(-6.13)#22,550 |
| 76. | Laughlin | 5.0% | 9.1%(-4.08)#76 | 11.2%(-6.22)#22,671 |
| 77. | Carlin | 5.0% | 9.1%(-4.10)#77 | 11.2%(-6.24)#22,691 |
| 78. | Tonopah | 4.2% | 9.1%(-4.89)#78 | 11.2%(-7.03)#23,796 |
| 79. | Indian Springs | 4.0% | 9.1%(-5.03)#79 | 11.2%(-7.17)#24,012 |
| 80. | Gardnerville | 3.5% | 9.1%(-5.62)#80 | 11.2%(-7.75)#24,754 |
| 81. | Wells | 3.1% | 9.1%(-5.98)#81 | 11.2%(-8.12)#25,136 |
| 82. | Wadsworth | 3.0% | 9.1%(-6.11)#82 | 11.2%(-8.25)#25,274 |
| 83. | Carter Springs | 2.8% | 9.1%(-6.31)#83 | 11.2%(-8.45)#25,491 |
| 84. | East Valley | 2.5% | 9.1%(-6.53)#84 | 11.2%(-8.67)#25,696 |
| 85. | Silver Springs | 2.5% | 9.1%(-6.56)#85 | 11.2%(-8.70)#25,715 |
| 86. | Stateline | 2.2% | 9.1%(-6.85)#86 | 11.2%(-8.99)#25,959 |
| 87. | Ely | 2.2% | 9.1%(-6.90)#87 | 11.2%(-9.04)#26,010 |
| 88. | Nixon | 1.3% | 9.1%(-7.78)#88 | 11.2%(-9.92)#26,626 |
1
2Common Questions
What are the Top 10 Cities with the Highest Percentage of Population Employed in Community & Social Service in Nevada?
Top 10 Cities with the Highest Percentage of Population Employed in Community & Social Service in Nevada are:
#1
100.0%
#2
100.0%
#3
42.5%
#4
38.7%
#5
31.1%
#6
29.9%
#7
28.7%
#8
27.1%
#9
25.7%
#10
23.2%
What city has the Highest Percentage of Population Employed in Community & Social Service in Nevada?
Austin has the Highest Percentage of Population Employed in Community & Social Service in Nevada with 100.0%.
What is the Percentage of Population Employed in Community & Social Service in the State of Nevada?
Percentage of Population Employed in Community & Social Service in Nevada is 9.1%.
What is the Percentage of Population Employed in Community & Social Service in the United States?
Percentage of Population Employed in Community & Social Service in the United States is 11.2%.