Cities with the Highest Percentage of Population Employed in Community & Social Service in Rhode Island
RELATED REPORTS & OPTIONS
Community & Social Service
Rhode Island
Compare Cities
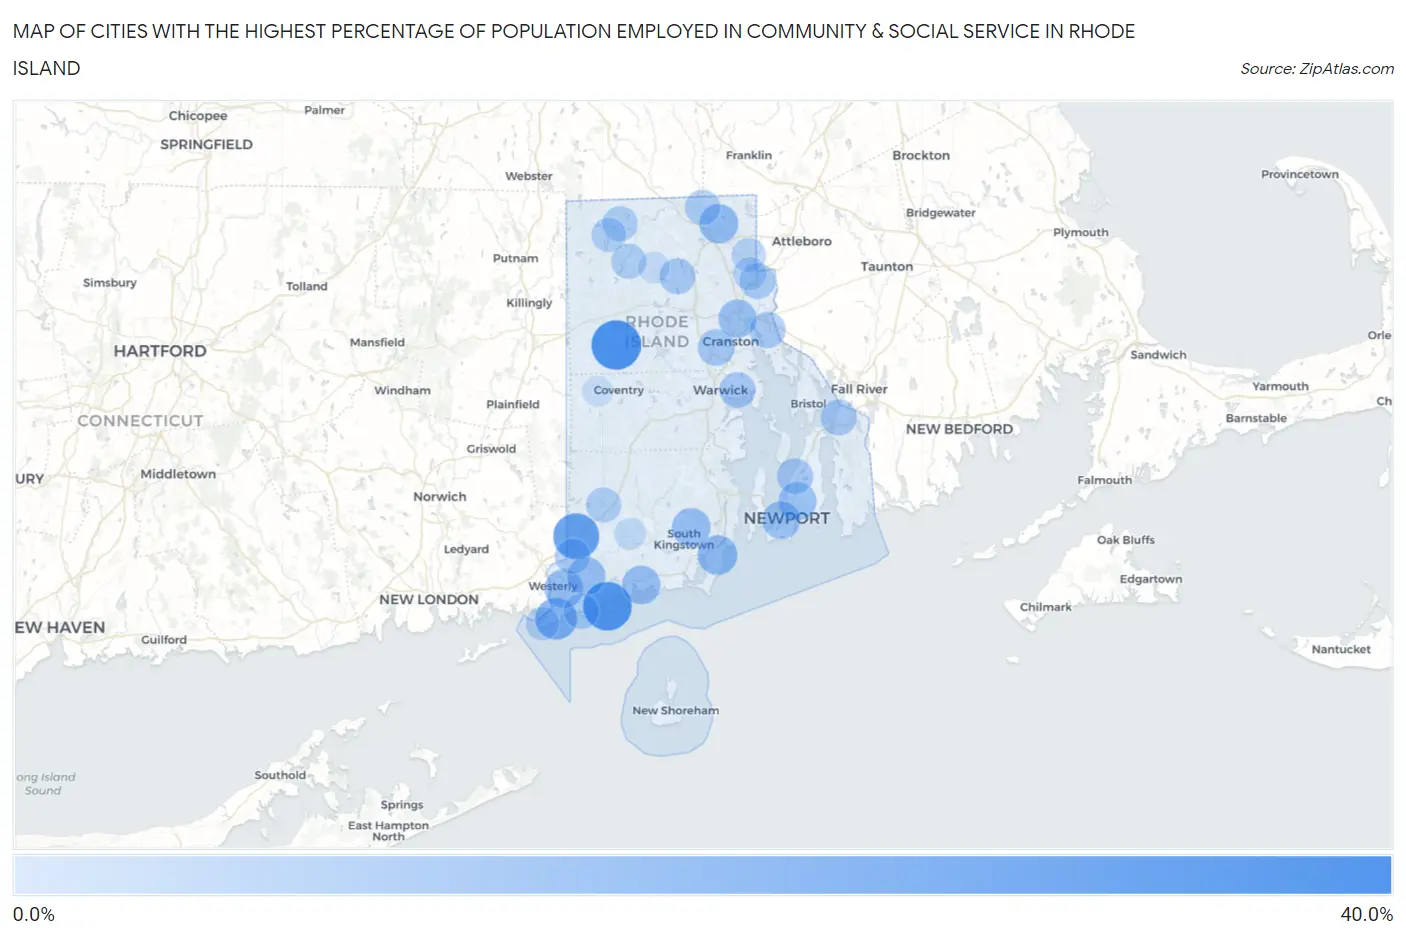
Map of Cities with the Highest Percentage of Population Employed in Community & Social Service in Rhode Island
0.0%
40.0%
Cities with the Highest Percentage of Population Employed in Community & Social Service in Rhode Island
| City | % Employed | vs State | vs National | |
| 1. | Clayville | 37.1% | 12.9%(+24.3)#1 | 11.2%(+25.9)#426 |
| 2. | Quonochontaug | 35.4% | 12.9%(+22.6)#2 | 11.2%(+24.2)#481 |
| 3. | Hopkinton | 30.1% | 12.9%(+17.2)#3 | 11.2%(+18.9)#749 |
| 4. | Misquamicut | 22.1% | 12.9%(+9.28)#4 | 11.2%(+10.9)#1,799 |
| 5. | Wakefield-Peace Dale | 20.3% | 12.9%(+7.41)#5 | 11.2%(+9.06)#2,280 |
| 6. | Narragansett Pier | 18.0% | 12.9%(+5.16)#6 | 11.2%(+6.81)#3,245 |
| 7. | Cumberland Hill | 17.0% | 12.9%(+4.11)#7 | 11.2%(+5.76)#3,827 |
| 8. | Westerly | 16.0% | 12.9%(+3.17)#8 | 11.2%(+4.82)#4,447 |
| 9. | Kingston | 16.0% | 12.9%(+3.10)#9 | 11.2%(+4.75)#4,500 |
| 10. | Charlestown | 15.9% | 12.9%(+3.00)#10 | 11.2%(+4.65)#4,577 |
| 11. | Bradford | 15.7% | 12.9%(+2.83)#11 | 11.2%(+4.48)#4,715 |
| 12. | Providence | 15.1% | 12.9%(+2.27)#12 | 11.2%(+3.91)#5,210 |
| 13. | Newport East | 14.8% | 12.9%(+1.97)#13 | 11.2%(+3.62)#5,491 |
| 14. | Newport | 14.6% | 12.9%(+1.78)#14 | 11.2%(+3.43)#5,694 |
| 15. | Cranston | 12.6% | 12.9%(-0.273)#15 | 11.2%(+1.37)#8,277 |
| 16. | East Providence | 11.3% | 12.9%(-1.52)#16 | 11.2%(+0.128)#10,274 |
| 17. | Tiverton | 11.3% | 12.9%(-1.53)#17 | 11.2%(+0.122)#10,289 |
| 18. | Melville | 11.3% | 12.9%(-1.58)#18 | 11.2%(+0.066)#10,401 |
| 19. | Greenville | 11.2% | 12.9%(-1.65)#19 | 11.2%(-0.001)#10,537 |
| 20. | Warwick | 11.0% | 12.9%(-1.81)#20 | 11.2%(-0.165)#10,820 |
| 21. | Pawtucket | 10.6% | 12.9%(-2.29)#21 | 11.2%(-0.644)#11,736 |
| 22. | Weekapaug | 10.3% | 12.9%(-2.60)#22 | 11.2%(-0.948)#12,361 |
| 23. | Woonsocket | 10.1% | 12.9%(-2.77)#23 | 11.2%(-1.13)#12,715 |
| 24. | Ashaway | 10.1% | 12.9%(-2.77)#24 | 11.2%(-1.13)#12,718 |
| 25. | Harrisville | 9.7% | 12.9%(-3.21)#25 | 11.2%(-1.56)#13,585 |
| 26. | Chepachet | 9.5% | 12.9%(-3.37)#26 | 11.2%(-1.72)#13,898 |
| 27. | Hope Valley | 9.5% | 12.9%(-3.38)#27 | 11.2%(-1.74)#13,927 |
| 28. | Pascoag | 8.5% | 12.9%(-4.32)#28 | 11.2%(-2.68)#15,927 |
| 29. | Valley Falls | 7.5% | 12.9%(-5.36)#29 | 11.2%(-3.71)#18,157 |
| 30. | Watch Hill | 6.6% | 12.9%(-6.27)#30 | 11.2%(-4.62)#19,974 |
| 31. | Central Falls | 6.3% | 12.9%(-6.55)#31 | 11.2%(-4.90)#20,490 |
| 32. | Carolina | 4.0% | 12.9%(-8.86)#32 | 11.2%(-7.21)#24,063 |
| 33. | Harmony | 3.2% | 12.9%(-9.69)#33 | 11.2%(-8.05)#25,071 |
| 34. | Greene | 1.8% | 12.9%(-11.1)#34 | 11.2%(-9.46)#26,323 |
1
Common Questions
What are the Top 10 Cities with the Highest Percentage of Population Employed in Community & Social Service in Rhode Island?
Top 10 Cities with the Highest Percentage of Population Employed in Community & Social Service in Rhode Island are:
#1
37.1%
#2
35.4%
#3
30.1%
#4
22.1%
#5
18.0%
#6
17.0%
#7
16.0%
#8
16.0%
#9
15.9%
#10
15.7%
What city has the Highest Percentage of Population Employed in Community & Social Service in Rhode Island?
Clayville has the Highest Percentage of Population Employed in Community & Social Service in Rhode Island with 37.1%.
What is the Percentage of Population Employed in Community & Social Service in the State of Rhode Island?
Percentage of Population Employed in Community & Social Service in Rhode Island is 12.9%.
What is the Percentage of Population Employed in Community & Social Service in the United States?
Percentage of Population Employed in Community & Social Service in the United States is 11.2%.