Cities with the Highest Percentage of Population Employed in Community & Social Service in Massachusetts
RELATED REPORTS & OPTIONS
Community & Social Service
Massachusetts
Compare Cities
Map of Cities with the Highest Percentage of Population Employed in Community & Social Service in Massachusetts
0.0%
60.0%
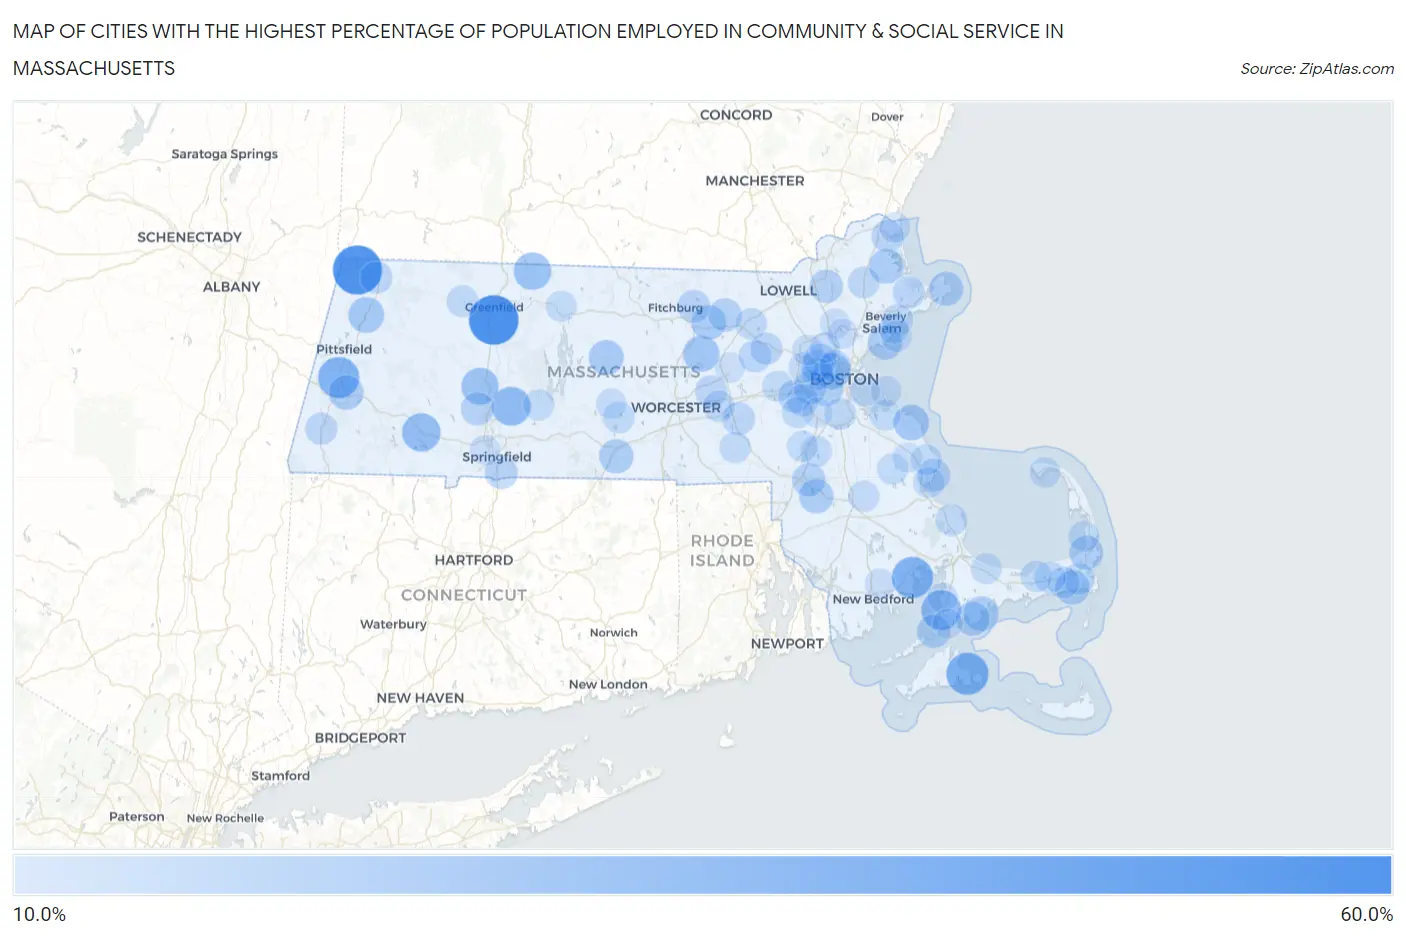
Cities with the Highest Percentage of Population Employed in Community & Social Service in Massachusetts
| City | % Employed | vs State | vs National | |
| 1. | Deerfield | 50.5% | 13.5%(+37.0)#1 | 11.2%(+39.3)#186 |
| 2. | Williamstown | 49.6% | 13.5%(+36.1)#2 | 11.2%(+38.4)#205 |
| 3. | Edgartown | 36.7% | 13.5%(+23.2)#3 | 11.2%(+25.5)#445 |
| 4. | Marion Center | 35.1% | 13.5%(+21.5)#4 | 11.2%(+23.8)#494 |
| 5. | Lenox | 34.7% | 13.5%(+21.2)#5 | 11.2%(+23.5)#512 |
| 6. | West Falmouth | 32.0% | 13.5%(+18.5)#6 | 11.2%(+20.8)#634 |
| 7. | Granby | 30.6% | 13.5%(+17.1)#7 | 11.2%(+19.3)#718 |
| 8. | Blandford | 29.8% | 13.5%(+16.3)#8 | 11.2%(+18.6)#772 |
| 9. | Northfield | 27.7% | 13.5%(+14.2)#9 | 11.2%(+16.5)#938 |
| 10. | Northampton | 27.1% | 13.5%(+13.6)#10 | 11.2%(+15.9)#993 |
| 11. | South Lancaster | 25.6% | 13.5%(+12.1)#11 | 11.2%(+14.4)#1,140 |
| 12. | Cambridge | 25.2% | 13.5%(+11.7)#12 | 11.2%(+14.0)#1,179 |
| 13. | Cheshire | 25.0% | 13.5%(+11.5)#13 | 11.2%(+13.8)#1,212 |
| 14. | Amherst | 25.0% | 13.5%(+11.5)#14 | 11.2%(+13.8)#1,242 |
| 15. | North Scituate | 24.6% | 13.5%(+11.1)#15 | 11.2%(+13.4)#1,281 |
| 16. | West Warren | 23.5% | 13.5%(+9.98)#16 | 11.2%(+12.3)#1,498 |
| 17. | Barre | 23.3% | 13.5%(+9.82)#17 | 11.2%(+12.1)#1,532 |
| 18. | Popponesset Island | 23.1% | 13.5%(+9.57)#18 | 11.2%(+11.9)#1,590 |
| 19. | Lenox Dale | 22.9% | 13.5%(+9.43)#19 | 11.2%(+11.7)#1,614 |
| 20. | Lee | 22.8% | 13.5%(+9.32)#20 | 11.2%(+11.6)#1,639 |
| 21. | Shirley | 22.8% | 13.5%(+9.26)#21 | 11.2%(+11.6)#1,655 |
| 22. | Rowley | 22.7% | 13.5%(+9.18)#22 | 11.2%(+11.5)#1,672 |
| 23. | Swampscott | 22.6% | 13.5%(+9.09)#23 | 11.2%(+11.4)#1,684 |
| 24. | Cedar Crest | 22.4% | 13.5%(+8.92)#24 | 11.2%(+11.2)#1,728 |
| 25. | Harwich Port | 22.4% | 13.5%(+8.86)#25 | 11.2%(+11.2)#1,745 |
| 26. | Norton Center | 22.3% | 13.5%(+8.81)#26 | 11.2%(+11.1)#1,751 |
| 27. | Sturbridge | 22.3% | 13.5%(+8.77)#27 | 11.2%(+11.1)#1,758 |
| 28. | Brookline | 22.1% | 13.5%(+8.58)#28 | 11.2%(+10.9)#1,804 |
| 29. | Monomoscoy Island | 22.1% | 13.5%(+8.55)#29 | 11.2%(+10.8)#1,811 |
| 30. | Rockport | 21.9% | 13.5%(+8.38)#30 | 11.2%(+10.7)#1,847 |
| 31. | Orleans | 21.5% | 13.5%(+8.00)#31 | 11.2%(+10.3)#1,937 |
| 32. | Woods Hole | 21.0% | 13.5%(+7.45)#32 | 11.2%(+9.75)#2,075 |
| 33. | Newton | 20.6% | 13.5%(+7.06)#33 | 11.2%(+9.35)#2,182 |
| 34. | Ayer | 20.5% | 13.5%(+7.03)#34 | 11.2%(+9.33)#2,190 |
| 35. | Mansfield Center | 20.4% | 13.5%(+6.90)#35 | 11.2%(+9.20)#2,241 |
| 36. | Andover | 20.4% | 13.5%(+6.87)#36 | 11.2%(+9.16)#2,255 |
| 37. | Easthampton Town | 20.2% | 13.5%(+6.72)#37 | 11.2%(+9.01)#2,311 |
| 38. | Wellesley | 19.9% | 13.5%(+6.40)#38 | 11.2%(+8.69)#2,449 |
| 39. | Duxbury | 19.8% | 13.5%(+6.33)#39 | 11.2%(+8.63)#2,464 |
| 40. | Longmeadow | 19.8% | 13.5%(+6.33)#40 | 11.2%(+8.63)#2,465 |
| 41. | Arlington | 19.8% | 13.5%(+6.26)#41 | 11.2%(+8.55)#2,492 |
| 42. | Lunenburg | 19.6% | 13.5%(+6.12)#42 | 11.2%(+8.42)#2,541 |
| 43. | Belmont | 19.5% | 13.5%(+5.96)#43 | 11.2%(+8.26)#2,617 |
| 44. | Hopkinton | 19.1% | 13.5%(+5.58)#44 | 11.2%(+7.88)#2,756 |
| 45. | Maynard | 18.9% | 13.5%(+5.35)#45 | 11.2%(+7.65)#2,854 |
| 46. | North Adams | 18.7% | 13.5%(+5.22)#46 | 11.2%(+7.52)#2,915 |
| 47. | Essex | 18.6% | 13.5%(+5.14)#47 | 11.2%(+7.43)#2,941 |
| 48. | Newburyport | 18.5% | 13.5%(+5.03)#48 | 11.2%(+7.33)#2,987 |
| 49. | Needham | 18.4% | 13.5%(+4.91)#49 | 11.2%(+7.20)#3,046 |
| 50. | Northborough | 18.4% | 13.5%(+4.90)#50 | 11.2%(+7.20)#3,048 |
| 51. | Somerville | 18.3% | 13.5%(+4.78)#51 | 11.2%(+7.07)#3,118 |
| 52. | West Concord | 18.2% | 13.5%(+4.64)#52 | 11.2%(+6.94)#3,184 |
| 53. | Great Barrington | 18.1% | 13.5%(+4.63)#53 | 11.2%(+6.93)#3,189 |
| 54. | East Harwich | 18.0% | 13.5%(+4.52)#54 | 11.2%(+6.81)#3,240 |
| 55. | Watertown Town | 17.8% | 13.5%(+4.32)#55 | 11.2%(+6.61)#3,338 |
| 56. | Greenfield | 17.8% | 13.5%(+4.31)#56 | 11.2%(+6.60)#3,343 |
| 57. | The Pinehills | 17.8% | 13.5%(+4.29)#57 | 11.2%(+6.58)#3,353 |
| 58. | Littleton Common | 17.7% | 13.5%(+4.15)#58 | 11.2%(+6.45)#3,419 |
| 59. | Boxford | 17.6% | 13.5%(+4.13)#59 | 11.2%(+6.42)#3,441 |
| 60. | Shelburne Falls | 17.6% | 13.5%(+4.09)#60 | 11.2%(+6.38)#3,460 |
| 61. | Northwest Harwich | 17.4% | 13.5%(+3.94)#61 | 11.2%(+6.23)#3,560 |
| 62. | South Dennis | 17.4% | 13.5%(+3.88)#62 | 11.2%(+6.18)#3,582 |
| 63. | Beverly | 17.4% | 13.5%(+3.88)#63 | 11.2%(+6.18)#3,593 |
| 64. | Milton | 17.4% | 13.5%(+3.86)#64 | 11.2%(+6.15)#3,605 |
| 65. | Westborough | 17.3% | 13.5%(+3.83)#65 | 11.2%(+6.12)#3,625 |
| 66. | East Brookfield | 17.3% | 13.5%(+3.79)#66 | 11.2%(+6.08)#3,652 |
| 67. | Yarmouth Port | 17.2% | 13.5%(+3.71)#67 | 11.2%(+6.00)#3,679 |
| 68. | Dover | 17.1% | 13.5%(+3.60)#68 | 11.2%(+5.90)#3,759 |
| 69. | Hopedale | 17.1% | 13.5%(+3.55)#69 | 11.2%(+5.85)#3,786 |
| 70. | Sharon | 16.9% | 13.5%(+3.34)#70 | 11.2%(+5.64)#3,891 |
| 71. | Hingham | 16.7% | 13.5%(+3.20)#71 | 11.2%(+5.50)#3,955 |
| 72. | Bridgewater Town | 16.7% | 13.5%(+3.17)#72 | 11.2%(+5.46)#3,974 |
| 73. | Hanson | 16.7% | 13.5%(+3.16)#73 | 11.2%(+5.45)#3,980 |
| 74. | Belchertown | 16.6% | 13.5%(+3.13)#74 | 11.2%(+5.43)#4,043 |
| 75. | South Duxbury | 16.6% | 13.5%(+3.09)#75 | 11.2%(+5.39)#4,064 |
| 76. | Walpole | 16.6% | 13.5%(+3.08)#76 | 11.2%(+5.38)#4,071 |
| 77. | Marblehead | 16.5% | 13.5%(+3.00)#77 | 11.2%(+5.30)#4,138 |
| 78. | Cochituate | 16.4% | 13.5%(+2.88)#78 | 11.2%(+5.18)#4,206 |
| 79. | North Eastham | 16.4% | 13.5%(+2.88)#79 | 11.2%(+5.17)#4,208 |
| 80. | East Sandwich | 16.4% | 13.5%(+2.85)#80 | 11.2%(+5.14)#4,233 |
| 81. | Orange | 16.3% | 13.5%(+2.76)#81 | 11.2%(+5.05)#4,295 |
| 82. | Marshfield | 16.1% | 13.5%(+2.61)#82 | 11.2%(+4.90)#4,391 |
| 83. | Salisbury | 16.0% | 13.5%(+2.49)#83 | 11.2%(+4.79)#4,470 |
| 84. | Waltham | 15.9% | 13.5%(+2.40)#84 | 11.2%(+4.70)#4,535 |
| 85. | Provincetown | 15.9% | 13.5%(+2.37)#85 | 11.2%(+4.66)#4,567 |
| 86. | North Brookfield | 15.8% | 13.5%(+2.32)#86 | 11.2%(+4.62)#4,606 |
| 87. | Lexington | 15.8% | 13.5%(+2.27)#87 | 11.2%(+4.57)#4,653 |
| 88. | Hull | 15.5% | 13.5%(+2.00)#88 | 11.2%(+4.30)#4,870 |
| 89. | Reading | 15.5% | 13.5%(+1.99)#89 | 11.2%(+4.29)#4,883 |
| 90. | Winchester | 15.5% | 13.5%(+1.96)#90 | 11.2%(+4.26)#4,906 |
| 91. | Acushnet Center | 15.4% | 13.5%(+1.89)#91 | 11.2%(+4.19)#4,955 |
| 92. | Boston | 15.3% | 13.5%(+1.80)#92 | 11.2%(+4.10)#5,041 |
| 93. | Wakefield | 15.2% | 13.5%(+1.73)#93 | 11.2%(+4.03)#5,097 |
| 94. | West Springfield Town | 15.0% | 13.5%(+1.49)#94 | 11.2%(+3.79)#5,323 |
| 95. | North Falmouth | 14.9% | 13.5%(+1.40)#95 | 11.2%(+3.70)#5,415 |
| 96. | Salem | 14.9% | 13.5%(+1.36)#96 | 11.2%(+3.66)#5,446 |
| 97. | Dedham | 14.8% | 13.5%(+1.32)#97 | 11.2%(+3.62)#5,490 |
| 98. | Hudson | 14.8% | 13.5%(+1.31)#98 | 11.2%(+3.61)#5,504 |
| 99. | North Pembroke | 14.7% | 13.5%(+1.19)#99 | 11.2%(+3.49)#5,633 |
| 100. | Falmouth | 14.6% | 13.5%(+1.11)#100 | 11.2%(+3.40)#5,732 |
Common Questions
What are the Top 10 Cities with the Highest Percentage of Population Employed in Community & Social Service in Massachusetts?
Top 10 Cities with the Highest Percentage of Population Employed in Community & Social Service in Massachusetts are:
#1
50.5%
#2
49.6%
#3
36.7%
#4
35.1%
#5
34.7%
#6
32.0%
#7
30.6%
#8
29.8%
#9
27.7%
#10
27.1%
What city has the Highest Percentage of Population Employed in Community & Social Service in Massachusetts?
Deerfield has the Highest Percentage of Population Employed in Community & Social Service in Massachusetts with 50.5%.
What is the Percentage of Population Employed in Community & Social Service in the State of Massachusetts?
Percentage of Population Employed in Community & Social Service in Massachusetts is 13.5%.
What is the Percentage of Population Employed in Community & Social Service in the United States?
Percentage of Population Employed in Community & Social Service in the United States is 11.2%.