Zip Codes with the Highest Percentage of Population Employed in Community & Social Service in Compton, CA
RELATED REPORTS & OPTIONS
Community & Social Service
Compton
Compare Zip Codes
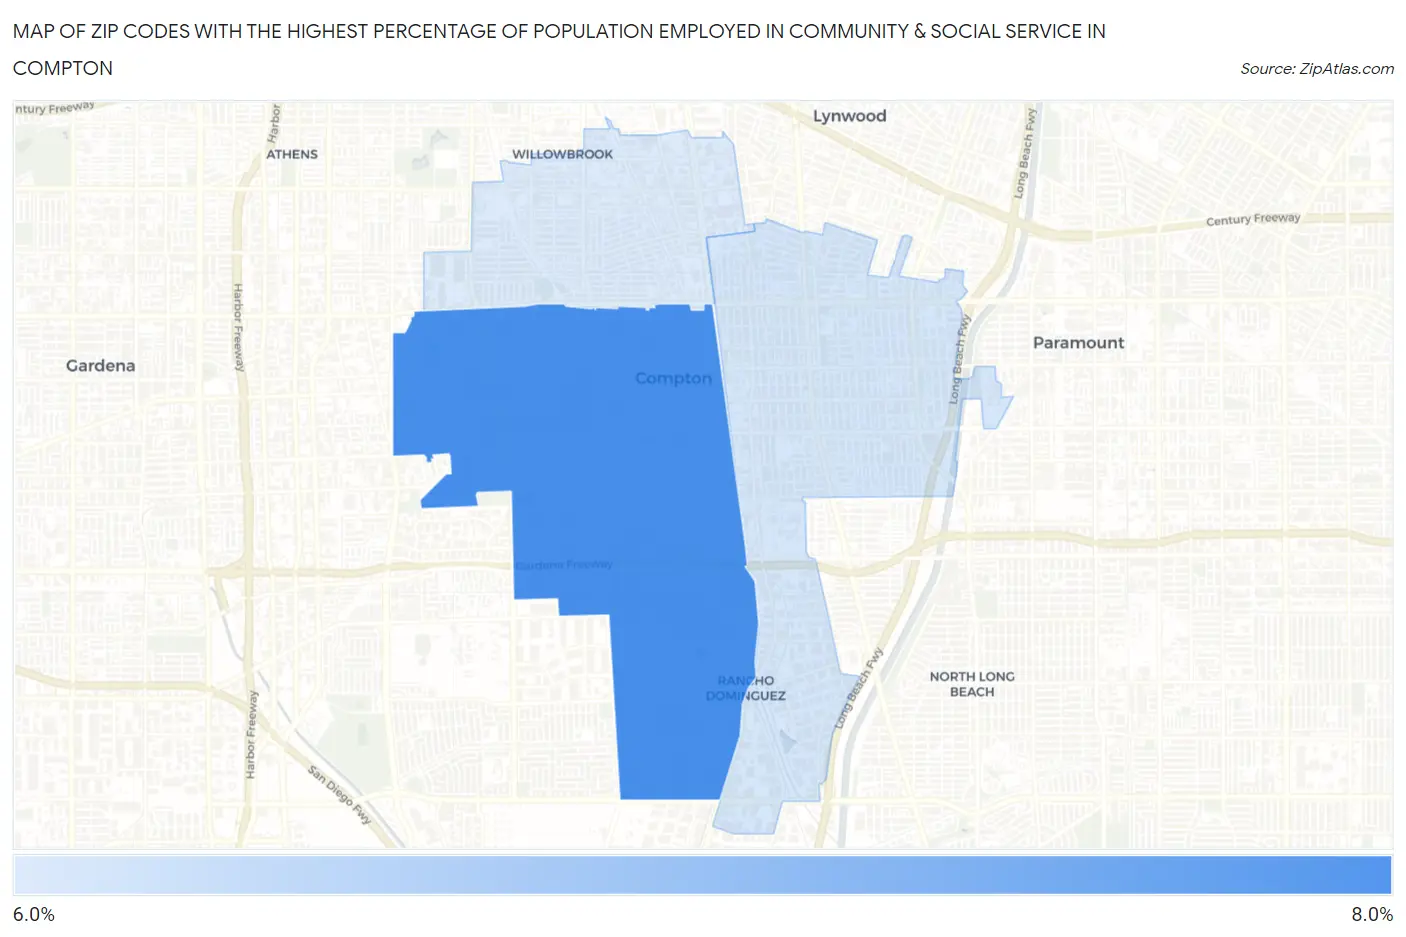
Map of Zip Codes with the Highest Percentage of Population Employed in Community & Social Service in Compton
6.2%
7.7%
Zip Codes with the Highest Percentage of Population Employed in Community & Social Service in Compton, CA
| Zip Code | % Employed | vs State | vs National | |
| 1. | 90220 | 7.7% | 11.5%(-3.75)#1,194 | 11.2%(-3.48)#20,295 |
| 2. | 90221 | 6.3% | 11.5%(-5.23)#1,378 | 11.2%(-4.96)#23,819 |
| 3. | 90222 | 6.2% | 11.5%(-5.30)#1,388 | 11.2%(-5.03)#23,966 |
1
Common Questions
What are the Top Zip Codes with the Highest Percentage of Population Employed in Community & Social Service in Compton, CA?
Top Zip Codes with the Highest Percentage of Population Employed in Community & Social Service in Compton, CA are:
What zip code has the Highest Percentage of Population Employed in Community & Social Service in Compton, CA?
90220 has the Highest Percentage of Population Employed in Community & Social Service in Compton, CA with 7.7%.
What is the Percentage of Population Employed in Community & Social Service in Compton, CA?
Percentage of Population Employed in Community & Social Service in Compton is 6.4%.
What is the Percentage of Population Employed in Community & Social Service in California?
Percentage of Population Employed in Community & Social Service in California is 11.5%.
What is the Percentage of Population Employed in Community & Social Service in the United States?
Percentage of Population Employed in Community & Social Service in the United States is 11.2%.