Cities with the Highest Percentage of Population Employed in Community & Social Service in West Virginia
RELATED REPORTS & OPTIONS
Community & Social Service
West Virginia
Compare Cities
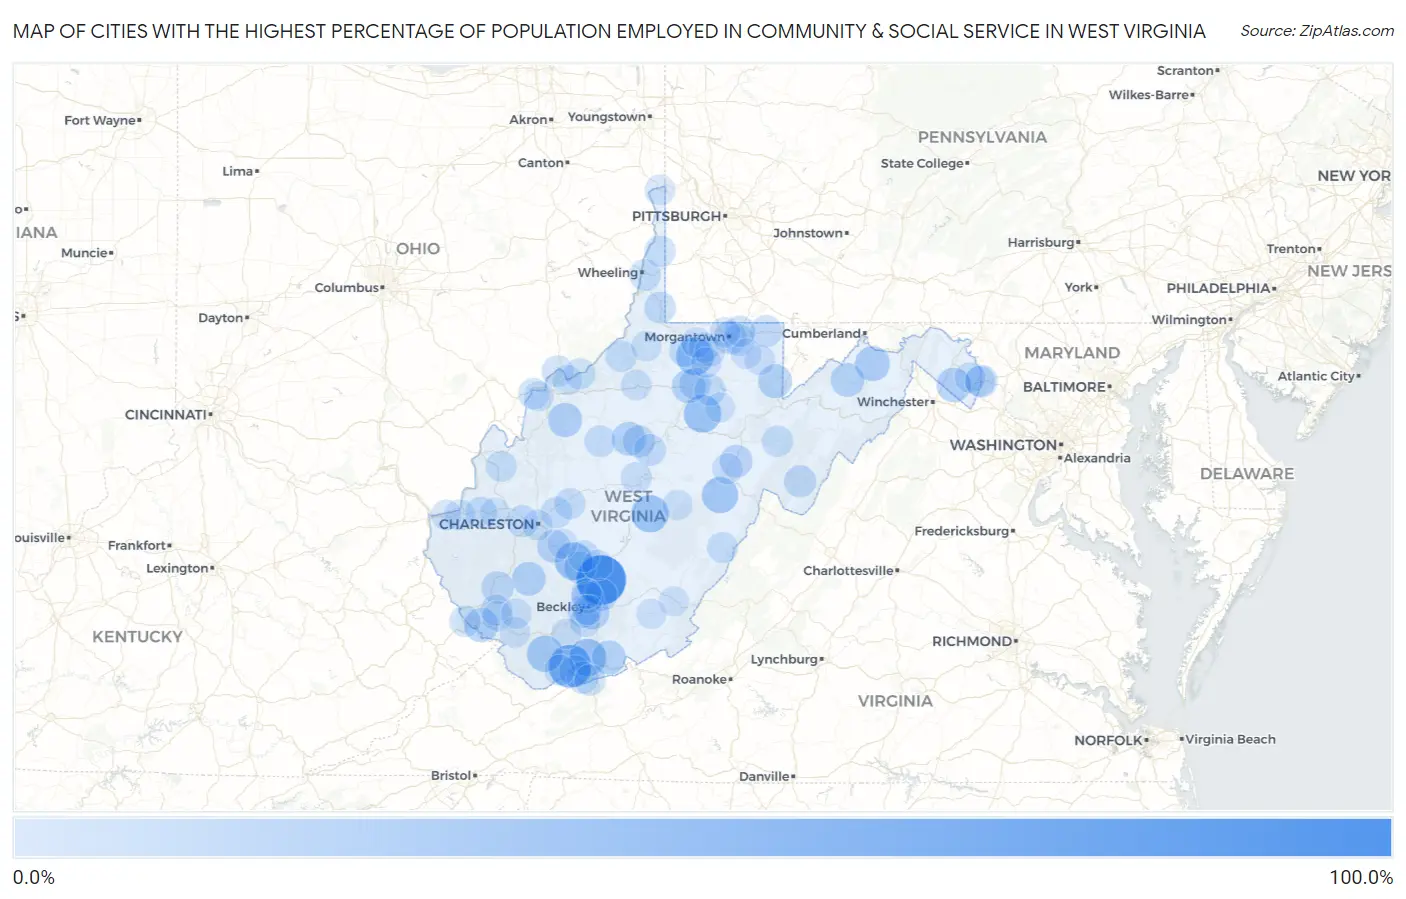
Map of Cities with the Highest Percentage of Population Employed in Community & Social Service in West Virginia
0.0%
100.0%
Cities with the Highest Percentage of Population Employed in Community & Social Service in West Virginia
| City | % Employed | vs State | vs National | |
| 1. | Hansford | 100.0% | 11.0%(+89.0)#1 | 11.2%(+88.8)#7 |
| 2. | Thurmond | 100.0% | 11.0%(+89.0)#2 | 11.2%(+88.8)#49 |
| 3. | Maybeury | 68.3% | 11.0%(+57.3)#3 | 11.2%(+57.1)#92 |
| 4. | Powellton | 46.9% | 11.0%(+35.9)#4 | 11.2%(+35.7)#242 |
| 5. | Idamay | 46.7% | 11.0%(+35.7)#5 | 11.2%(+35.5)#244 |
| 6. | Century | 45.8% | 11.0%(+34.8)#6 | 11.2%(+34.6)#254 |
| 7. | Lashmeet | 45.4% | 11.0%(+34.4)#7 | 11.2%(+34.2)#260 |
| 8. | Tioga | 45.2% | 11.0%(+34.2)#8 | 11.2%(+34.0)#267 |
| 9. | Welch | 40.1% | 11.0%(+29.1)#9 | 11.2%(+28.9)#348 |
| 10. | Valley Head | 40.0% | 11.0%(+29.0)#10 | 11.2%(+28.8)#355 |
| 11. | Springfield | 34.0% | 11.0%(+22.9)#11 | 11.2%(+22.7)#542 |
| 12. | Middleway | 32.0% | 11.0%(+21.0)#12 | 11.2%(+20.8)#638 |
| 13. | Red Jacket | 31.2% | 11.0%(+20.2)#13 | 11.2%(+20.0)#676 |
| 14. | Elizabeth | 30.9% | 11.0%(+19.9)#14 | 11.2%(+19.7)#691 |
| 15. | Aurora | 30.1% | 11.0%(+19.1)#15 | 11.2%(+18.9)#745 |
| 16. | Despard | 30.1% | 11.0%(+19.1)#16 | 11.2%(+18.9)#748 |
| 17. | Athens | 29.9% | 11.0%(+18.9)#17 | 11.2%(+18.7)#764 |
| 18. | Glenville | 29.4% | 11.0%(+18.4)#18 | 11.2%(+18.2)#804 |
| 19. | Beaver | 29.3% | 11.0%(+18.3)#19 | 11.2%(+18.1)#805 |
| 20. | Burlington | 29.2% | 11.0%(+18.2)#20 | 11.2%(+18.0)#812 |
| 21. | Van | 29.2% | 11.0%(+18.2)#21 | 11.2%(+18.0)#814 |
| 22. | Chelyan | 26.5% | 11.0%(+15.4)#22 | 11.2%(+15.2)#1,061 |
| 23. | East Dailey | 25.3% | 11.0%(+14.3)#23 | 11.2%(+14.1)#1,171 |
| 24. | Morgantown | 25.1% | 11.0%(+14.1)#24 | 11.2%(+13.9)#1,203 |
| 25. | Crab Orchard | 24.9% | 11.0%(+13.9)#25 | 11.2%(+13.7)#1,247 |
| 26. | Harpers Ferry | 24.4% | 11.0%(+13.4)#26 | 11.2%(+13.2)#1,316 |
| 27. | Mitchell Heights | 23.6% | 11.0%(+12.6)#27 | 11.2%(+12.3)#1,481 |
| 28. | Prince | 23.5% | 11.0%(+12.5)#28 | 11.2%(+12.3)#1,486 |
| 29. | Page | 23.4% | 11.0%(+12.4)#29 | 11.2%(+12.2)#1,520 |
| 30. | Franklin | 23.3% | 11.0%(+12.3)#30 | 11.2%(+12.1)#1,537 |
| 31. | Sand Fork | 22.5% | 11.0%(+11.5)#31 | 11.2%(+11.3)#1,714 |
| 32. | Prosperity | 22.5% | 11.0%(+11.5)#32 | 11.2%(+11.3)#1,715 |
| 33. | Cottageville | 22.4% | 11.0%(+11.4)#33 | 11.2%(+11.2)#1,722 |
| 34. | West Dunbar | 21.8% | 11.0%(+10.8)#34 | 11.2%(+10.6)#1,857 |
| 35. | Brandonville | 21.8% | 11.0%(+10.8)#35 | 11.2%(+10.6)#1,872 |
| 36. | Brush Fork | 21.8% | 11.0%(+10.8)#36 | 11.2%(+10.6)#1,873 |
| 37. | Bramwell | 21.7% | 11.0%(+10.7)#37 | 11.2%(+10.5)#1,879 |
| 38. | Burnsville | 21.5% | 11.0%(+10.5)#38 | 11.2%(+10.3)#1,927 |
| 39. | Jefferson | 21.5% | 11.0%(+10.5)#39 | 11.2%(+10.3)#1,943 |
| 40. | Bridgeport | 21.2% | 11.0%(+10.2)#40 | 11.2%(+9.99)#2,009 |
| 41. | Cameron | 20.7% | 11.0%(+9.70)#41 | 11.2%(+9.50)#2,141 |
| 42. | Bethlehem | 20.5% | 11.0%(+9.49)#42 | 11.2%(+9.28)#2,204 |
| 43. | Charlton Heights | 20.1% | 11.0%(+9.07)#43 | 11.2%(+8.86)#2,363 |
| 44. | Milton | 20.0% | 11.0%(+9.01)#44 | 11.2%(+8.80)#2,377 |
| 45. | Elkview | 19.7% | 11.0%(+8.68)#45 | 11.2%(+8.47)#2,520 |
| 46. | Williamstown | 19.5% | 11.0%(+8.53)#46 | 11.2%(+8.33)#2,590 |
| 47. | Middlebourne | 19.5% | 11.0%(+8.49)#47 | 11.2%(+8.28)#2,605 |
| 48. | Grantsville | 19.4% | 11.0%(+8.44)#48 | 11.2%(+8.23)#2,625 |
| 49. | Flemington | 19.4% | 11.0%(+8.35)#49 | 11.2%(+8.14)#2,658 |
| 50. | Brookhaven | 19.3% | 11.0%(+8.31)#50 | 11.2%(+8.11)#2,676 |
| 51. | Mannington | 19.2% | 11.0%(+8.20)#51 | 11.2%(+7.99)#2,719 |
| 52. | Malden | 19.0% | 11.0%(+7.98)#52 | 11.2%(+7.77)#2,796 |
| 53. | Bluefield | 18.9% | 11.0%(+7.85)#53 | 11.2%(+7.64)#2,861 |
| 54. | Harman | 18.8% | 11.0%(+7.74)#54 | 11.2%(+7.54)#2,905 |
| 55. | Clendenin | 18.7% | 11.0%(+7.66)#55 | 11.2%(+7.45)#2,932 |
| 56. | Williamson | 18.6% | 11.0%(+7.64)#56 | 11.2%(+7.43)#2,943 |
| 57. | Bethany | 18.6% | 11.0%(+7.62)#57 | 11.2%(+7.41)#2,954 |
| 58. | Justice Addition | 18.4% | 11.0%(+7.38)#58 | 11.2%(+7.18)#3,064 |
| 59. | Washington | 18.4% | 11.0%(+7.36)#59 | 11.2%(+7.15)#3,072 |
| 60. | Omar | 18.4% | 11.0%(+7.36)#60 | 11.2%(+7.15)#3,073 |
| 61. | Institute | 18.2% | 11.0%(+7.18)#61 | 11.2%(+6.97)#3,159 |
| 62. | Huntersville | 18.2% | 11.0%(+7.18)#62 | 11.2%(+6.97)#3,176 |
| 63. | Leon | 18.1% | 11.0%(+7.08)#63 | 11.2%(+6.87)#3,216 |
| 64. | Cheat Lake | 17.7% | 11.0%(+6.74)#64 | 11.2%(+6.53)#3,379 |
| 65. | Belmont | 17.7% | 11.0%(+6.74)#65 | 11.2%(+6.53)#3,380 |
| 66. | Pea Ridge | 17.6% | 11.0%(+6.56)#66 | 11.2%(+6.35)#3,479 |
| 67. | Coal City | 17.6% | 11.0%(+6.55)#67 | 11.2%(+6.34)#3,485 |
| 68. | Dupont | 17.5% | 11.0%(+6.52)#68 | 11.2%(+6.31)#3,506 |
| 69. | Gassaway | 17.2% | 11.0%(+6.16)#69 | 11.2%(+5.95)#3,717 |
| 70. | Shenandoah Junction | 17.1% | 11.0%(+6.12)#70 | 11.2%(+5.91)#3,749 |
| 71. | Charleston | 17.0% | 11.0%(+6.01)#71 | 11.2%(+5.80)#3,805 |
| 72. | Anawalt | 16.7% | 11.0%(+5.66)#72 | 11.2%(+5.45)#4,005 |
| 73. | Fayetteville | 16.6% | 11.0%(+5.60)#73 | 11.2%(+5.39)#4,061 |
| 74. | Mill Creek | 16.5% | 11.0%(+5.54)#74 | 11.2%(+5.33)#4,107 |
| 75. | West Union | 16.5% | 11.0%(+5.46)#75 | 11.2%(+5.25)#4,162 |
| 76. | Huntington | 16.3% | 11.0%(+5.27)#76 | 11.2%(+5.06)#4,292 |
| 77. | Kingwood | 16.1% | 11.0%(+5.08)#77 | 11.2%(+4.87)#4,413 |
| 78. | Sarah Ann | 15.9% | 11.0%(+4.85)#78 | 11.2%(+4.64)#4,583 |
| 79. | Justice | 15.8% | 11.0%(+4.83)#79 | 11.2%(+4.62)#4,604 |
| 80. | Fairview | 15.8% | 11.0%(+4.78)#80 | 11.2%(+4.58)#4,639 |
| 81. | Mullens | 15.7% | 11.0%(+4.71)#81 | 11.2%(+4.50)#4,698 |
| 82. | Chester | 15.7% | 11.0%(+4.65)#82 | 11.2%(+4.44)#4,755 |
| 83. | Reedsville | 15.6% | 11.0%(+4.56)#83 | 11.2%(+4.35)#4,823 |
| 84. | Mallory | 15.5% | 11.0%(+4.48)#84 | 11.2%(+4.27)#4,893 |
| 85. | Grant Town | 15.4% | 11.0%(+4.43)#85 | 11.2%(+4.23)#4,925 |
| 86. | Star City | 15.4% | 11.0%(+4.37)#86 | 11.2%(+4.16)#4,993 |
| 87. | Pine Grove | 15.2% | 11.0%(+4.18)#87 | 11.2%(+3.98)#5,152 |
| 88. | Rivesville | 15.1% | 11.0%(+4.05)#88 | 11.2%(+3.84)#5,273 |
| 89. | Bolivar | 15.0% | 11.0%(+4.04)#89 | 11.2%(+3.83)#5,284 |
| 90. | Addison Webster Springs | 14.9% | 11.0%(+3.91)#90 | 11.2%(+3.71)#5,409 |
| 91. | Pleasant Valley | 14.9% | 11.0%(+3.85)#91 | 11.2%(+3.64)#5,459 |
| 92. | Bradley | 14.8% | 11.0%(+3.80)#92 | 11.2%(+3.59)#5,525 |
| 93. | Lewisburg | 14.7% | 11.0%(+3.74)#93 | 11.2%(+3.53)#5,585 |
| 94. | Lubeck | 14.7% | 11.0%(+3.72)#94 | 11.2%(+3.51)#5,604 |
| 95. | Macarthur | 14.6% | 11.0%(+3.61)#95 | 11.2%(+3.40)#5,734 |
| 96. | Waverly | 14.5% | 11.0%(+3.47)#96 | 11.2%(+3.26)#5,865 |
| 97. | Hurricane | 14.4% | 11.0%(+3.44)#97 | 11.2%(+3.23)#5,895 |
| 98. | Alderson | 14.4% | 11.0%(+3.43)#98 | 11.2%(+3.22)#5,912 |
| 99. | Glasgow | 14.2% | 11.0%(+3.17)#99 | 11.2%(+2.96)#6,192 |
| 100. | Philippi | 14.0% | 11.0%(+3.04)#100 | 11.2%(+2.83)#6,343 |
Common Questions
What are the Top 10 Cities with the Highest Percentage of Population Employed in Community & Social Service in West Virginia?
Top 10 Cities with the Highest Percentage of Population Employed in Community & Social Service in West Virginia are:
#1
100.0%
#2
68.3%
#3
46.9%
#4
46.7%
#5
45.8%
#6
45.4%
#7
45.2%
#8
40.1%
#9
40.0%
#10
34.0%
What city has the Highest Percentage of Population Employed in Community & Social Service in West Virginia?
Thurmond has the Highest Percentage of Population Employed in Community & Social Service in West Virginia with 100.0%.
What is the Percentage of Population Employed in Community & Social Service in the State of West Virginia?
Percentage of Population Employed in Community & Social Service in West Virginia is 11.0%.
What is the Percentage of Population Employed in Community & Social Service in the United States?
Percentage of Population Employed in Community & Social Service in the United States is 11.2%.