Cities with the Highest Percentage of Eastern European Population in Virginia
RELATED REPORTS & OPTIONS
Eastern European
Virginia
Compare Cities
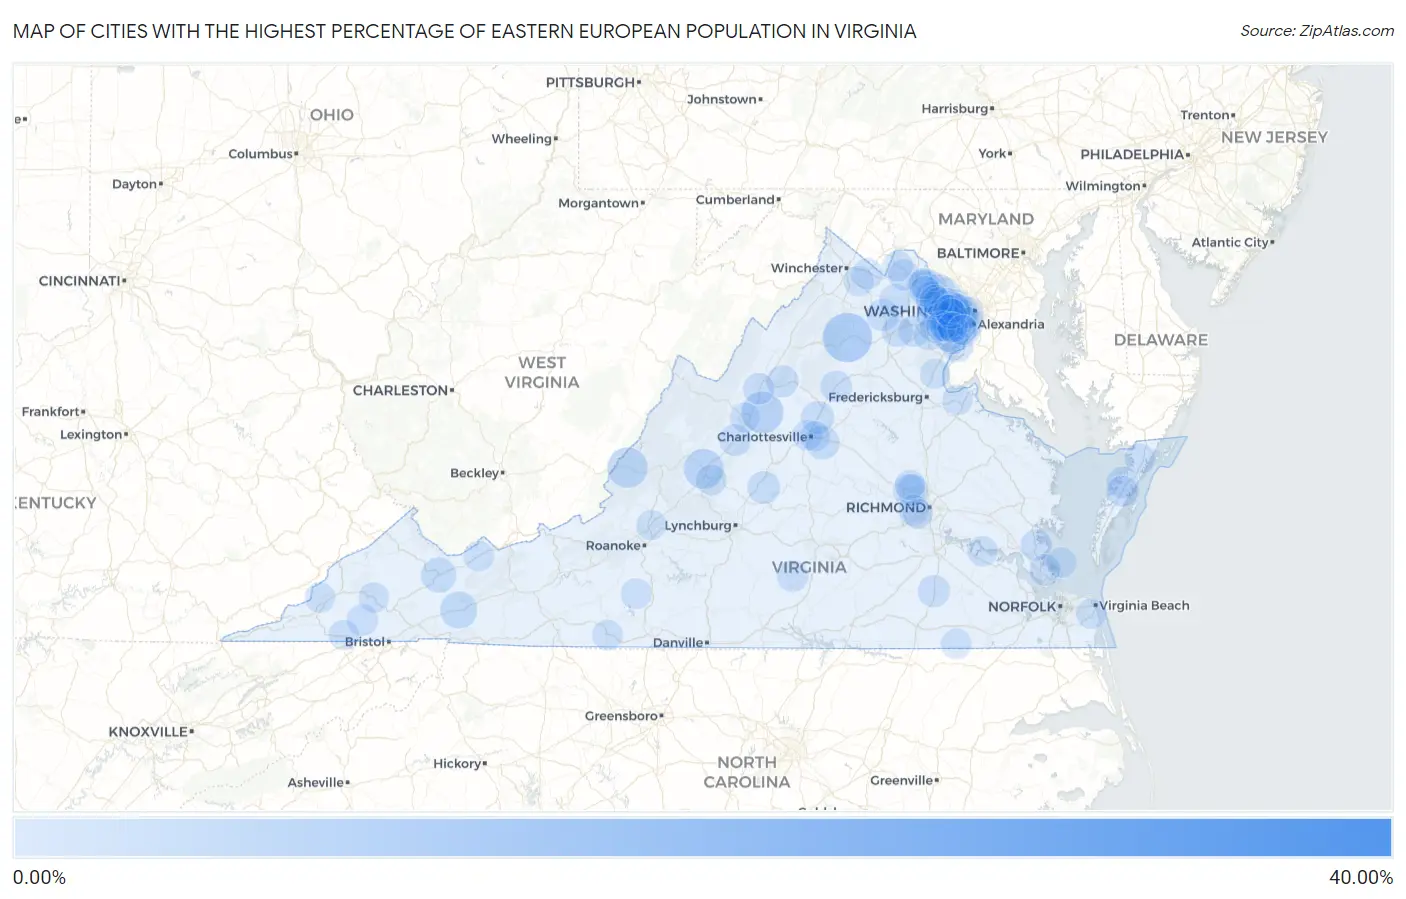
Map of Cities with the Highest Percentage of Eastern European Population in Virginia
0.00%
40.00%
Cities with the Highest Percentage of Eastern European Population in Virginia
| City | Eastern European | vs State | vs National | |
| 1. | Schooner Bay | 34.04% | 0.29%(+33.8)#1 | 0.30%(+33.7)#10 |
| 2. | Washington | 7.41% | 0.29%(+7.12)#2 | 0.30%(+7.10)#72 |
| 3. | New Hope | 4.64% | 0.29%(+4.35)#3 | 0.30%(+4.33)#184 |
| 4. | Callaghan | 4.10% | 0.29%(+3.81)#4 | 0.30%(+3.80)#230 |
| 5. | East Lexington | 3.93% | 0.29%(+3.65)#5 | 0.30%(+3.63)#246 |
| 6. | Mantua | 3.09% | 0.29%(+2.81)#6 | 0.30%(+2.79)#358 |
| 7. | Mcmullin | 2.92% | 0.29%(+2.63)#7 | 0.30%(+2.61)#392 |
| 8. | Ravensworth | 2.74% | 0.29%(+2.46)#8 | 0.30%(+2.44)#424 |
| 9. | Claypool Hill | 2.21% | 0.29%(+1.93)#9 | 0.30%(+1.91)#602 |
| 10. | Falls Church | 2.21% | 0.29%(+1.92)#10 | 0.30%(+1.91)#607 |
| 11. | Difficult Run | 2.15% | 0.29%(+1.86)#11 | 0.30%(+1.84)#629 |
| 12. | Greenbriar | 2.05% | 0.29%(+1.77)#12 | 0.30%(+1.75)#679 |
| 13. | Lake Barcroft | 1.78% | 0.29%(+1.49)#13 | 0.30%(+1.47)#825 |
| 14. | Rivanna | 1.77% | 0.29%(+1.49)#14 | 0.30%(+1.47)#827 |
| 15. | Goose Creek | 1.54% | 0.29%(+1.26)#15 | 0.30%(+1.24)#975 |
| 16. | Dunn Loring | 1.53% | 0.29%(+1.24)#16 | 0.30%(+1.22)#997 |
| 17. | University Center | 1.44% | 0.29%(+1.16)#17 | 0.30%(+1.14)#1,066 |
| 18. | Long Branch | 1.40% | 0.29%(+1.12)#18 | 0.30%(+1.10)#1,102 |
| 19. | Piney Mountain | 1.37% | 0.29%(+1.08)#19 | 0.30%(+1.06)#1,143 |
| 20. | Floris | 1.32% | 0.29%(+1.04)#20 | 0.30%(+1.02)#1,197 |
| 21. | Arrington | 1.31% | 0.29%(+1.02)#21 | 0.30%(+1.00)#1,215 |
| 22. | Belmont | 1.22% | 0.29%(+0.938)#22 | 0.30%(+0.920)#1,321 |
| 23. | Great Falls | 1.18% | 0.29%(+0.890)#23 | 0.30%(+0.872)#1,385 |
| 24. | Stony Creek | 1.14% | 0.29%(+0.857)#24 | 0.30%(+0.839)#1,434 |
| 25. | Onancock | 1.12% | 0.29%(+0.830)#25 | 0.30%(+0.812)#1,474 |
| 26. | Massanutten | 1.10% | 0.29%(+0.812)#26 | 0.30%(+0.794)#1,511 |
| 27. | Kings Park West | 1.09% | 0.29%(+0.808)#27 | 0.30%(+0.790)#1,521 |
| 28. | Kings Park | 1.07% | 0.29%(+0.788)#28 | 0.30%(+0.770)#1,554 |
| 29. | Lowes Island | 1.07% | 0.29%(+0.779)#29 | 0.30%(+0.762)#1,568 |
| 30. | Greenville | 1.06% | 0.29%(+0.776)#30 | 0.30%(+0.758)#1,573 |
| 31. | Short Pump | 1.05% | 0.29%(+0.763)#31 | 0.30%(+0.746)#1,592 |
| 32. | Oak Grove | 1.03% | 0.29%(+0.740)#32 | 0.30%(+0.723)#1,633 |
| 33. | Marshall | 1.02% | 0.29%(+0.736)#33 | 0.30%(+0.718)#1,637 |
| 34. | Mclean | 1.00% | 0.29%(+0.714)#34 | 0.30%(+0.697)#1,681 |
| 35. | Hayfield | 0.98% | 0.29%(+0.694)#35 | 0.30%(+0.676)#1,727 |
| 36. | Franklin Farm | 0.98% | 0.29%(+0.693)#36 | 0.30%(+0.675)#1,729 |
| 37. | Middleburg | 0.93% | 0.29%(+0.647)#37 | 0.30%(+0.629)#1,832 |
| 38. | Arlington | 0.93% | 0.29%(+0.641)#38 | 0.30%(+0.624)#1,845 |
| 39. | Big Stone Gap East | 0.91% | 0.29%(+0.629)#39 | 0.30%(+0.611)#1,868 |
| 40. | Gloucester Point | 0.91% | 0.29%(+0.622)#40 | 0.30%(+0.604)#1,882 |
| 41. | Bethel Manor | 0.86% | 0.29%(+0.573)#41 | 0.30%(+0.556)#1,998 |
| 42. | Innsbrook | 0.85% | 0.29%(+0.565)#42 | 0.30%(+0.547)#2,019 |
| 43. | Wolf Trap | 0.83% | 0.29%(+0.548)#43 | 0.30%(+0.530)#2,069 |
| 44. | Nickelsville | 0.83% | 0.29%(+0.547)#44 | 0.30%(+0.530)#2,071 |
| 45. | New Baltimore | 0.83% | 0.29%(+0.540)#45 | 0.30%(+0.522)#2,098 |
| 46. | Linton Hall | 0.81% | 0.29%(+0.529)#46 | 0.30%(+0.511)#2,135 |
| 47. | Mount Crawford | 0.79% | 0.29%(+0.500)#47 | 0.30%(+0.482)#2,217 |
| 48. | Madison | 0.78% | 0.29%(+0.497)#48 | 0.30%(+0.480)#2,221 |
| 49. | Mason Neck | 0.78% | 0.29%(+0.490)#49 | 0.30%(+0.473)#2,245 |
| 50. | Fairfax | 0.77% | 0.29%(+0.485)#50 | 0.30%(+0.468)#2,264 |
| 51. | Oakton | 0.76% | 0.29%(+0.475)#51 | 0.30%(+0.457)#2,300 |
| 52. | Hamilton | 0.74% | 0.29%(+0.456)#52 | 0.30%(+0.438)#2,361 |
| 53. | Laurel Hill | 0.74% | 0.29%(+0.450)#53 | 0.30%(+0.432)#2,380 |
| 54. | Charlotte Court House | 0.72% | 0.29%(+0.432)#54 | 0.30%(+0.415)#2,445 |
| 55. | Melfa | 0.69% | 0.29%(+0.402)#55 | 0.30%(+0.384)#2,538 |
| 56. | Buena Vista | 0.68% | 0.29%(+0.392)#56 | 0.30%(+0.374)#2,575 |
| 57. | Braddock | 0.66% | 0.29%(+0.374)#57 | 0.30%(+0.357)#2,631 |
| 58. | Hillsboro | 0.66% | 0.29%(+0.372)#58 | 0.30%(+0.354)#2,644 |
| 59. | Fair Oaks | 0.65% | 0.29%(+0.369)#59 | 0.30%(+0.351)#2,653 |
| 60. | One Loudoun | 0.65% | 0.29%(+0.362)#60 | 0.30%(+0.344)#2,674 |
| 61. | Pimmit Hills | 0.65% | 0.29%(+0.360)#61 | 0.30%(+0.342)#2,678 |
| 62. | Ferrum | 0.64% | 0.29%(+0.355)#62 | 0.30%(+0.337)#2,696 |
| 63. | Burke | 0.64% | 0.29%(+0.354)#63 | 0.30%(+0.336)#2,700 |
| 64. | Bon Air | 0.62% | 0.29%(+0.339)#64 | 0.30%(+0.321)#2,775 |
| 65. | Lansdowne | 0.62% | 0.29%(+0.337)#65 | 0.30%(+0.319)#2,780 |
| 66. | Great Falls Crossing | 0.62% | 0.29%(+0.330)#66 | 0.30%(+0.312)#2,816 |
| 67. | Berryville | 0.61% | 0.29%(+0.323)#67 | 0.30%(+0.305)#2,845 |
| 68. | University Of Virginia | 0.60% | 0.29%(+0.315)#68 | 0.30%(+0.297)#2,878 |
| 69. | Stuart | 0.59% | 0.29%(+0.301)#69 | 0.30%(+0.283)#2,925 |
| 70. | Crosspointe | 0.58% | 0.29%(+0.298)#70 | 0.30%(+0.281)#2,940 |
| 71. | Hallwood | 0.58% | 0.29%(+0.295)#71 | 0.30%(+0.278)#2,959 |
| 72. | Ashburn | 0.57% | 0.29%(+0.283)#72 | 0.30%(+0.266)#3,006 |
| 73. | Clifton | 0.56% | 0.29%(+0.273)#73 | 0.30%(+0.255)#3,050 |
| 74. | Alexandria | 0.55% | 0.29%(+0.269)#74 | 0.30%(+0.251)#3,073 |
| 75. | Buckhall | 0.55% | 0.29%(+0.261)#75 | 0.30%(+0.244)#3,108 |
| 76. | Boykins | 0.55% | 0.29%(+0.259)#76 | 0.30%(+0.242)#3,120 |
| 77. | Burke Centre | 0.53% | 0.29%(+0.244)#77 | 0.30%(+0.226)#3,196 |
| 78. | Reston | 0.52% | 0.29%(+0.235)#78 | 0.30%(+0.218)#3,246 |
| 79. | Poquoson | 0.52% | 0.29%(+0.235)#79 | 0.30%(+0.217)#3,248 |
| 80. | Tysons | 0.51% | 0.29%(+0.221)#80 | 0.30%(+0.203)#3,307 |
| 81. | Springville | 0.49% | 0.29%(+0.206)#81 | 0.30%(+0.188)#3,382 |
| 82. | Vienna | 0.48% | 0.29%(+0.196)#82 | 0.30%(+0.178)#3,441 |
| 83. | Fairfax Station | 0.48% | 0.29%(+0.195)#83 | 0.30%(+0.177)#3,448 |
| 84. | Pantops | 0.48% | 0.29%(+0.191)#84 | 0.30%(+0.174)#3,477 |
| 85. | King George | 0.48% | 0.29%(+0.191)#85 | 0.30%(+0.173)#3,483 |
| 86. | Claremont | 0.48% | 0.29%(+0.189)#86 | 0.30%(+0.171)#3,495 |
| 87. | Gate City | 0.47% | 0.29%(+0.185)#87 | 0.30%(+0.167)#3,516 |
| 88. | St Paul | 0.44% | 0.29%(+0.157)#88 | 0.30%(+0.139)#3,661 |
| 89. | Appalachia | 0.44% | 0.29%(+0.156)#89 | 0.30%(+0.138)#3,669 |
| 90. | Troutville | 0.43% | 0.29%(+0.142)#90 | 0.30%(+0.125)#3,749 |
| 91. | Merrifield | 0.43% | 0.29%(+0.141)#91 | 0.30%(+0.123)#3,756 |
| 92. | Herndon | 0.43% | 0.29%(+0.139)#92 | 0.30%(+0.122)#3,763 |
| 93. | Staunton | 0.42% | 0.29%(+0.136)#93 | 0.30%(+0.118)#3,784 |
| 94. | Wyndham | 0.42% | 0.29%(+0.135)#94 | 0.30%(+0.117)#3,793 |
| 95. | Boyce | 0.42% | 0.29%(+0.132)#95 | 0.30%(+0.115)#3,816 |
| 96. | Aquia Harbour | 0.42% | 0.29%(+0.131)#96 | 0.30%(+0.114)#3,825 |
| 97. | Virginia Beach | 0.40% | 0.29%(+0.117)#97 | 0.30%(+0.099)#3,924 |
| 98. | Manchester | 0.40% | 0.29%(+0.116)#98 | 0.30%(+0.099)#3,931 |
| 99. | West Springfield | 0.40% | 0.29%(+0.116)#99 | 0.30%(+0.098)#3,934 |
| 100. | Kingstowne | 0.40% | 0.29%(+0.114)#100 | 0.30%(+0.097)#3,947 |
Common Questions
What are the Top 10 Cities with the Highest Percentage of Eastern European Population in Virginia?
Top 10 Cities with the Highest Percentage of Eastern European Population in Virginia are:
#1
7.41%
#2
4.64%
#3
4.10%
#4
3.93%
#5
3.09%
#6
2.92%
#7
2.74%
#8
2.21%
#9
2.21%
#10
2.05%
What city has the Highest Percentage of Eastern European Population in Virginia?
Washington has the Highest Percentage of Eastern European Population in Virginia with 7.41%.
What is the Percentage of Eastern European Population in the State of Virginia?
Percentage of Eastern European Population in Virginia is 0.29%.
What is the Percentage of Eastern European Population in the United States?
Percentage of Eastern European Population in the United States is 0.30%.