Columbia, CA Map & Demographics
Columbia Map
Columbia Overview
$35,409
PER CAPITA INCOME
$71,563
AVG FAMILY INCOME
$50,491
AVG HOUSEHOLD INCOME
59.3%
WAGE / INCOME GAP [ % ]
40.7¢/ $1
WAGE / INCOME GAP [ $ ]
0.49
INEQUALITY / GINI INDEX
2,439
TOTAL POPULATION
1,132
MALE POPULATION
1,307
FEMALE POPULATION
86.61
MALES / 100 FEMALES
115.46
FEMALES / 100 MALES
45.8
MEDIAN AGE
2.8
AVG FAMILY SIZE
2.2
AVG HOUSEHOLD SIZE
1,094
LABOR FORCE [ PEOPLE ]
54.1%
PERCENT IN LABOR FORCE
8.3%
UNEMPLOYMENT RATE
Columbia Zip Codes
Columbia Area Codes
Income in Columbia
Income Overview in Columbia
Per Capita Income in Columbia is $35,409, while median incomes of families and households are $71,563 and $50,491 respectively.
| Characteristic | Number | Measure |
| Per Capita Income | 2,439 | $35,409 |
| Median Family Income | 664 | $71,563 |
| Mean Family Income | 664 | $97,266 |
| Median Household Income | 1,033 | $50,491 |
| Mean Household Income | 1,033 | $74,489 |
| Income Deficit | 664 | $0 |
| Wage / Income Gap (%) | 2,439 | 59.29% |
| Wage / Income Gap ($) | 2,439 | 40.71¢ per $1 |
| Gini / Inequality Index | 2,439 | 0.49 |
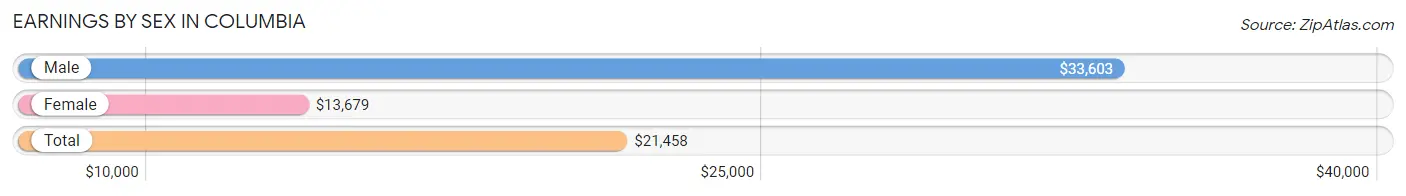
Earnings by Sex in Columbia
Average Earnings in Columbia are $21,458, $33,603 for men and $13,679 for women, a difference of 59.3%.
| Sex | Number | Average Earnings |
| Male | 543 (46.4%) | $33,603 |
| Female | 627 (53.6%) | $13,679 |
| Total | 1,170 (100.0%) | $21,458 |
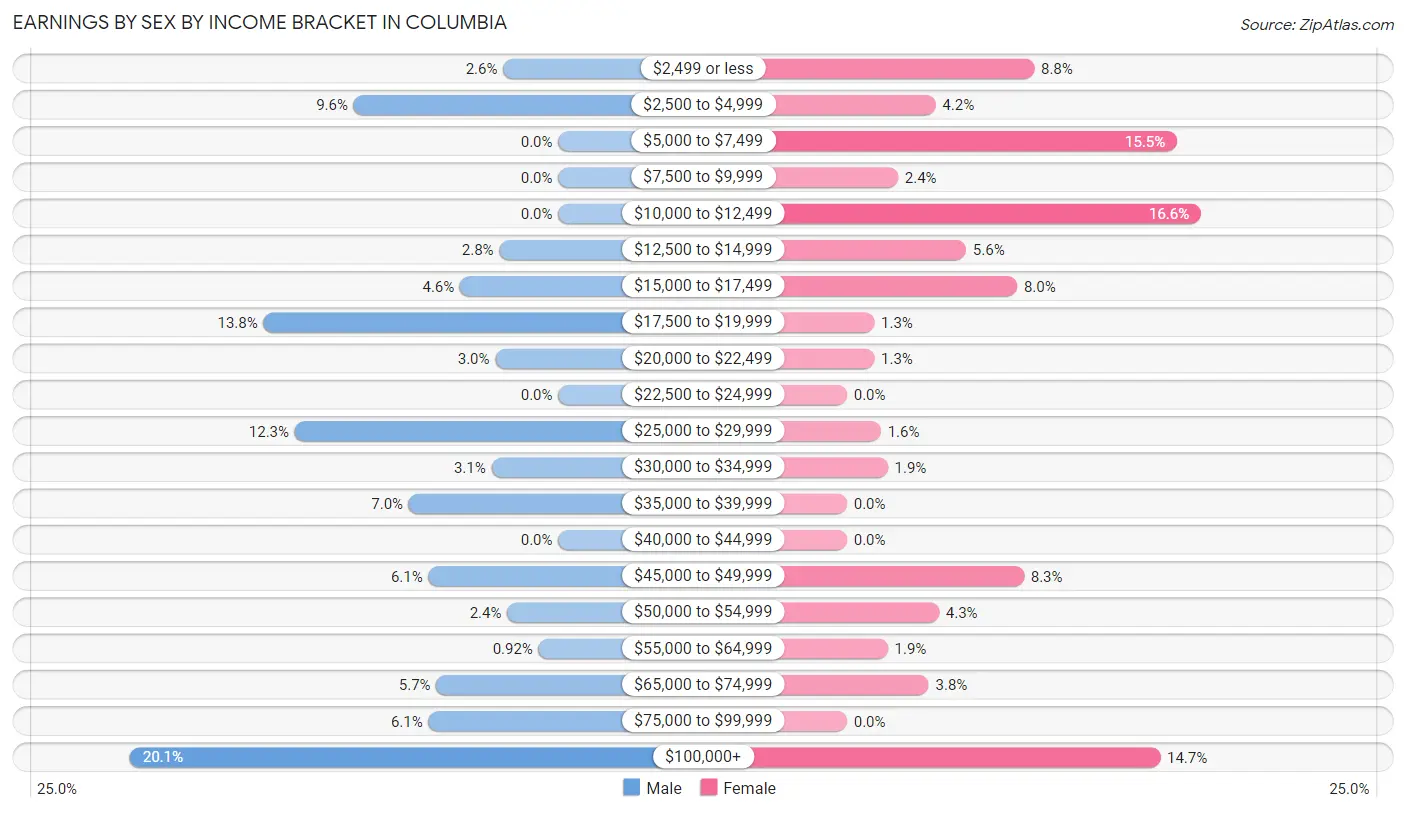
Earnings by Sex by Income Bracket in Columbia
The most common earnings brackets in Columbia are $100,000+ for men (109 | 20.1%) and $10,000 to $12,499 for women (104 | 16.6%).
| Income | Male | Female |
| $2,499 or less | 14 (2.6%) | 55 (8.8%) |
| $2,500 to $4,999 | 52 (9.6%) | 26 (4.2%) |
| $5,000 to $7,499 | 0 (0.0%) | 97 (15.5%) |
| $7,500 to $9,999 | 0 (0.0%) | 15 (2.4%) |
| $10,000 to $12,499 | 0 (0.0%) | 104 (16.6%) |
| $12,500 to $14,999 | 15 (2.8%) | 35 (5.6%) |
| $15,000 to $17,499 | 25 (4.6%) | 50 (8.0%) |
| $17,500 to $19,999 | 75 (13.8%) | 8 (1.3%) |
| $20,000 to $22,499 | 16 (2.9%) | 8 (1.3%) |
| $22,500 to $24,999 | 0 (0.0%) | 0 (0.0%) |
| $25,000 to $29,999 | 67 (12.3%) | 10 (1.6%) |
| $30,000 to $34,999 | 17 (3.1%) | 12 (1.9%) |
| $35,000 to $39,999 | 38 (7.0%) | 0 (0.0%) |
| $40,000 to $44,999 | 0 (0.0%) | 0 (0.0%) |
| $45,000 to $49,999 | 33 (6.1%) | 52 (8.3%) |
| $50,000 to $54,999 | 13 (2.4%) | 27 (4.3%) |
| $55,000 to $64,999 | 5 (0.9%) | 12 (1.9%) |
| $65,000 to $74,999 | 31 (5.7%) | 24 (3.8%) |
| $75,000 to $99,999 | 33 (6.1%) | 0 (0.0%) |
| $100,000+ | 109 (20.1%) | 92 (14.7%) |
| Total | 543 (100.0%) | 627 (100.0%) |
Earnings by Sex by Educational Attainment in Columbia
Average earnings in Columbia are $35,284 for men and $13,821 for women, a difference of 60.8%. Men with an educational attainment of high school diploma enjoy the highest average annual earnings of $17,100, while those with high school diploma education earn the least with $17,100. Women with an educational attainment of bachelor's degree earn the most with the average annual earnings of $51,620, while those with graduate degree education have the smallest earnings of $2,499.

| Educational Attainment | Male Income | Female Income |
| Less than High School | - | - |
| High School Diploma | $17,100 | $0 |
| College or Associate's Degree | - | - |
| Bachelor's Degree | - | - |
| Graduate Degree | - | - |
| Total | $35,284 | $13,821 |
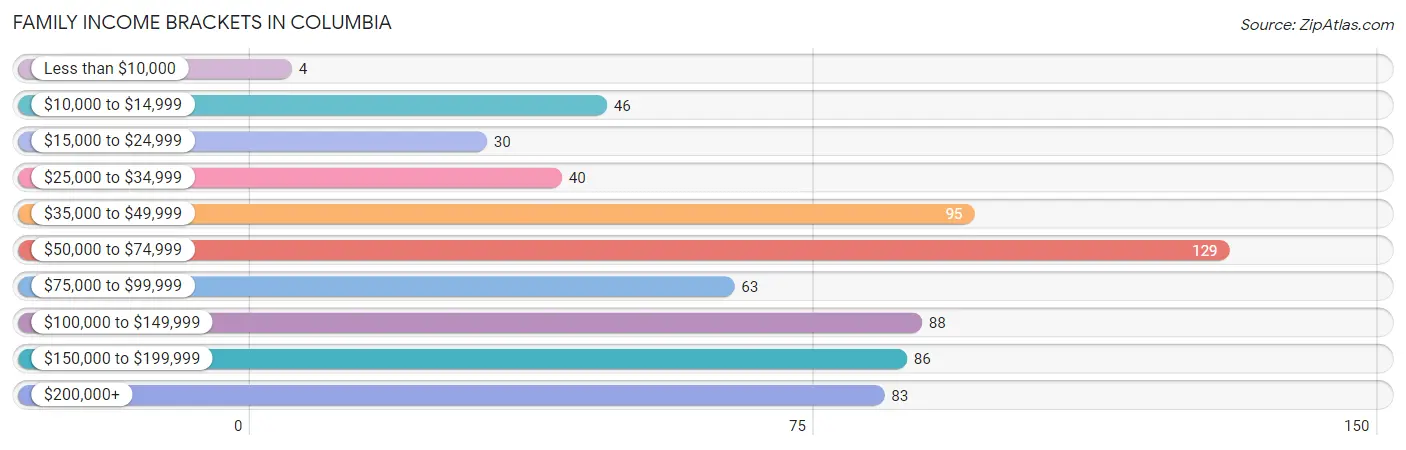
Family Income in Columbia
Family Income Brackets in Columbia
According to the Columbia family income data, there are 129 families falling into the $50,000 to $74,999 income range, which is the most common income bracket and makes up 19.4% of all families. Conversely, the less than $10,000 income bracket is the least frequent group with only 4 families (0.6%) belonging to this category.
| Income Bracket | # Families | % Families |
| Less than $10,000 | 4 | 0.6% |
| $10,000 to $14,999 | 46 | 6.9% |
| $15,000 to $24,999 | 30 | 4.5% |
| $25,000 to $34,999 | 40 | 6.0% |
| $35,000 to $49,999 | 95 | 14.3% |
| $50,000 to $74,999 | 129 | 19.4% |
| $75,000 to $99,999 | 63 | 9.5% |
| $100,000 to $149,999 | 88 | 13.3% |
| $150,000 to $199,999 | 86 | 13.0% |
| $200,000+ | 83 | 12.5% |
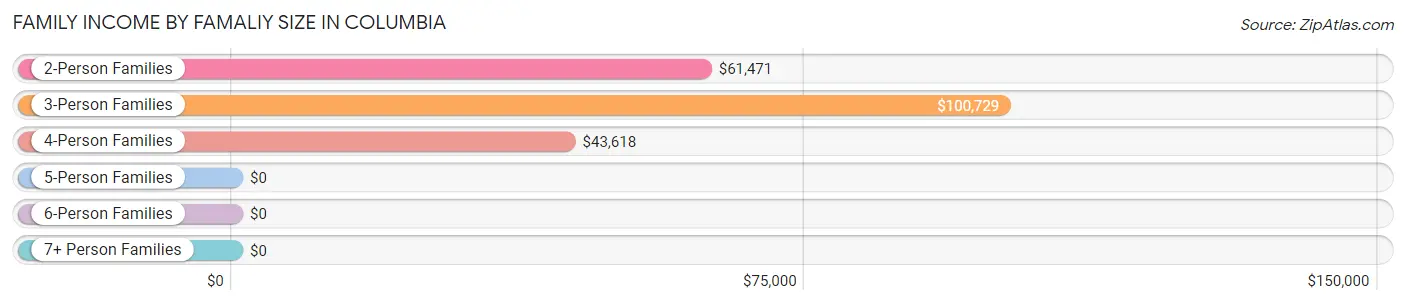
Family Income by Famaliy Size in Columbia
3-person families (146 | 22.0%) account for the highest median family income in Columbia with $100,729 per family, while 3-person families (146 | 22.0%) have the highest median income of $33,576 per family member.
| Income Bracket | # Families | Median Income |
| 2-Person Families | 414 (62.4%) | $61,471 |
| 3-Person Families | 146 (22.0%) | $100,729 |
| 4-Person Families | 59 (8.9%) | $43,618 |
| 5-Person Families | 32 (4.8%) | $0 |
| 6-Person Families | 0 (0.0%) | $0 |
| 7+ Person Families | 13 (2.0%) | $0 |
| Total | 664 (100.0%) | $71,563 |
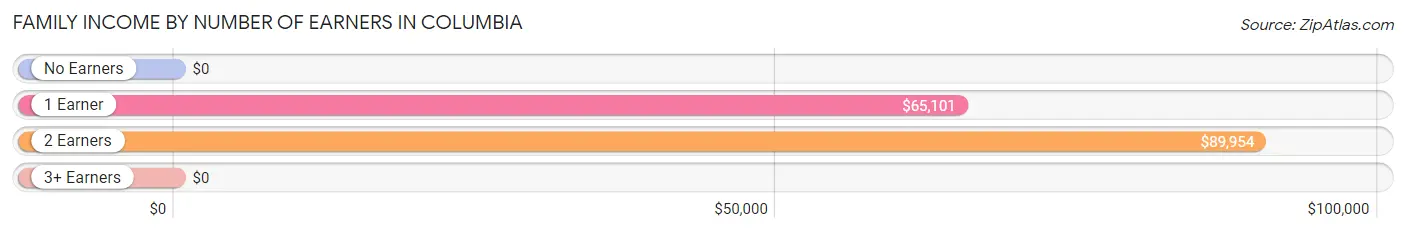
Family Income by Number of Earners in Columbia
| Number of Earners | # Families | Median Income |
| No Earners | 116 (17.5%) | $0 |
| 1 Earner | 317 (47.7%) | $65,101 |
| 2 Earners | 179 (27.0%) | $89,954 |
| 3+ Earners | 52 (7.8%) | $0 |
| Total | 664 (100.0%) | $71,563 |
Household Income in Columbia
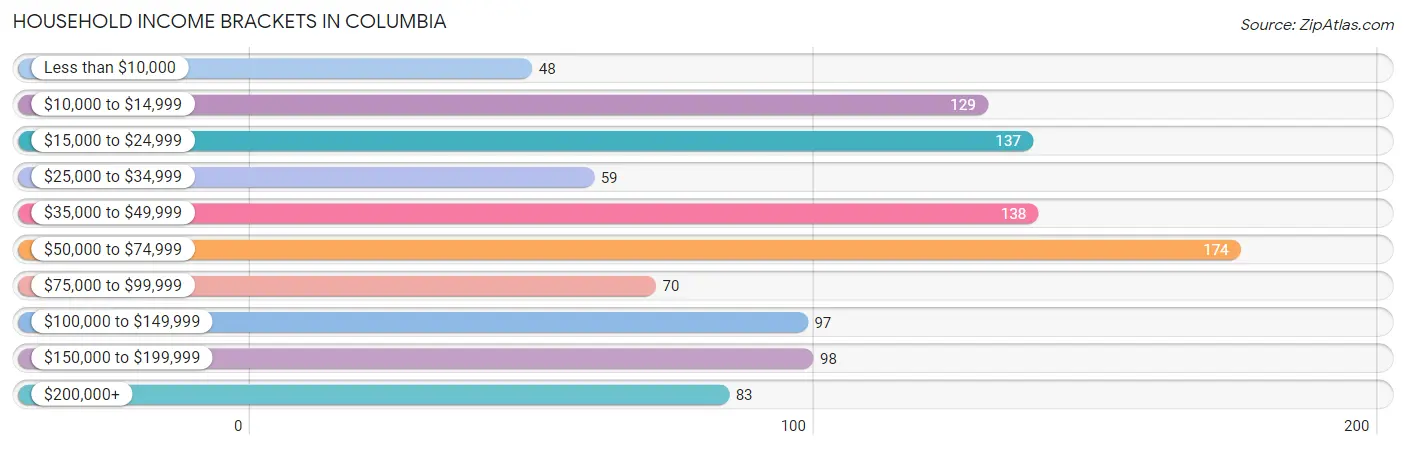
Household Income Brackets in Columbia
With 174 households falling in the category, the $50,000 to $74,999 income range is the most frequent in Columbia, accounting for 16.8% of all households. In contrast, only 48 households (4.6%) fall into the less than $10,000 income bracket, making it the least populous group.
| Income Bracket | # Households | % Households |
| Less than $10,000 | 48 | 4.6% |
| $10,000 to $14,999 | 129 | 12.5% |
| $15,000 to $24,999 | 137 | 13.3% |
| $25,000 to $34,999 | 59 | 5.7% |
| $35,000 to $49,999 | 138 | 13.4% |
| $50,000 to $74,999 | 174 | 16.8% |
| $75,000 to $99,999 | 70 | 6.8% |
| $100,000 to $149,999 | 97 | 9.4% |
| $150,000 to $199,999 | 98 | 9.5% |
| $200,000+ | 83 | 8.0% |
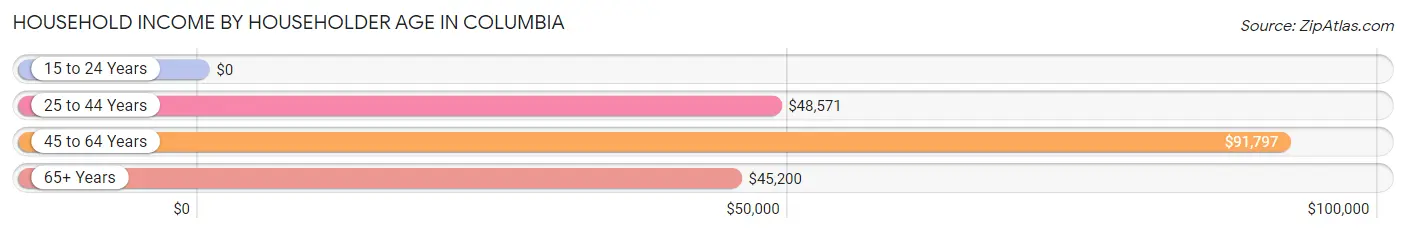
Household Income by Householder Age in Columbia
The median household income in Columbia is $50,491, with the highest median household income of $91,797 found in the 45 to 64 years age bracket for the primary householder. A total of 439 households (42.5%) fall into this category.
| Income Bracket | # Households | Median Income |
| 15 to 24 Years | 0 (0.0%) | $0 |
| 25 to 44 Years | 156 (15.1%) | $48,571 |
| 45 to 64 Years | 439 (42.5%) | $91,797 |
| 65+ Years | 438 (42.4%) | $45,200 |
| Total | 1,033 (100.0%) | $50,491 |
Poverty in Columbia
Income Below Poverty by Sex and Age in Columbia
With 23.0% poverty level for males and 16.2% for females among the residents of Columbia, under 5 year old males and 65 to 74 year old females are the most vulnerable to poverty, with 35 males (72.9%) and 63 females (31.0%) in their respective age groups living below the poverty level.
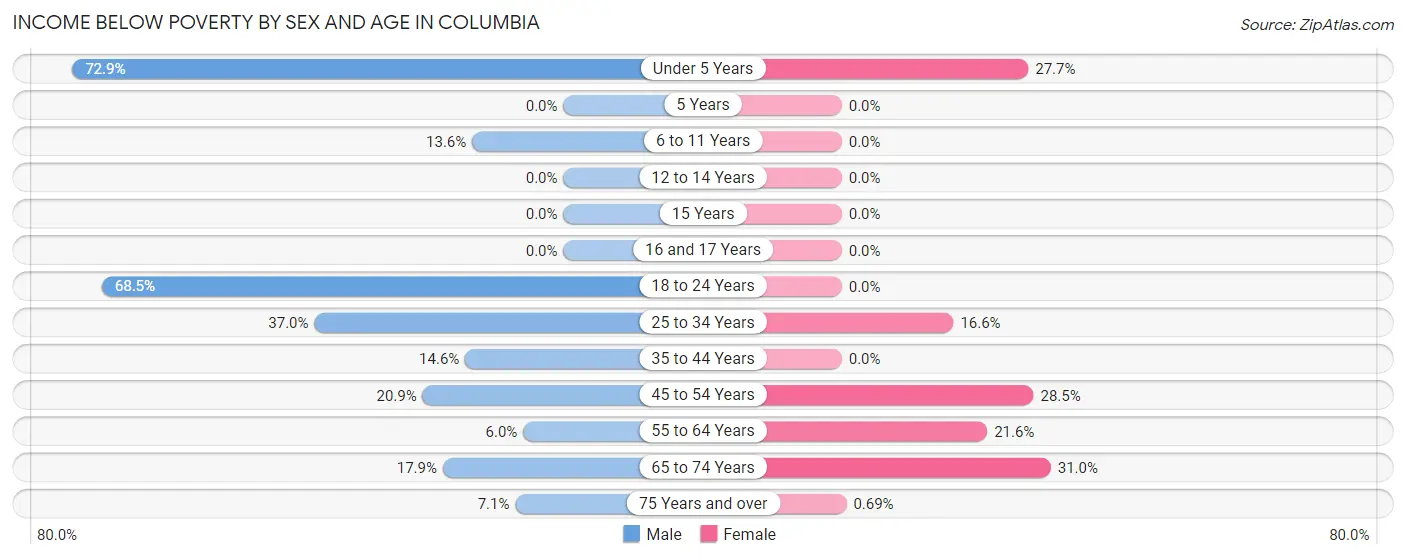
| Age Bracket | Male | Female |
| Under 5 Years | 35 (72.9%) | 18 (27.7%) |
| 5 Years | 0 (0.0%) | 0 (0.0%) |
| 6 to 11 Years | 21 (13.6%) | 0 (0.0%) |
| 12 to 14 Years | 0 (0.0%) | 0 (0.0%) |
| 15 Years | 0 (0.0%) | 0 (0.0%) |
| 16 and 17 Years | 0 (0.0%) | 0 (0.0%) |
| 18 to 24 Years | 74 (68.5%) | 0 (0.0%) |
| 25 to 34 Years | 44 (37.0%) | 31 (16.6%) |
| 35 to 44 Years | 7 (14.6%) | 0 (0.0%) |
| 45 to 54 Years | 23 (20.9%) | 45 (28.5%) |
| 55 to 64 Years | 8 (6.0%) | 38 (21.6%) |
| 65 to 74 Years | 29 (17.9%) | 63 (31.0%) |
| 75 Years and over | 12 (7.1%) | 1 (0.7%) |
| Total | 253 (23.0%) | 196 (16.2%) |
Income Above Poverty by Sex and Age in Columbia
According to the poverty statistics in Columbia, males aged 5 years and females aged 5 years are the age groups that are most secure financially, with 100.0% of males and 100.0% of females in these age groups living above the poverty line.
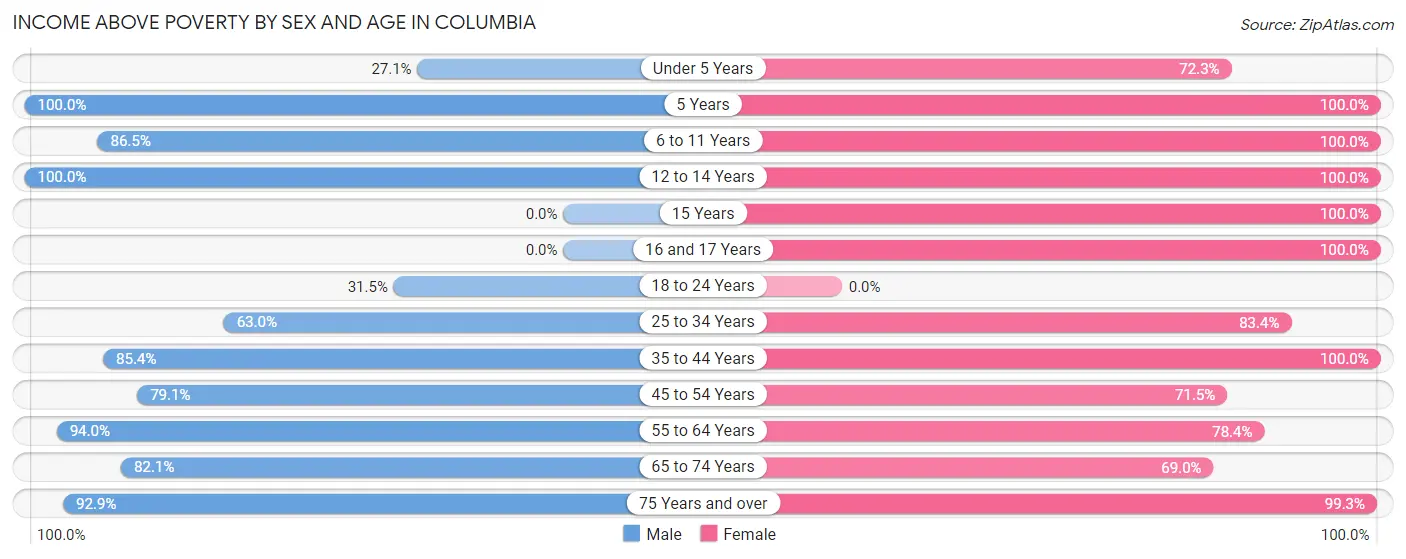
| Age Bracket | Male | Female |
| Under 5 Years | 13 (27.1%) | 47 (72.3%) |
| 5 Years | 25 (100.0%) | 24 (100.0%) |
| 6 to 11 Years | 134 (86.5%) | 32 (100.0%) |
| 12 to 14 Years | 21 (100.0%) | 29 (100.0%) |
| 15 Years | 0 (0.0%) | 18 (100.0%) |
| 16 and 17 Years | 0 (0.0%) | 135 (100.0%) |
| 18 to 24 Years | 34 (31.5%) | 0 (0.0%) |
| 25 to 34 Years | 75 (63.0%) | 156 (83.4%) |
| 35 to 44 Years | 41 (85.4%) | 35 (100.0%) |
| 45 to 54 Years | 87 (79.1%) | 113 (71.5%) |
| 55 to 64 Years | 126 (94.0%) | 138 (78.4%) |
| 65 to 74 Years | 133 (82.1%) | 140 (69.0%) |
| 75 Years and over | 156 (92.9%) | 144 (99.3%) |
| Total | 845 (77.0%) | 1,011 (83.8%) |
Income Below Poverty Among Married-Couple Families in Columbia
The poverty statistics for married-couple families in Columbia show that 7.2% or 26 of the total 360 families live below the poverty line. Families with 1 or 2 children have the highest poverty rate of 32.3%, comprising of 21 families. On the other hand, families with 5 or more children have the lowest poverty rate of 0.0%, which includes 0 families.
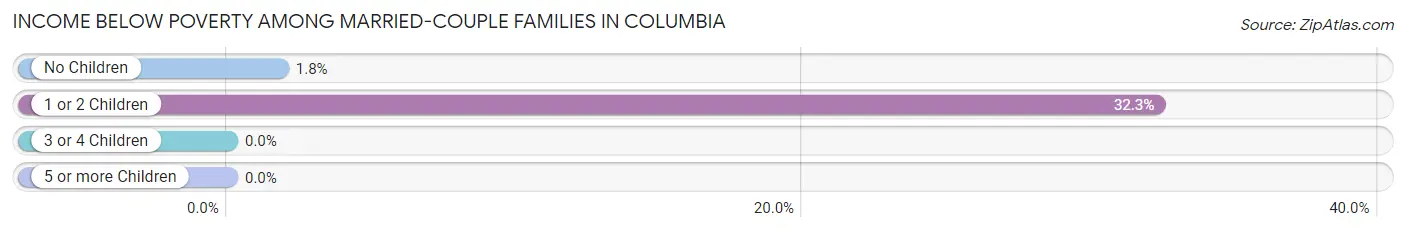
| Children | Above Poverty | Below Poverty |
| No Children | 277 (98.2%) | 5 (1.8%) |
| 1 or 2 Children | 44 (67.7%) | 21 (32.3%) |
| 3 or 4 Children | 0 (0.0%) | 0 (0.0%) |
| 5 or more Children | 13 (100.0%) | 0 (0.0%) |
| Total | 334 (92.8%) | 26 (7.2%) |
Income Below Poverty Among Single-Parent Households in Columbia
According to the poverty data in Columbia, 19.5% or 23 single-father households and 24.2% or 45 single-mother households are living below the poverty line. Among single-father households, those with 1 or 2 children have the highest poverty rate, with 23 households (20.9%) experiencing poverty. Likewise, among single-mother households, those with no children have the highest poverty rate, with 45 households (45.0%) falling below the poverty line.
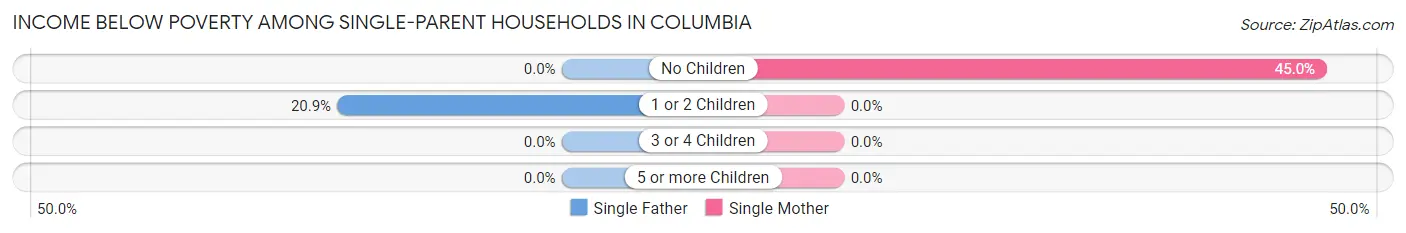
| Children | Single Father | Single Mother |
| No Children | 0 (0.0%) | 45 (45.0%) |
| 1 or 2 Children | 23 (20.9%) | 0 (0.0%) |
| 3 or 4 Children | 0 (0.0%) | 0 (0.0%) |
| 5 or more Children | 0 (0.0%) | 0 (0.0%) |
| Total | 23 (19.5%) | 45 (24.2%) |
Income Below Poverty Among Married-Couple vs Single-Parent Households in Columbia
The poverty data for Columbia shows that 26 of the married-couple family households (7.2%) and 68 of the single-parent households (22.4%) are living below the poverty level. Within the married-couple family households, those with 1 or 2 children have the highest poverty rate, with 21 households (32.3%) falling below the poverty line. Among the single-parent households, those with no children have the highest poverty rate, with 45 household (41.7%) living below poverty.
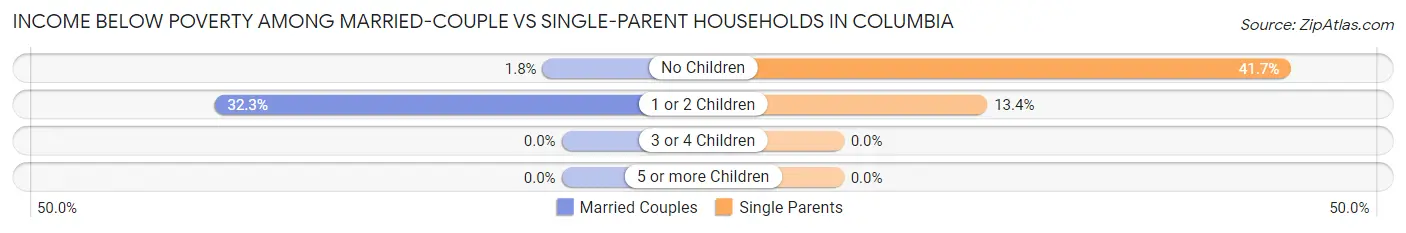
| Children | Married-Couple Families | Single-Parent Households |
| No Children | 5 (1.8%) | 45 (41.7%) |
| 1 or 2 Children | 21 (32.3%) | 23 (13.4%) |
| 3 or 4 Children | 0 (0.0%) | 0 (0.0%) |
| 5 or more Children | 0 (0.0%) | 0 (0.0%) |
| Total | 26 (7.2%) | 68 (22.4%) |
Race in Columbia
The most populous races in Columbia are White / Caucasian (2,091 | 85.7%), Hispanic or Latino (186 | 7.6%), and Two or more Races (180 | 7.4%).
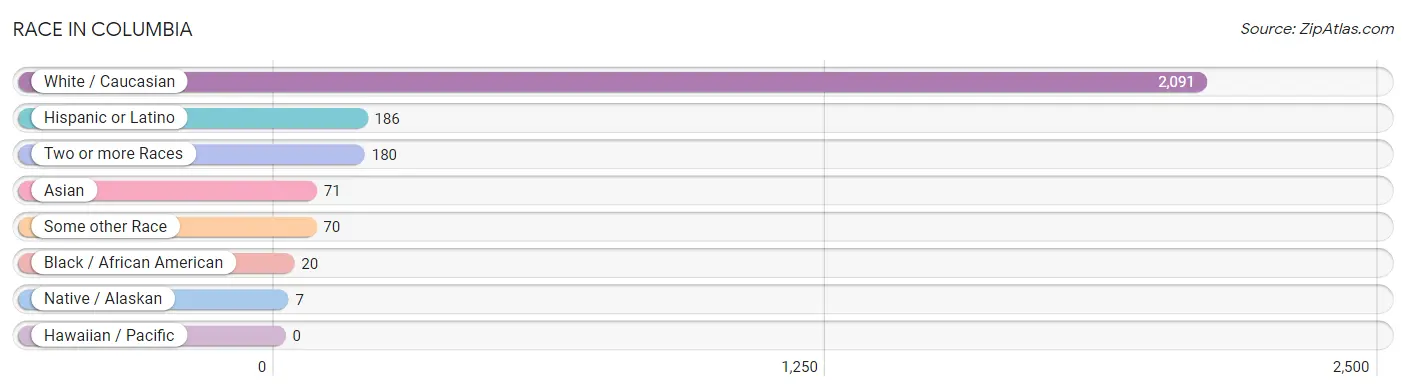
| Race | # Population | % Population |
| Asian | 71 | 2.9% |
| Black / African American | 20 | 0.8% |
| Hawaiian / Pacific | 0 | 0.0% |
| Hispanic or Latino | 186 | 7.6% |
| Native / Alaskan | 7 | 0.3% |
| White / Caucasian | 2,091 | 85.7% |
| Two or more Races | 180 | 7.4% |
| Some other Race | 70 | 2.9% |
| Total | 2,439 | 100.0% |
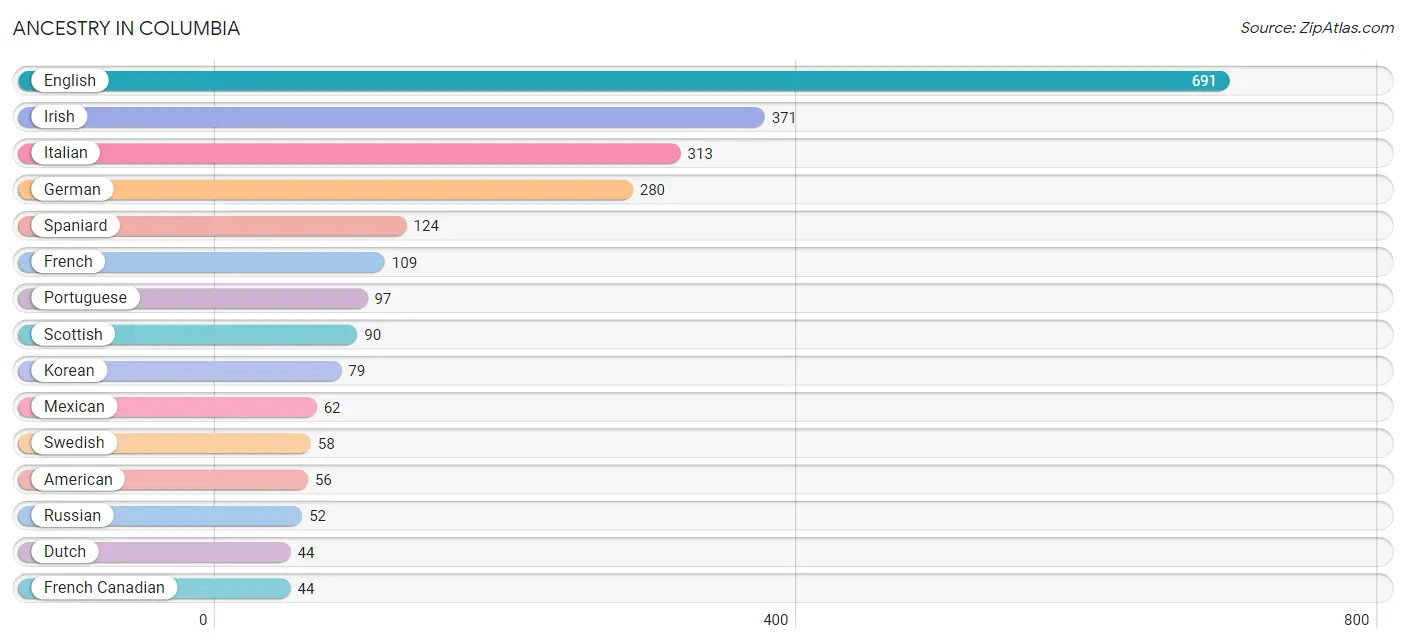
Ancestry in Columbia
The most populous ancestries reported in Columbia are English (691 | 28.3%), Irish (371 | 15.2%), Italian (313 | 12.8%), German (280 | 11.5%), and Spaniard (124 | 5.1%), together accounting for 72.9% of all Columbia residents.
| Ancestry | # Population | % Population |
| Afghan | 7 | 0.3% |
| American | 56 | 2.3% |
| Belgian | 22 | 0.9% |
| Bhutanese | 13 | 0.5% |
| British | 8 | 0.3% |
| Burmese | 17 | 0.7% |
| Cherokee | 11 | 0.4% |
| Czech | 9 | 0.4% |
| Dutch | 44 | 1.8% |
| Eastern European | 37 | 1.5% |
| English | 691 | 28.3% |
| European | 34 | 1.4% |
| French | 109 | 4.5% |
| French Canadian | 44 | 1.8% |
| German | 280 | 11.5% |
| Icelander | 6 | 0.3% |
| Indian (Asian) | 6 | 0.3% |
| Irish | 371 | 15.2% |
| Italian | 313 | 12.8% |
| Korean | 79 | 3.2% |
| Latvian | 35 | 1.4% |
| Mexican | 62 | 2.5% |
| Mexican American Indian | 19 | 0.8% |
| Norwegian | 29 | 1.2% |
| Polish | 35 | 1.4% |
| Portuguese | 97 | 4.0% |
| Russian | 52 | 2.1% |
| Scandinavian | 19 | 0.8% |
| Scotch-Irish | 41 | 1.7% |
| Scottish | 90 | 3.7% |
| Serbian | 4 | 0.2% |
| Slavic | 17 | 0.7% |
| Spaniard | 124 | 5.1% |
| Swedish | 58 | 2.4% |
| Swiss | 6 | 0.3% |
| Thai | 10 | 0.4% | View All 36 Rows |
Immigrants in Columbia
The most numerous immigrant groups reported in Columbia came from Asia (49 | 2.0%), Latin America (48 | 2.0%), South America (48 | 2.0%), Uruguay (48 | 2.0%), and Europe (45 | 1.8%), together accounting for 9.8% of all Columbia residents.
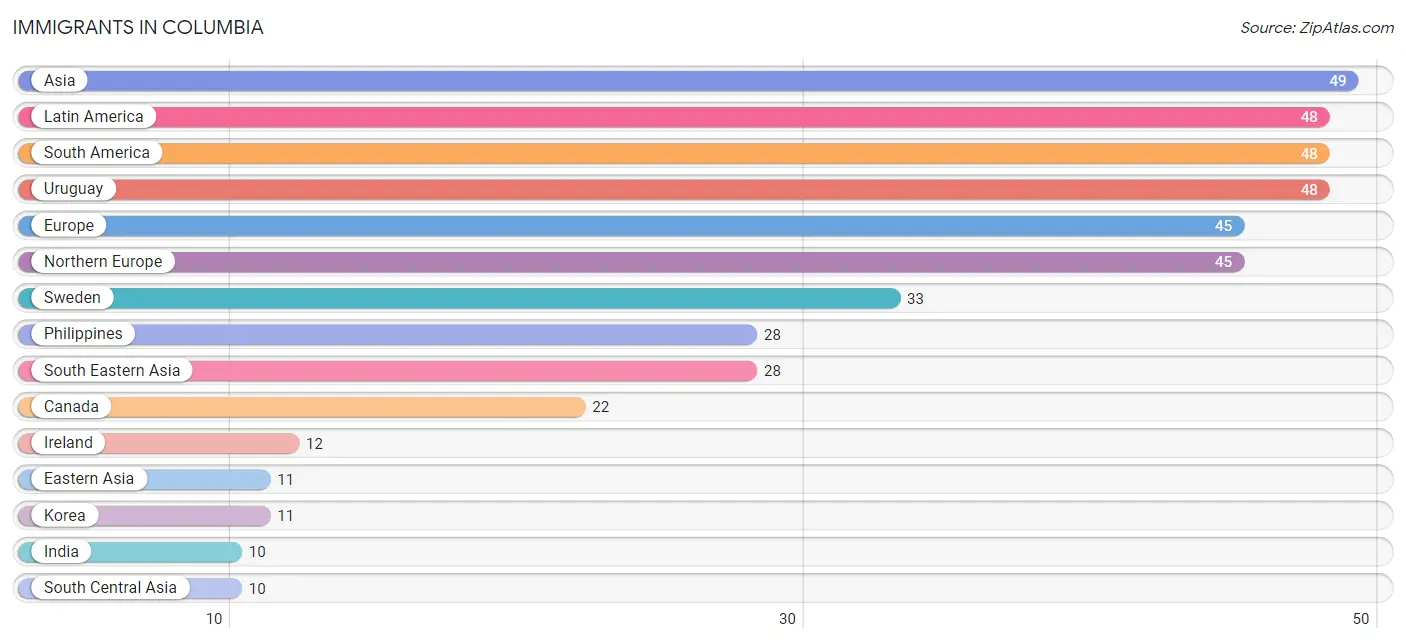
| Immigration Origin | # Population | % Population |
| Asia | 49 | 2.0% |
| Canada | 22 | 0.9% |
| Eastern Asia | 11 | 0.4% |
| Europe | 45 | 1.8% |
| India | 10 | 0.4% |
| Ireland | 12 | 0.5% |
| Korea | 11 | 0.4% |
| Latin America | 48 | 2.0% |
| Northern Europe | 45 | 1.8% |
| Philippines | 28 | 1.1% |
| South America | 48 | 2.0% |
| South Central Asia | 10 | 0.4% |
| South Eastern Asia | 28 | 1.1% |
| Sweden | 33 | 1.3% |
| Uruguay | 48 | 2.0% | View All 15 Rows |
Sex and Age in Columbia
Sex and Age in Columbia
The most populous age groups in Columbia are 5 to 9 Years (160 | 14.1%) for men and 15 to 19 Years (211 | 16.1%) for women.
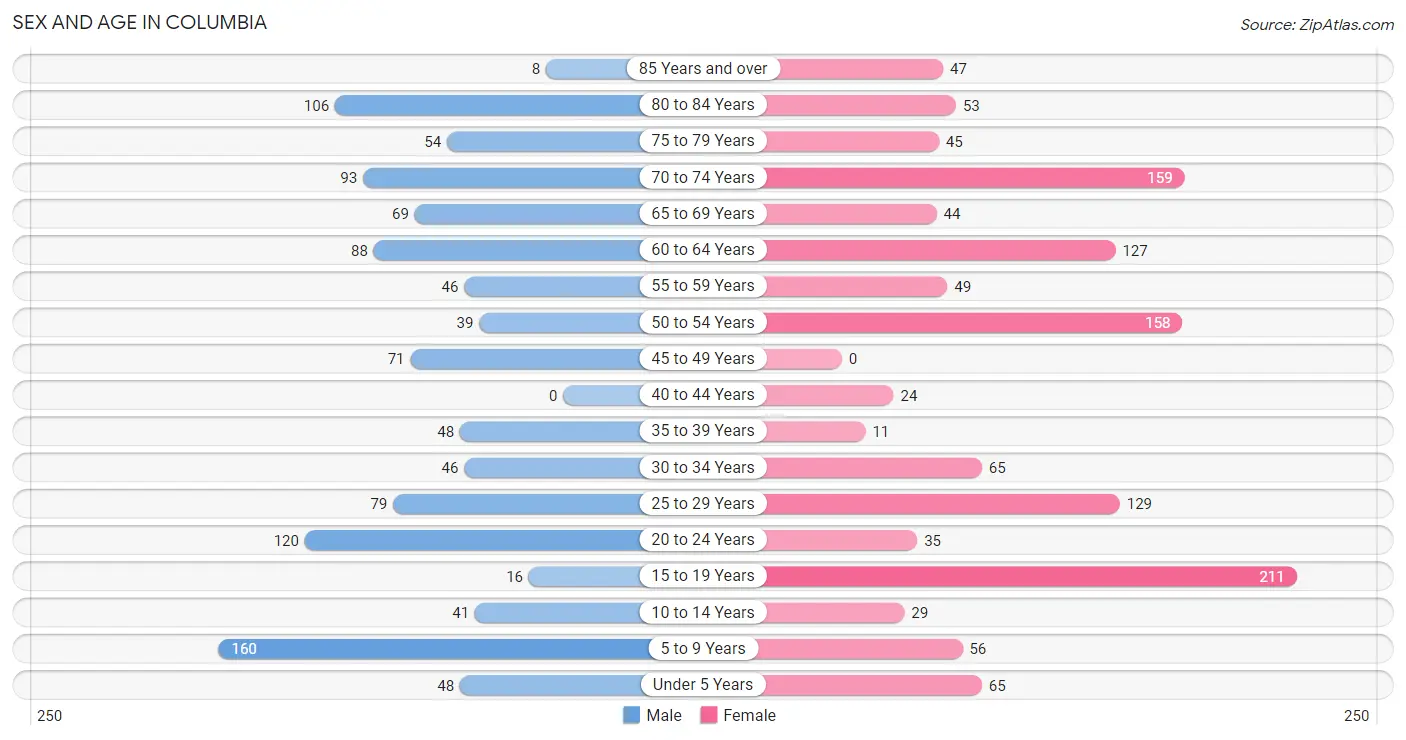
| Age Bracket | Male | Female |
| Under 5 Years | 48 (4.2%) | 65 (5.0%) |
| 5 to 9 Years | 160 (14.1%) | 56 (4.3%) |
| 10 to 14 Years | 41 (3.6%) | 29 (2.2%) |
| 15 to 19 Years | 16 (1.4%) | 211 (16.1%) |
| 20 to 24 Years | 120 (10.6%) | 35 (2.7%) |
| 25 to 29 Years | 79 (7.0%) | 129 (9.9%) |
| 30 to 34 Years | 46 (4.1%) | 65 (5.0%) |
| 35 to 39 Years | 48 (4.2%) | 11 (0.8%) |
| 40 to 44 Years | 0 (0.0%) | 24 (1.8%) |
| 45 to 49 Years | 71 (6.3%) | 0 (0.0%) |
| 50 to 54 Years | 39 (3.5%) | 158 (12.1%) |
| 55 to 59 Years | 46 (4.1%) | 49 (3.7%) |
| 60 to 64 Years | 88 (7.8%) | 127 (9.7%) |
| 65 to 69 Years | 69 (6.1%) | 44 (3.4%) |
| 70 to 74 Years | 93 (8.2%) | 159 (12.2%) |
| 75 to 79 Years | 54 (4.8%) | 45 (3.4%) |
| 80 to 84 Years | 106 (9.4%) | 53 (4.1%) |
| 85 Years and over | 8 (0.7%) | 47 (3.6%) |
| Total | 1,132 (100.0%) | 1,307 (100.0%) |
Families and Households in Columbia
Median Family Size in Columbia
The median family size in Columbia is 2.84 persons per family, with single male/father families (118 | 17.8%) accounting for the largest median family size of 2.91 persons per family. On the other hand, single female/mother families (186 | 28.0%) represent the smallest median family size with 2.74 persons per family.
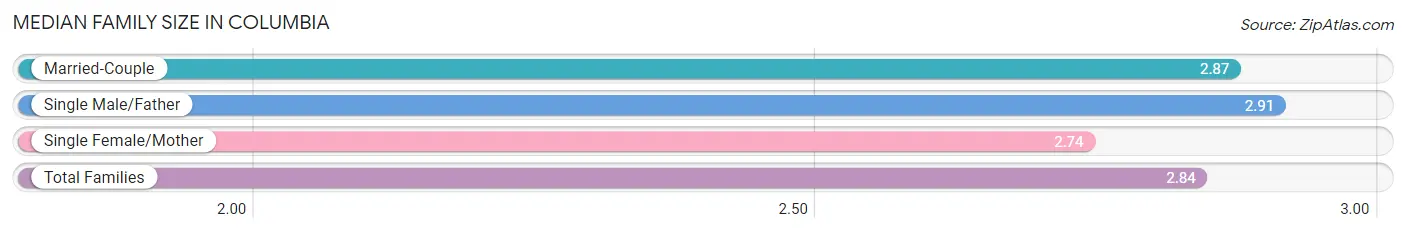
| Family Type | # Families | Family Size |
| Married-Couple | 360 (54.2%) | 2.87 |
| Single Male/Father | 118 (17.8%) | 2.91 |
| Single Female/Mother | 186 (28.0%) | 2.74 |
| Total Families | 664 (100.0%) | 2.84 |
Median Household Size in Columbia
The median household size in Columbia is 2.23 persons per household, with single male/father households (118 | 11.4%) accounting for the largest median household size of 2.91 persons per household. non-family households (369 | 35.7%) represent the smallest median household size with 1.08 persons per household.
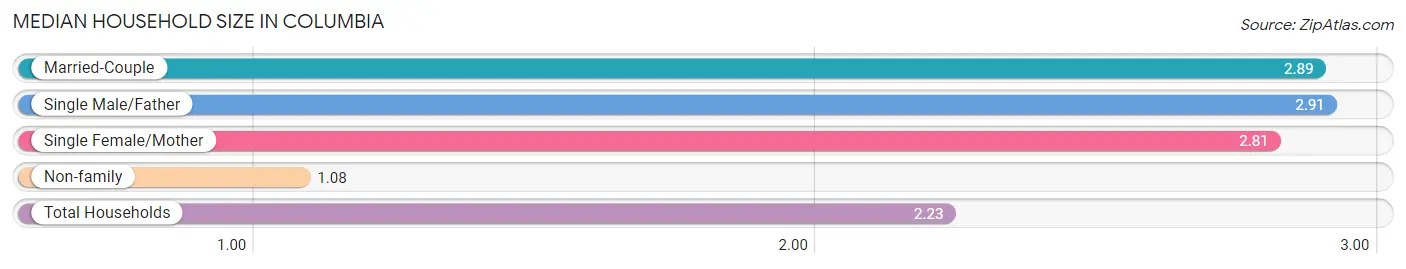
| Household Type | # Households | Household Size |
| Married-Couple | 360 (34.8%) | 2.89 |
| Single Male/Father | 118 (11.4%) | 2.91 |
| Single Female/Mother | 186 (18.0%) | 2.81 |
| Non-family | 369 (35.7%) | 1.08 |
| Total Households | 1,033 (100.0%) | 2.23 |
Household Size by Marriage Status in Columbia
Out of a total of 1,033 households in Columbia, 664 (64.3%) are family households, while 369 (35.7%) are nonfamily households. The most numerous type of family households are 2-person households, comprising 397, and the most common type of nonfamily households are 1-person households, comprising 350.
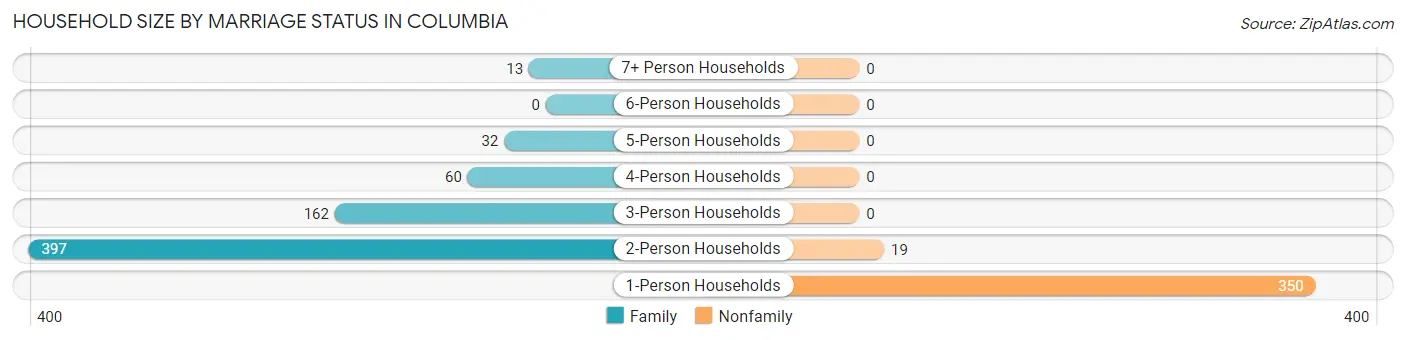
| Household Size | Family Households | Nonfamily Households |
| 1-Person Households | - | 350 (33.9%) |
| 2-Person Households | 397 (38.4%) | 19 (1.8%) |
| 3-Person Households | 162 (15.7%) | 0 (0.0%) |
| 4-Person Households | 60 (5.8%) | 0 (0.0%) |
| 5-Person Households | 32 (3.1%) | 0 (0.0%) |
| 6-Person Households | 0 (0.0%) | 0 (0.0%) |
| 7+ Person Households | 13 (1.3%) | 0 (0.0%) |
| Total | 664 (64.3%) | 369 (35.7%) |
Female Fertility in Columbia
Fertility by Age in Columbia
Average fertility rate in Columbia is 43.0 births per 1,000 women. Women in the age bracket of 20 to 34 years have the highest fertility rate with 96.0 births per 1,000 women. Women in the age bracket of 20 to 34 years acount for 100.0% of all women with births.
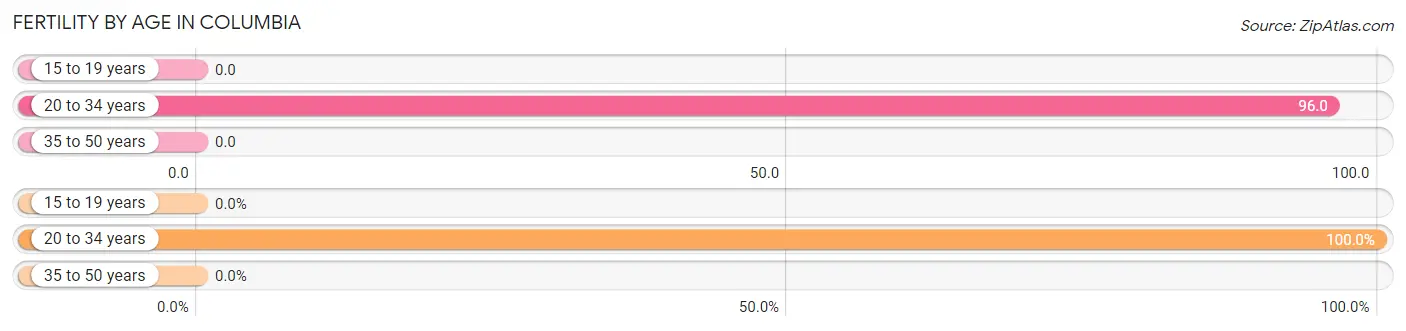
| Age Bracket | Women with Births | Births / 1,000 Women |
| 15 to 19 years | 0 (0.0%) | 0.0 |
| 20 to 34 years | 22 (100.0%) | 96.0 |
| 35 to 50 years | 0 (0.0%) | 0.0 |
| Total | 22 (100.0%) | 43.0 |
Fertility by Age by Marriage Status in Columbia
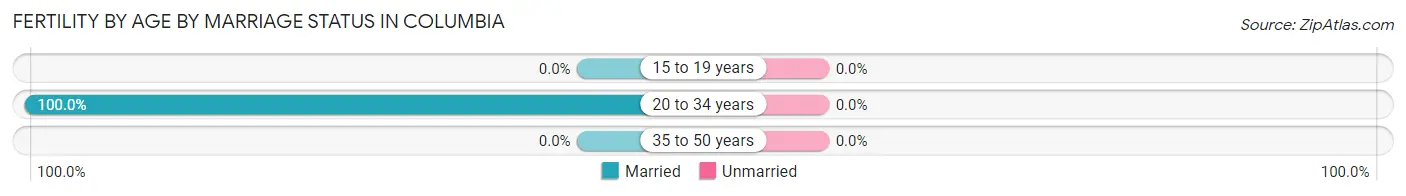
| Age Bracket | Married | Unmarried |
| 15 to 19 years | 0 (0.0%) | 0 (0.0%) |
| 20 to 34 years | 22 (100.0%) | 0 (0.0%) |
| 35 to 50 years | 0 (0.0%) | 0 (0.0%) |
| Total | 22 (100.0%) | 0 (0.0%) |
Fertility by Education in Columbia
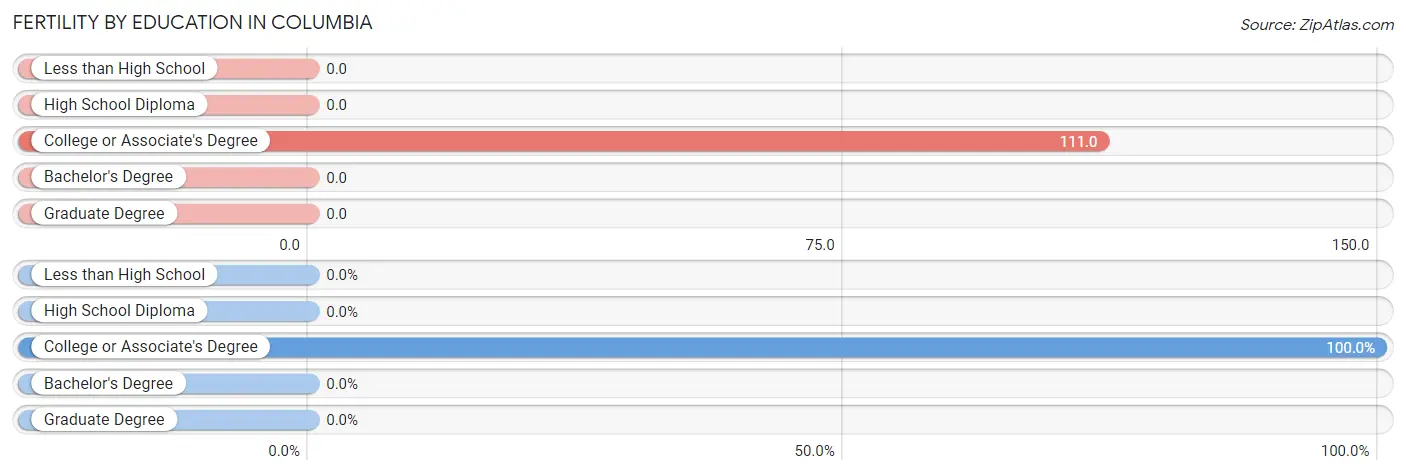
| Educational Attainment | Women with Births | Births / 1,000 Women |
| Less than High School | 0 (0.0%) | 0.0 |
| High School Diploma | 0 (0.0%) | 0.0 |
| College or Associate's Degree | 22 (100.0%) | 111.0 |
| Bachelor's Degree | 0 (0.0%) | 0.0 |
| Graduate Degree | 0 (0.0%) | 0.0 |
| Total | 22 (100.0%) | 43.0 |
Fertility by Education by Marriage Status in Columbia
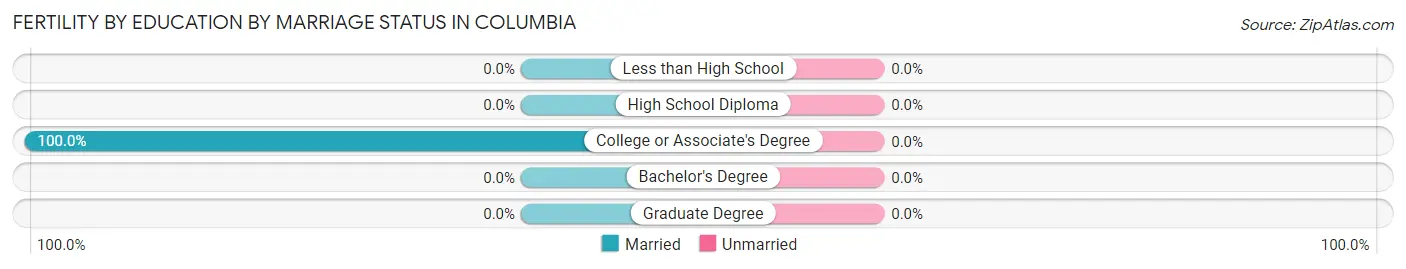
| Educational Attainment | Married | Unmarried |
| Less than High School | 0 (0.0%) | 0 (0.0%) |
| High School Diploma | 0 (0.0%) | 0 (0.0%) |
| College or Associate's Degree | 22 (100.0%) | 0 (0.0%) |
| Bachelor's Degree | 0 (0.0%) | 0 (0.0%) |
| Graduate Degree | 0 (0.0%) | 0 (0.0%) |
| Total | 22 (100.0%) | 0 (0.0%) |
Employment Characteristics in Columbia
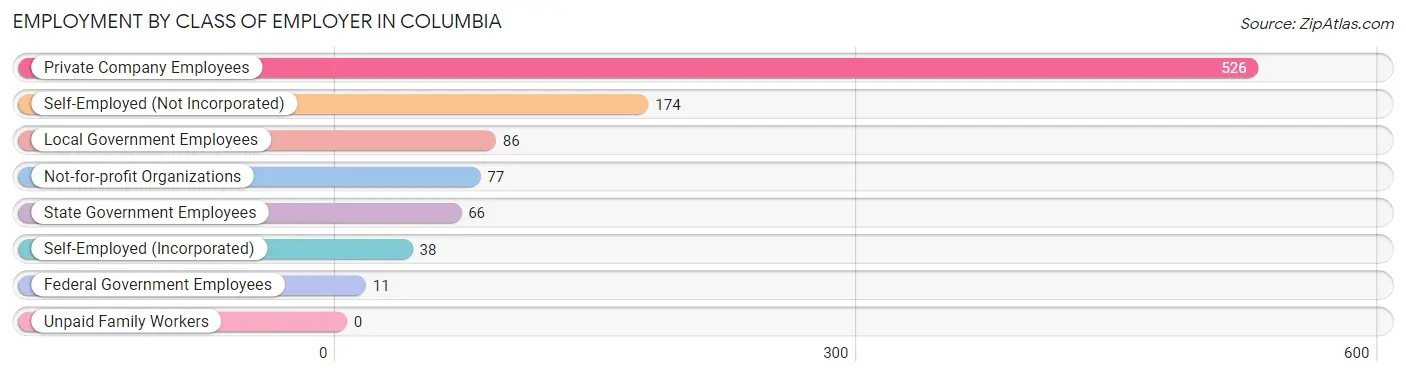
Employment by Class of Employer in Columbia
Among the 978 employed individuals in Columbia, private company employees (526 | 53.8%), self-employed (not incorporated) (174 | 17.8%), and local government employees (86 | 8.8%) make up the most common classes of employment.
| Employer Class | # Employees | % Employees |
| Private Company Employees | 526 | 53.8% |
| Self-Employed (Incorporated) | 38 | 3.9% |
| Self-Employed (Not Incorporated) | 174 | 17.8% |
| Not-for-profit Organizations | 77 | 7.9% |
| Local Government Employees | 86 | 8.8% |
| State Government Employees | 66 | 6.8% |
| Federal Government Employees | 11 | 1.1% |
| Unpaid Family Workers | 0 | 0.0% |
| Total | 978 | 100.0% |
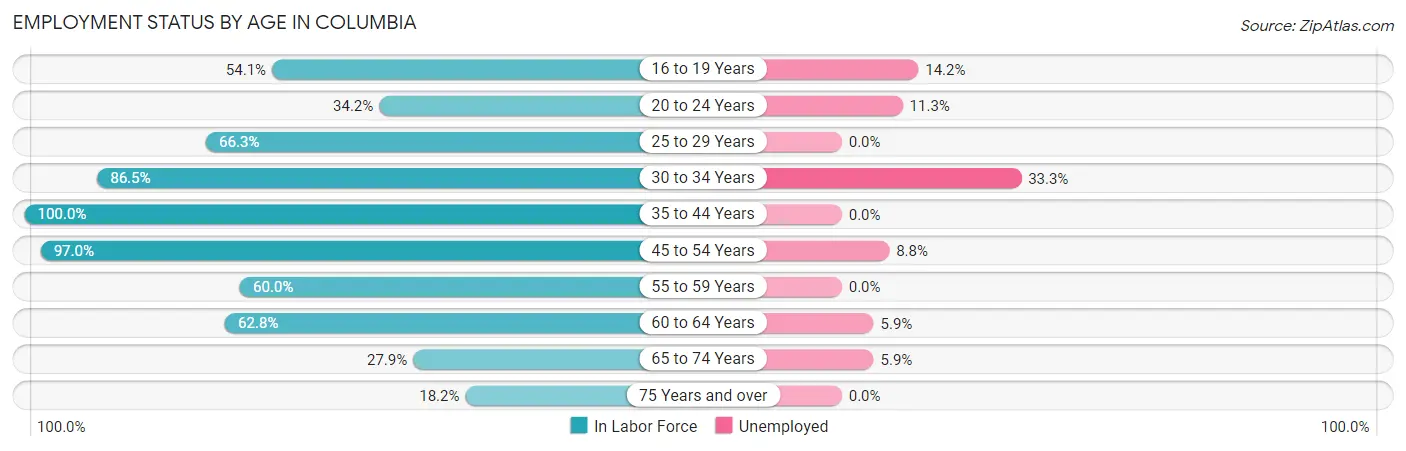
Employment Status by Age in Columbia
According to the labor force statistics for Columbia, out of the total population over 16 years of age (2,022), 54.1% or 1,094 individuals are in the labor force, with 8.3% or 91 of them unemployed. The age group with the highest labor force participation rate is 35 to 44 years, with 100.0% or 83 individuals in the labor force. Within the labor force, the 30 to 34 years age range has the highest percentage of unemployed individuals, with 33.3% or 32 of them being unemployed.
| Age Bracket | In Labor Force | Unemployed |
| 16 to 19 Years | 113 (54.1%) | 16 (14.2%) |
| 20 to 24 Years | 53 (34.2%) | 6 (11.3%) |
| 25 to 29 Years | 138 (66.3%) | 0 (0.0%) |
| 30 to 34 Years | 96 (86.5%) | 32 (33.3%) |
| 35 to 44 Years | 83 (100.0%) | 0 (0.0%) |
| 45 to 54 Years | 260 (97.0%) | 23 (8.8%) |
| 55 to 59 Years | 57 (60.0%) | 0 (0.0%) |
| 60 to 64 Years | 135 (62.8%) | 8 (5.9%) |
| 65 to 74 Years | 102 (27.9%) | 6 (5.9%) |
| 75 Years and over | 57 (18.2%) | 0 (0.0%) |
| Total | 1,094 (54.1%) | 91 (8.3%) |
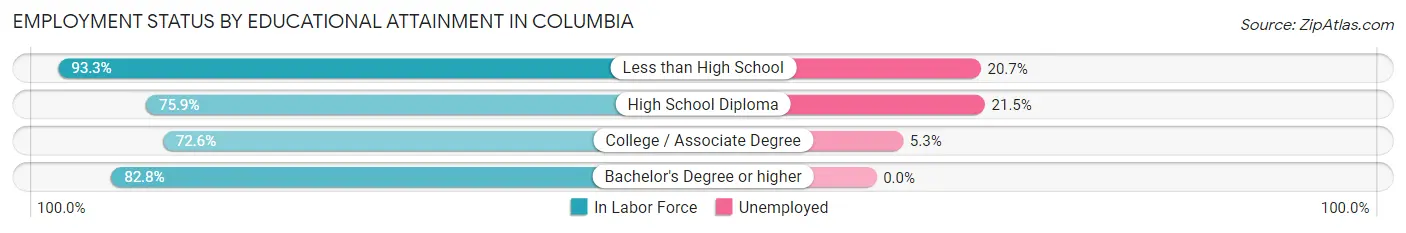
Employment Status by Educational Attainment in Columbia
According to labor force statistics for Columbia, 78.5% of individuals (769) out of the total population between 25 and 64 years of age (980) are in the labor force, with 8.2% or 63 of them being unemployed. The group with the highest labor force participation rate are those with the educational attainment of less than high school, with 93.3% or 111 individuals in the labor force. Within the labor force, individuals with high school diploma education have the highest percentage of unemployment, with 21.5% or 23 of them being unemployed.
| Educational Attainment | In Labor Force | Unemployed |
| Less than High School | 111 (93.3%) | 25 (20.7%) |
| High School Diploma | 107 (75.9%) | 30 (21.5%) |
| College / Associate Degree | 320 (72.6%) | 23 (5.3%) |
| Bachelor's Degree or higher | 231 (82.8%) | 0 (0.0%) |
| Total | 769 (78.5%) | 80 (8.2%) |
Employment Occupations by Sex in Columbia
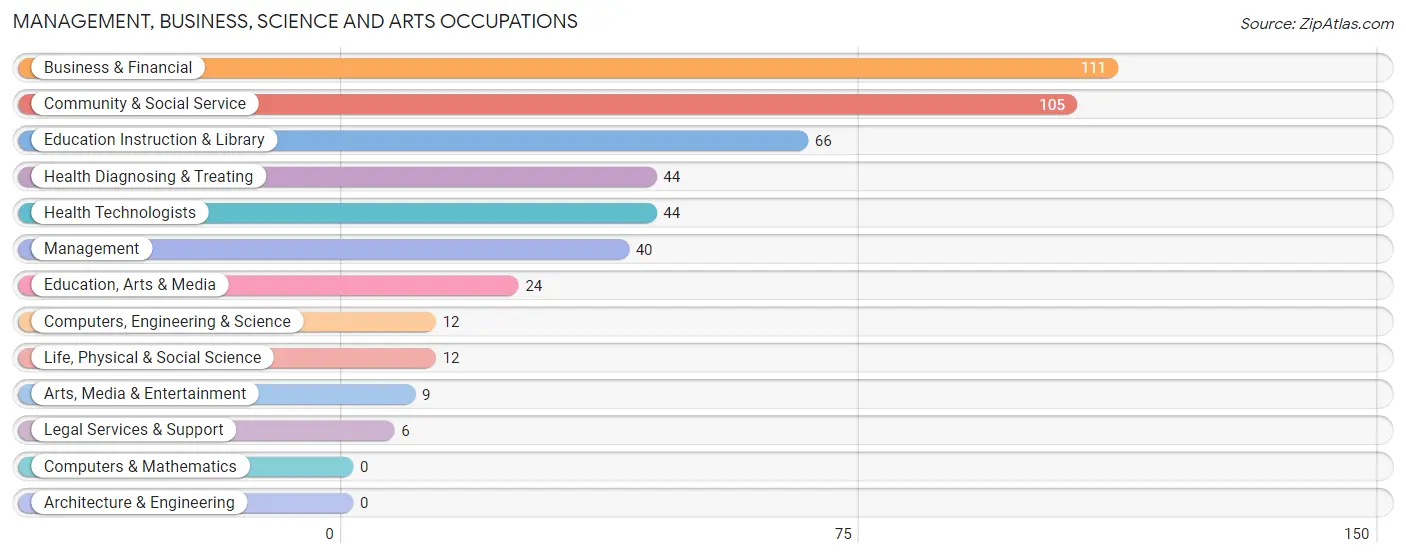
Management, Business, Science and Arts Occupations
The most common Management, Business, Science and Arts occupations in Columbia are Business & Financial (111 | 11.1%), Community & Social Service (105 | 10.5%), Education Instruction & Library (66 | 6.6%), Health Diagnosing & Treating (44 | 4.4%), and Health Technologists (44 | 4.4%).
Management, Business, Science and Arts Occupations by Sex
Within the Management, Business, Science and Arts occupations in Columbia, the most male-oriented occupations are Legal Services & Support (100.0%), Arts, Media & Entertainment (100.0%), and Health Diagnosing & Treating (86.4%), while the most female-oriented occupations are Management (100.0%), Computers, Engineering & Science (100.0%), and Life, Physical & Social Science (100.0%).
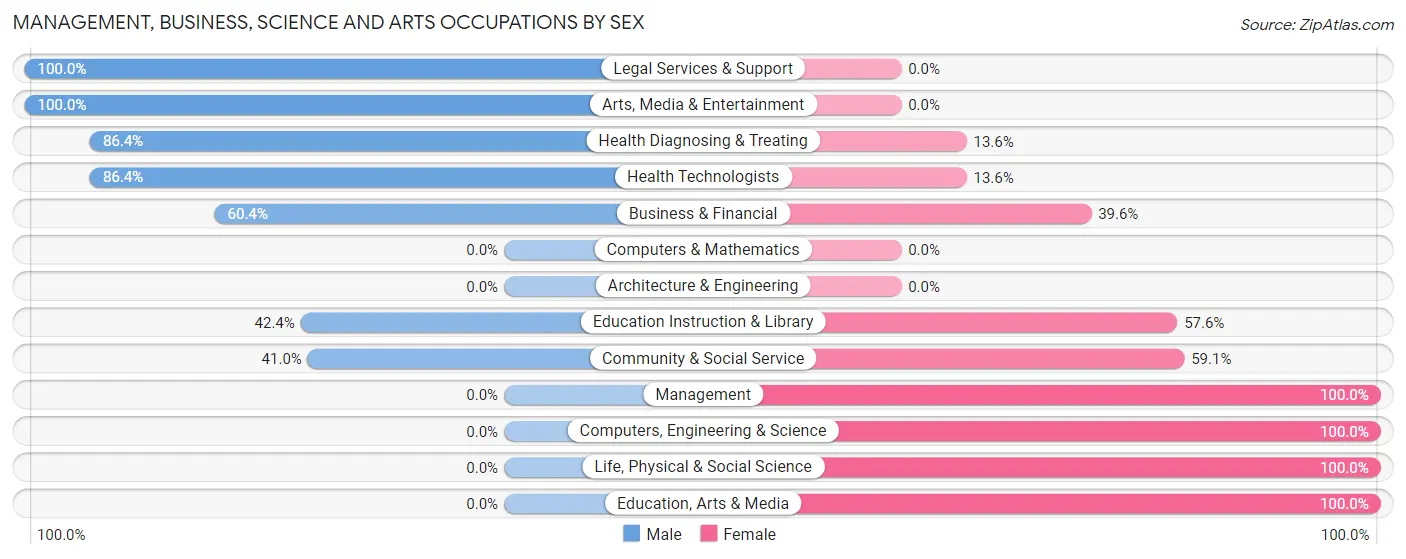
| Occupation | Male | Female |
| Management | 0 (0.0%) | 40 (100.0%) |
| Business & Financial | 67 (60.4%) | 44 (39.6%) |
| Computers, Engineering & Science | 0 (0.0%) | 12 (100.0%) |
| Computers & Mathematics | 0 (0.0%) | 0 (0.0%) |
| Architecture & Engineering | 0 (0.0%) | 0 (0.0%) |
| Life, Physical & Social Science | 0 (0.0%) | 12 (100.0%) |
| Community & Social Service | 43 (40.9%) | 62 (59.1%) |
| Education, Arts & Media | 0 (0.0%) | 24 (100.0%) |
| Legal Services & Support | 6 (100.0%) | 0 (0.0%) |
| Education Instruction & Library | 28 (42.4%) | 38 (57.6%) |
| Arts, Media & Entertainment | 9 (100.0%) | 0 (0.0%) |
| Health Diagnosing & Treating | 38 (86.4%) | 6 (13.6%) |
| Health Technologists | 38 (86.4%) | 6 (13.6%) |
| Total (Category) | 148 (47.4%) | 164 (52.6%) |
| Total (Overall) | 472 (47.1%) | 531 (52.9%) |
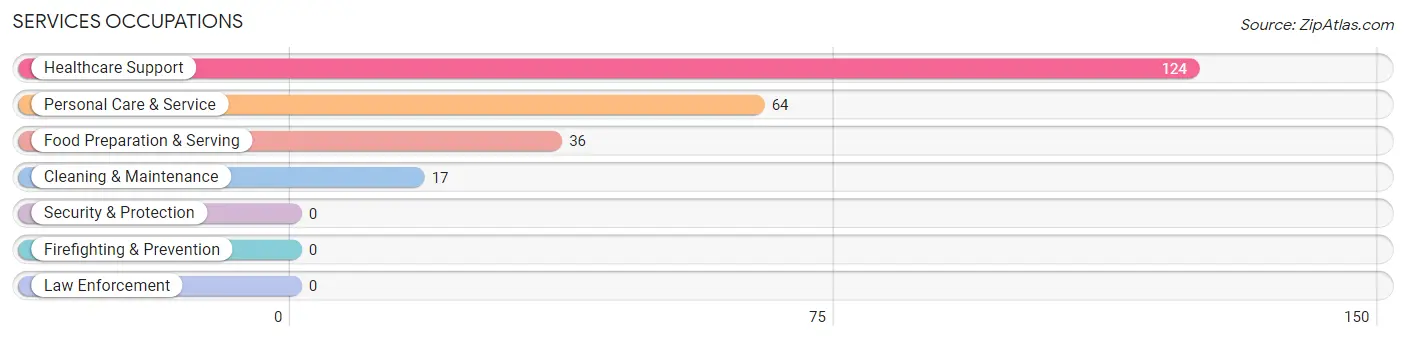
Services Occupations
The most common Services occupations in Columbia are Healthcare Support (124 | 12.4%), Personal Care & Service (64 | 6.4%), Food Preparation & Serving (36 | 3.6%), and Cleaning & Maintenance (17 | 1.7%).
Services Occupations by Sex
Within the Services occupations in Columbia, the most male-oriented occupations are Cleaning & Maintenance (100.0%), Food Preparation & Serving (77.8%), and Healthcare Support (36.3%), while the most female-oriented occupations are Personal Care & Service (92.2%), Healthcare Support (63.7%), and Food Preparation & Serving (22.2%).
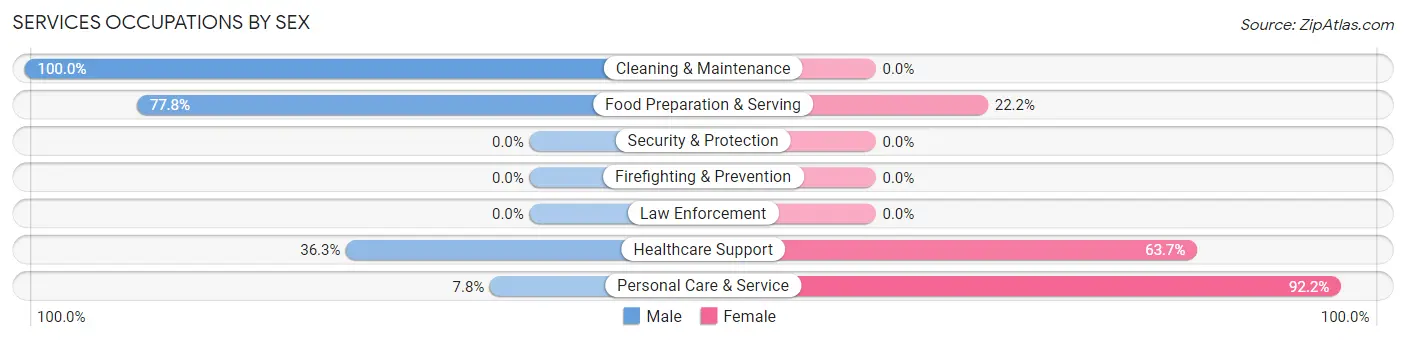
| Occupation | Male | Female |
| Healthcare Support | 45 (36.3%) | 79 (63.7%) |
| Security & Protection | 0 (0.0%) | 0 (0.0%) |
| Firefighting & Prevention | 0 (0.0%) | 0 (0.0%) |
| Law Enforcement | 0 (0.0%) | 0 (0.0%) |
| Food Preparation & Serving | 28 (77.8%) | 8 (22.2%) |
| Cleaning & Maintenance | 17 (100.0%) | 0 (0.0%) |
| Personal Care & Service | 5 (7.8%) | 59 (92.2%) |
| Total (Category) | 95 (39.4%) | 146 (60.6%) |
| Total (Overall) | 472 (47.1%) | 531 (52.9%) |
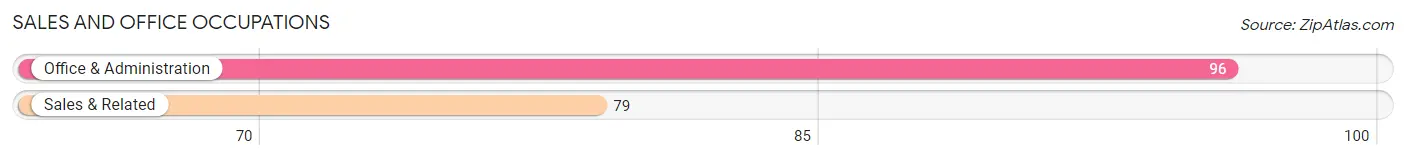
Sales and Office Occupations
The most common Sales and Office occupations in Columbia are Office & Administration (96 | 9.6%), and Sales & Related (79 | 7.9%).
Sales and Office Occupations by Sex
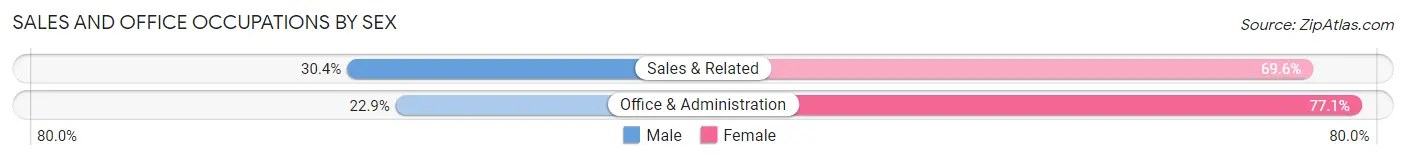
| Occupation | Male | Female |
| Sales & Related | 24 (30.4%) | 55 (69.6%) |
| Office & Administration | 22 (22.9%) | 74 (77.1%) |
| Total (Category) | 46 (26.3%) | 129 (73.7%) |
| Total (Overall) | 472 (47.1%) | 531 (52.9%) |
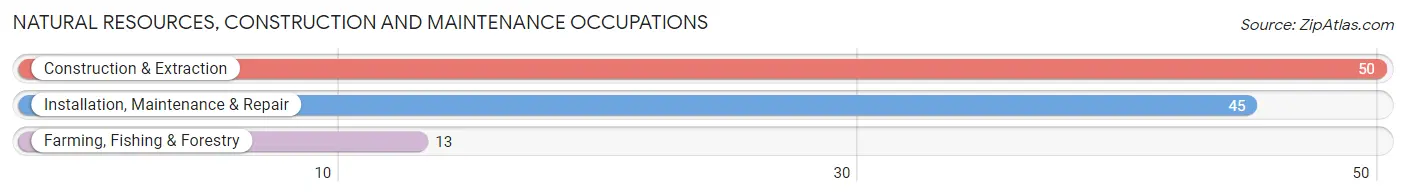
Natural Resources, Construction and Maintenance Occupations
The most common Natural Resources, Construction and Maintenance occupations in Columbia are Construction & Extraction (50 | 5.0%), Installation, Maintenance & Repair (45 | 4.5%), and Farming, Fishing & Forestry (13 | 1.3%).
Natural Resources, Construction and Maintenance Occupations by Sex
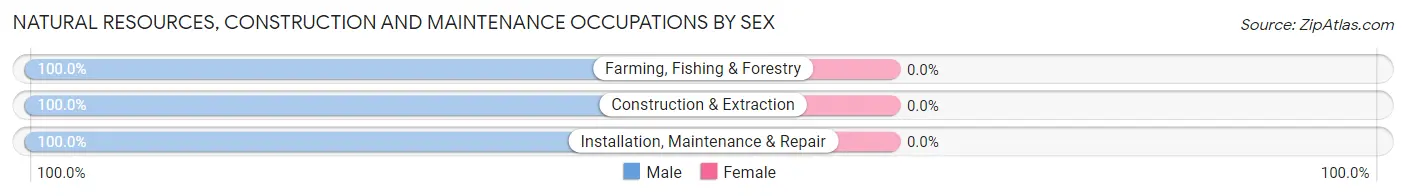
| Occupation | Male | Female |
| Farming, Fishing & Forestry | 13 (100.0%) | 0 (0.0%) |
| Construction & Extraction | 50 (100.0%) | 0 (0.0%) |
| Installation, Maintenance & Repair | 45 (100.0%) | 0 (0.0%) |
| Total (Category) | 108 (100.0%) | 0 (0.0%) |
| Total (Overall) | 472 (47.1%) | 531 (52.9%) |
Production, Transportation and Moving Occupations
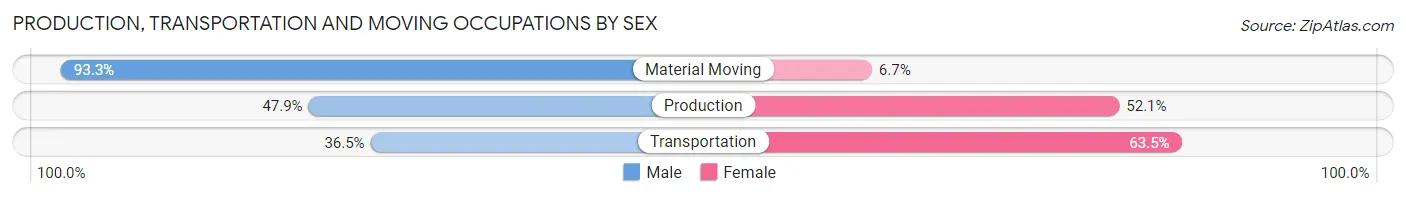
The most common Production, Transportation and Moving occupations in Columbia are Transportation (104 | 10.4%), Production (48 | 4.8%), and Material Moving (15 | 1.5%).
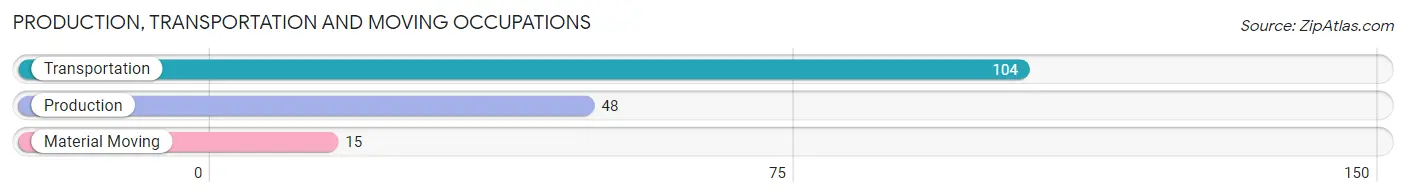
Production, Transportation and Moving Occupations by Sex
| Occupation | Male | Female |
| Production | 23 (47.9%) | 25 (52.1%) |
| Transportation | 38 (36.5%) | 66 (63.5%) |
| Material Moving | 14 (93.3%) | 1 (6.7%) |
| Total (Category) | 75 (44.9%) | 92 (55.1%) |
| Total (Overall) | 472 (47.1%) | 531 (52.9%) |
Employment Industries by Sex in Columbia
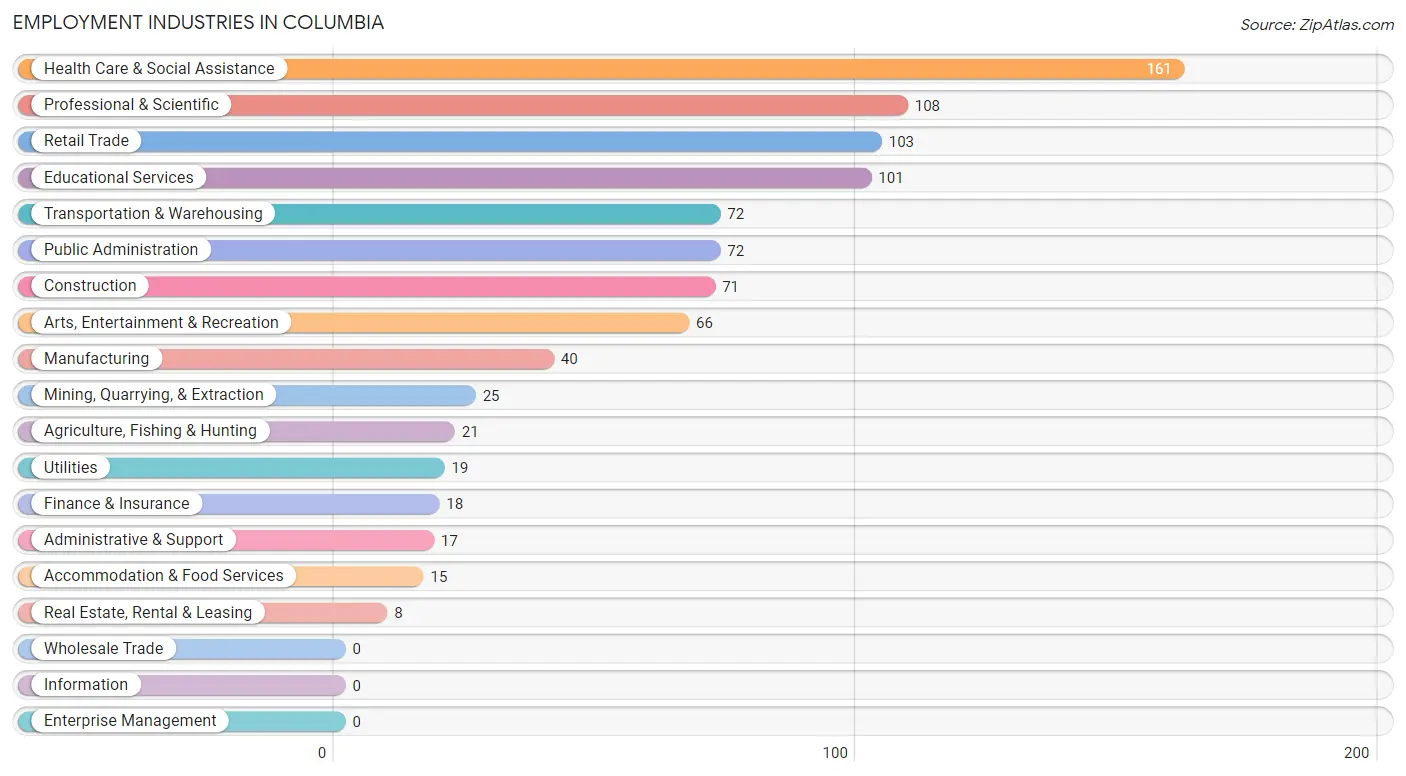
Employment Industries in Columbia
The major employment industries in Columbia include Health Care & Social Assistance (161 | 16.1%), Professional & Scientific (108 | 10.8%), Retail Trade (103 | 10.3%), Educational Services (101 | 10.1%), and Transportation & Warehousing (72 | 7.2%).
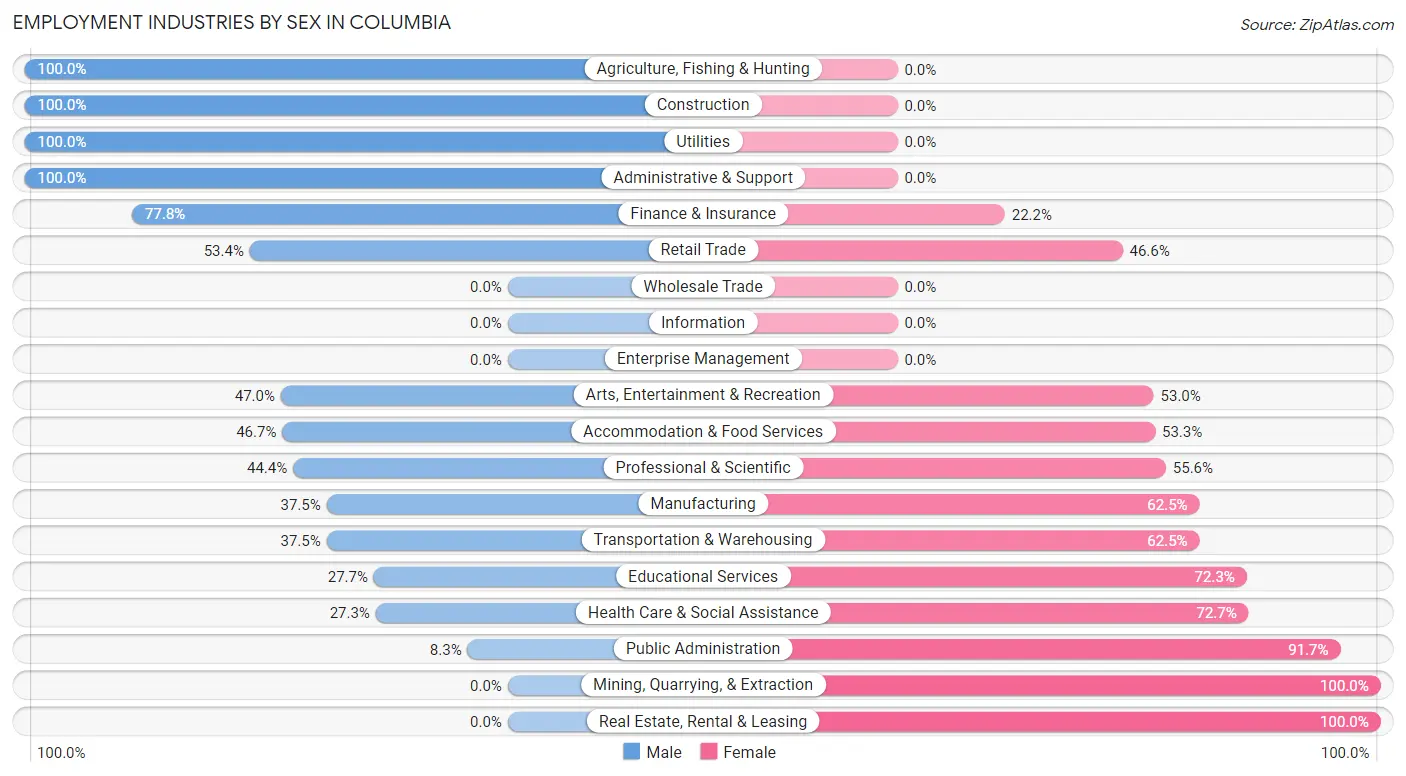
Employment Industries by Sex in Columbia
The Columbia industries that see more men than women are Agriculture, Fishing & Hunting (100.0%), Construction (100.0%), and Utilities (100.0%), whereas the industries that tend to have a higher number of women are Mining, Quarrying, & Extraction (100.0%), Real Estate, Rental & Leasing (100.0%), and Public Administration (91.7%).
| Industry | Male | Female |
| Agriculture, Fishing & Hunting | 21 (100.0%) | 0 (0.0%) |
| Mining, Quarrying, & Extraction | 0 (0.0%) | 25 (100.0%) |
| Construction | 71 (100.0%) | 0 (0.0%) |
| Manufacturing | 15 (37.5%) | 25 (62.5%) |
| Wholesale Trade | 0 (0.0%) | 0 (0.0%) |
| Retail Trade | 55 (53.4%) | 48 (46.6%) |
| Transportation & Warehousing | 27 (37.5%) | 45 (62.5%) |
| Utilities | 19 (100.0%) | 0 (0.0%) |
| Information | 0 (0.0%) | 0 (0.0%) |
| Finance & Insurance | 14 (77.8%) | 4 (22.2%) |
| Real Estate, Rental & Leasing | 0 (0.0%) | 8 (100.0%) |
| Professional & Scientific | 48 (44.4%) | 60 (55.6%) |
| Enterprise Management | 0 (0.0%) | 0 (0.0%) |
| Administrative & Support | 17 (100.0%) | 0 (0.0%) |
| Educational Services | 28 (27.7%) | 73 (72.3%) |
| Health Care & Social Assistance | 44 (27.3%) | 117 (72.7%) |
| Arts, Entertainment & Recreation | 31 (47.0%) | 35 (53.0%) |
| Accommodation & Food Services | 7 (46.7%) | 8 (53.3%) |
| Public Administration | 6 (8.3%) | 66 (91.7%) |
| Total | 472 (47.1%) | 531 (52.9%) |
Education in Columbia
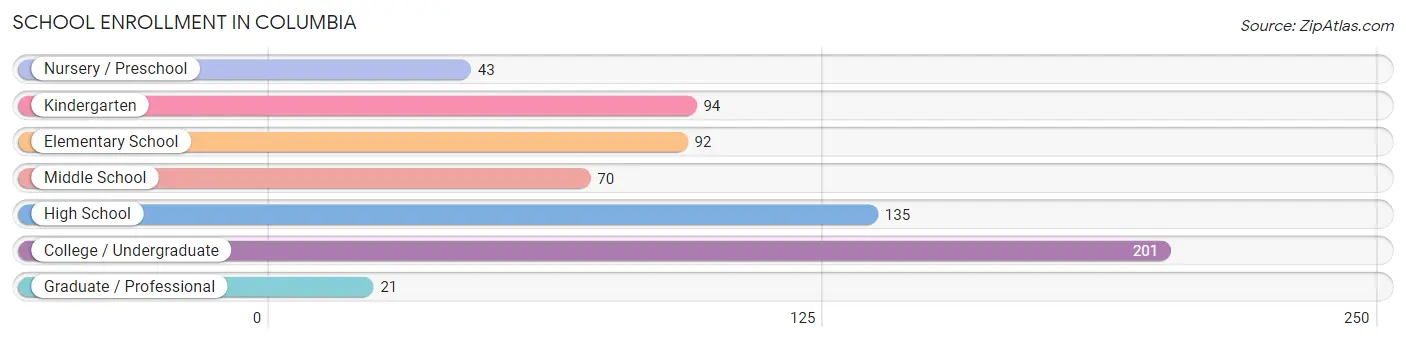
School Enrollment in Columbia
The most common levels of schooling among the 656 students in Columbia are college / undergraduate (201 | 30.6%), high school (135 | 20.6%), and kindergarten (94 | 14.3%).
| School Level | # Students | % Students |
| Nursery / Preschool | 43 | 6.6% |
| Kindergarten | 94 | 14.3% |
| Elementary School | 92 | 14.0% |
| Middle School | 70 | 10.7% |
| High School | 135 | 20.6% |
| College / Undergraduate | 201 | 30.6% |
| Graduate / Professional | 21 | 3.2% |
| Total | 656 | 100.0% |
School Enrollment by Age by Funding Source in Columbia
Out of a total of 656 students who are enrolled in schools in Columbia, 210 (32.0%) attend a private institution, while the remaining 446 (68.0%) are enrolled in public schools. The age group of 3 to 4 year olds has the highest likelihood of being enrolled in private schools, with 13 (100.0% in the age bracket) enrolled. Conversely, the age group of 10 to 14 year olds has the lowest likelihood of being enrolled in a private school, with 70 (100.0% in the age bracket) attending a public institution.
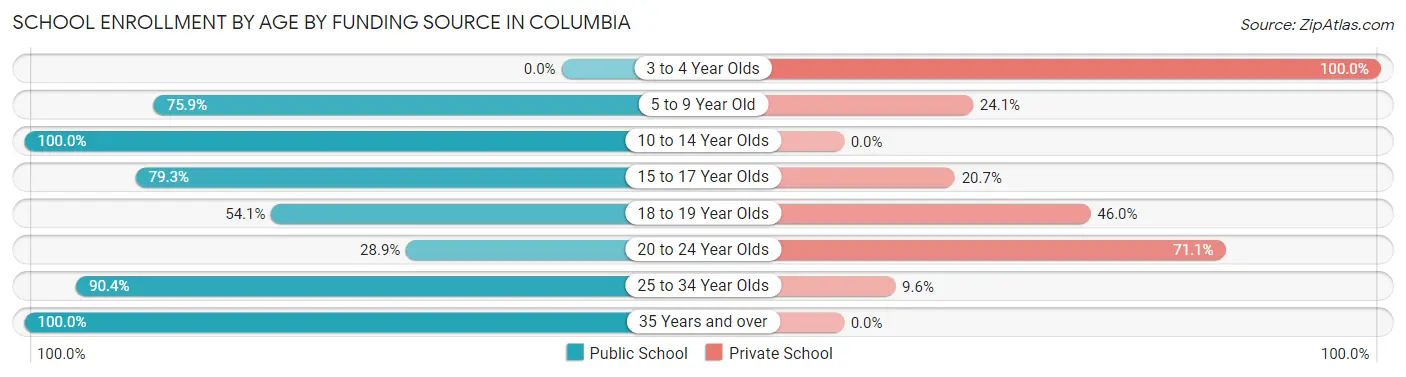
| Age Bracket | Public School | Private School |
| 3 to 4 Year Olds | 0 (0.0%) | 13 (100.0%) |
| 5 to 9 Year Old | 164 (75.9%) | 52 (24.1%) |
| 10 to 14 Year Olds | 70 (100.0%) | 0 (0.0%) |
| 15 to 17 Year Olds | 69 (79.3%) | 18 (20.7%) |
| 18 to 19 Year Olds | 40 (54.0%) | 34 (46.0%) |
| 20 to 24 Year Olds | 35 (28.9%) | 86 (71.1%) |
| 25 to 34 Year Olds | 66 (90.4%) | 7 (9.6%) |
| 35 Years and over | 2 (100.0%) | 0 (0.0%) |
| Total | 446 (68.0%) | 210 (32.0%) |
Educational Attainment by Field of Study in Columbia
Science & technology (89 | 17.0%), business (83 | 15.8%), bio, nature & agricultural (76 | 14.5%), engineering (60 | 11.5%), and education (45 | 8.6%) are the most common fields of study among 524 individuals in Columbia who have obtained a bachelor's degree or higher.
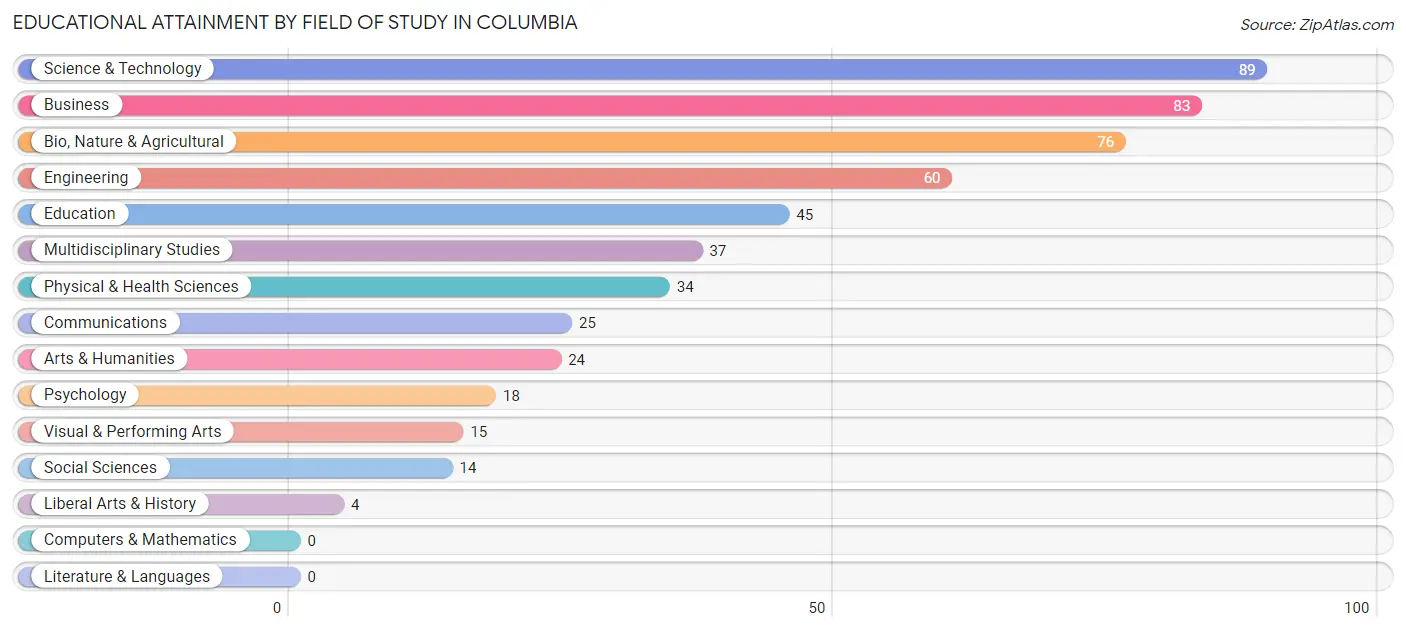
| Field of Study | # Graduates | % Graduates |
| Computers & Mathematics | 0 | 0.0% |
| Bio, Nature & Agricultural | 76 | 14.5% |
| Physical & Health Sciences | 34 | 6.5% |
| Psychology | 18 | 3.4% |
| Social Sciences | 14 | 2.7% |
| Engineering | 60 | 11.5% |
| Multidisciplinary Studies | 37 | 7.1% |
| Science & Technology | 89 | 17.0% |
| Business | 83 | 15.8% |
| Education | 45 | 8.6% |
| Literature & Languages | 0 | 0.0% |
| Liberal Arts & History | 4 | 0.8% |
| Visual & Performing Arts | 15 | 2.9% |
| Communications | 25 | 4.8% |
| Arts & Humanities | 24 | 4.6% |
| Total | 524 | 100.0% |
Transportation & Commute in Columbia
Vehicle Availability by Sex in Columbia
The most prevalent vehicle ownership categories in Columbia are males with 4 vehicles (156, accounting for 33.5%) and females with 4 vehicles (141, making up 34.9%).
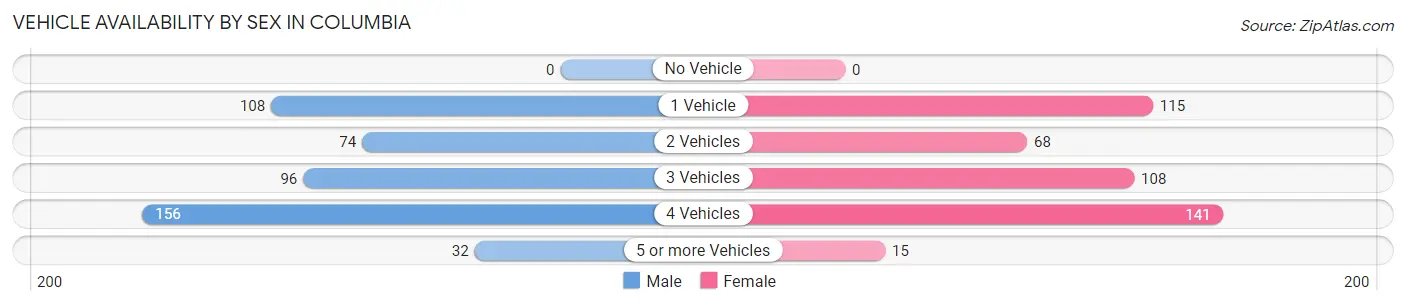
| Vehicles Available | Male | Female |
| No Vehicle | 0 (0.0%) | 0 (0.0%) |
| 1 Vehicle | 108 (23.2%) | 115 (25.7%) |
| 2 Vehicles | 74 (15.9%) | 68 (15.2%) |
| 3 Vehicles | 96 (20.6%) | 108 (24.2%) |
| 4 Vehicles | 156 (33.5%) | 141 (31.5%) |
| 5 or more Vehicles | 32 (6.9%) | 15 (3.4%) |
| Total | 466 (100.0%) | 447 (100.0%) |
Commute Time in Columbia
The most frequently occuring commute durations in Columbia are 15 to 19 minutes (144 commuters, 16.1%), 10 to 14 minutes (133 commuters, 14.9%), and 30 to 34 minutes (115 commuters, 12.9%).
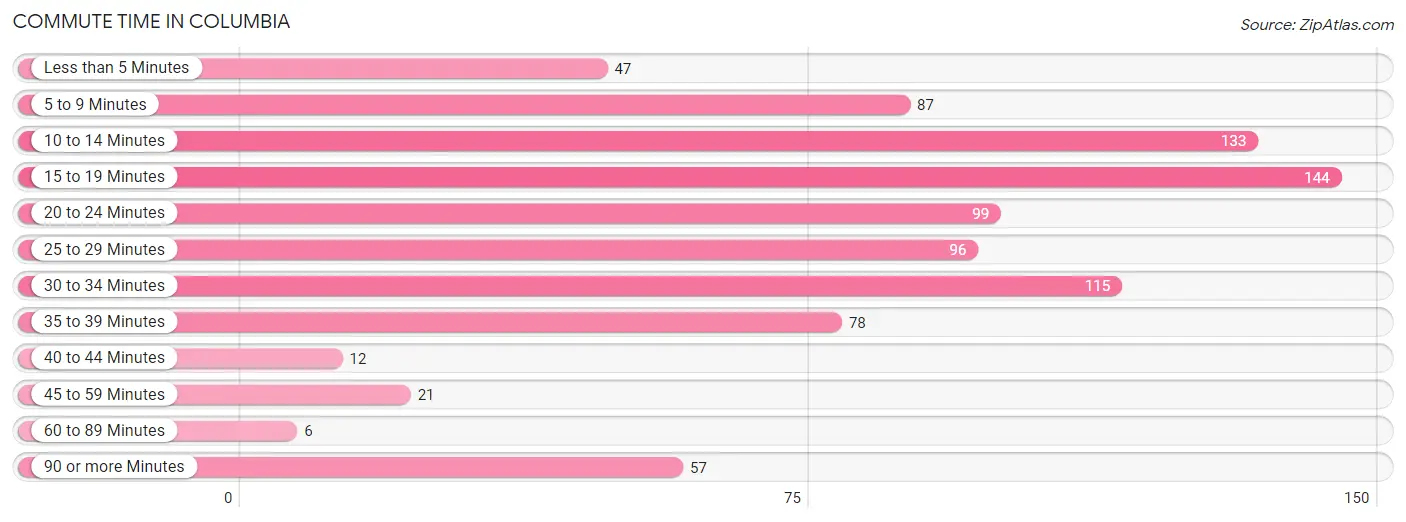
| Commute Time | # Commuters | % Commuters |
| Less than 5 Minutes | 47 | 5.2% |
| 5 to 9 Minutes | 87 | 9.7% |
| 10 to 14 Minutes | 133 | 14.9% |
| 15 to 19 Minutes | 144 | 16.1% |
| 20 to 24 Minutes | 99 | 11.1% |
| 25 to 29 Minutes | 96 | 10.7% |
| 30 to 34 Minutes | 115 | 12.9% |
| 35 to 39 Minutes | 78 | 8.7% |
| 40 to 44 Minutes | 12 | 1.3% |
| 45 to 59 Minutes | 21 | 2.4% |
| 60 to 89 Minutes | 6 | 0.7% |
| 90 or more Minutes | 57 | 6.4% |
Commute Time by Sex in Columbia
The most common commute times in Columbia are 15 to 19 minutes (110 commuters, 25.5%) for males and 10 to 14 minutes (85 commuters, 18.4%) for females.
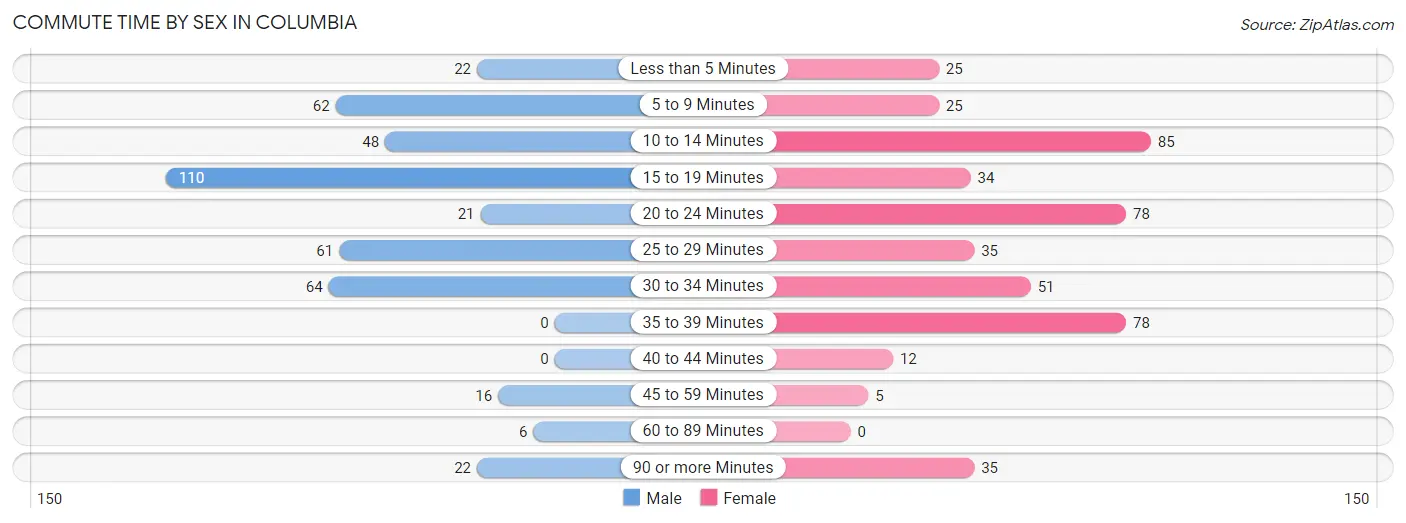
| Commute Time | Male | Female |
| Less than 5 Minutes | 22 (5.1%) | 25 (5.4%) |
| 5 to 9 Minutes | 62 (14.3%) | 25 (5.4%) |
| 10 to 14 Minutes | 48 (11.1%) | 85 (18.4%) |
| 15 to 19 Minutes | 110 (25.5%) | 34 (7.3%) |
| 20 to 24 Minutes | 21 (4.9%) | 78 (16.9%) |
| 25 to 29 Minutes | 61 (14.1%) | 35 (7.6%) |
| 30 to 34 Minutes | 64 (14.8%) | 51 (11.0%) |
| 35 to 39 Minutes | 0 (0.0%) | 78 (16.9%) |
| 40 to 44 Minutes | 0 (0.0%) | 12 (2.6%) |
| 45 to 59 Minutes | 16 (3.7%) | 5 (1.1%) |
| 60 to 89 Minutes | 6 (1.4%) | 0 (0.0%) |
| 90 or more Minutes | 22 (5.1%) | 35 (7.6%) |
Time of Departure to Work by Sex in Columbia
The most frequent times of departure to work in Columbia are 7:30 AM to 7:59 AM (74, 17.1%) for males and 12:00 PM to 3:59 PM (115, 24.8%) for females.
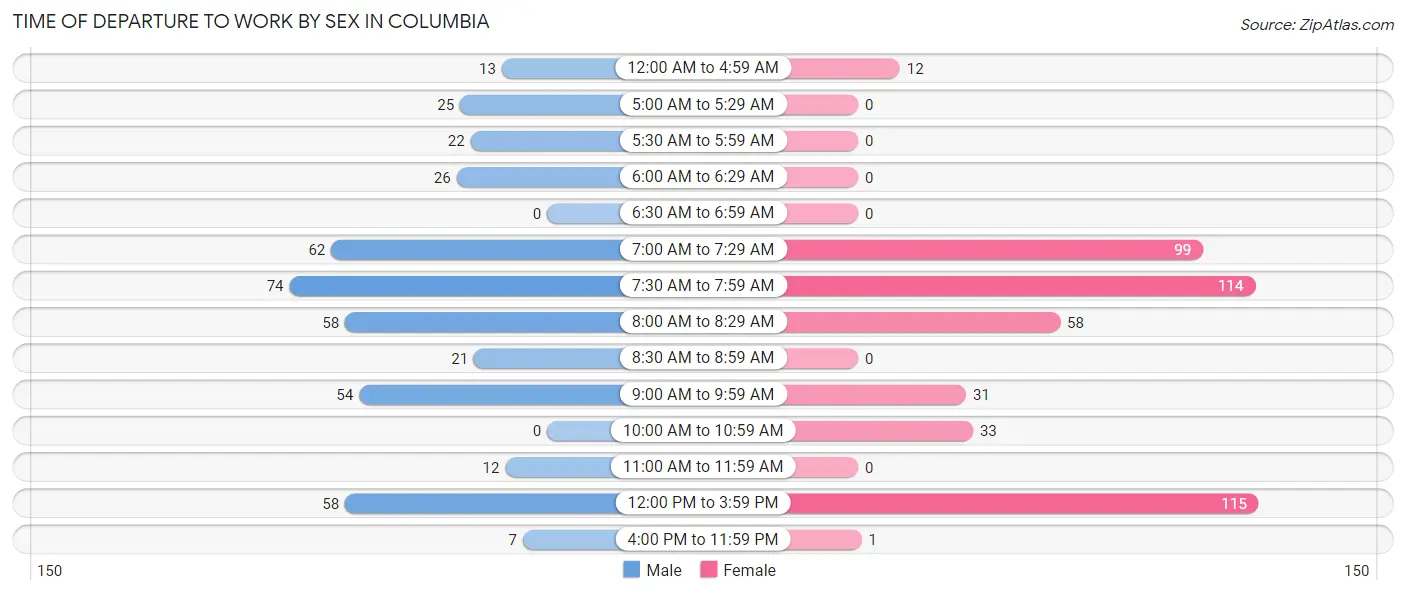
| Time of Departure | Male | Female |
| 12:00 AM to 4:59 AM | 13 (3.0%) | 12 (2.6%) |
| 5:00 AM to 5:29 AM | 25 (5.8%) | 0 (0.0%) |
| 5:30 AM to 5:59 AM | 22 (5.1%) | 0 (0.0%) |
| 6:00 AM to 6:29 AM | 26 (6.0%) | 0 (0.0%) |
| 6:30 AM to 6:59 AM | 0 (0.0%) | 0 (0.0%) |
| 7:00 AM to 7:29 AM | 62 (14.3%) | 99 (21.4%) |
| 7:30 AM to 7:59 AM | 74 (17.1%) | 114 (24.6%) |
| 8:00 AM to 8:29 AM | 58 (13.4%) | 58 (12.5%) |
| 8:30 AM to 8:59 AM | 21 (4.9%) | 0 (0.0%) |
| 9:00 AM to 9:59 AM | 54 (12.5%) | 31 (6.7%) |
| 10:00 AM to 10:59 AM | 0 (0.0%) | 33 (7.1%) |
| 11:00 AM to 11:59 AM | 12 (2.8%) | 0 (0.0%) |
| 12:00 PM to 3:59 PM | 58 (13.4%) | 115 (24.8%) |
| 4:00 PM to 11:59 PM | 7 (1.6%) | 1 (0.2%) |
| Total | 432 (100.0%) | 463 (100.0%) |
Housing Occupancy in Columbia
Occupancy by Ownership in Columbia
Of the total 1,033 dwellings in Columbia, owner-occupied units account for 696 (67.4%), while renter-occupied units make up 337 (32.6%).
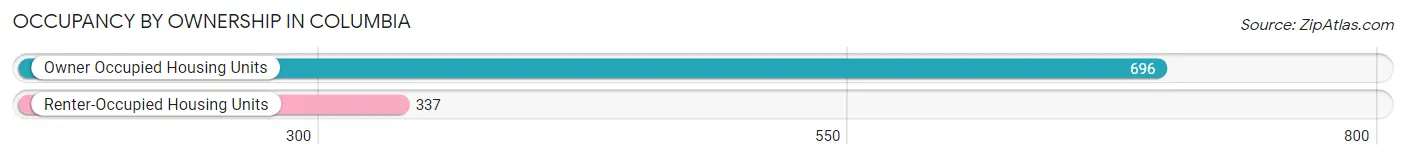
| Occupancy | # Housing Units | % Housing Units |
| Owner Occupied Housing Units | 696 | 67.4% |
| Renter-Occupied Housing Units | 337 | 32.6% |
| Total Occupied Housing Units | 1,033 | 100.0% |
Occupancy by Household Size in Columbia
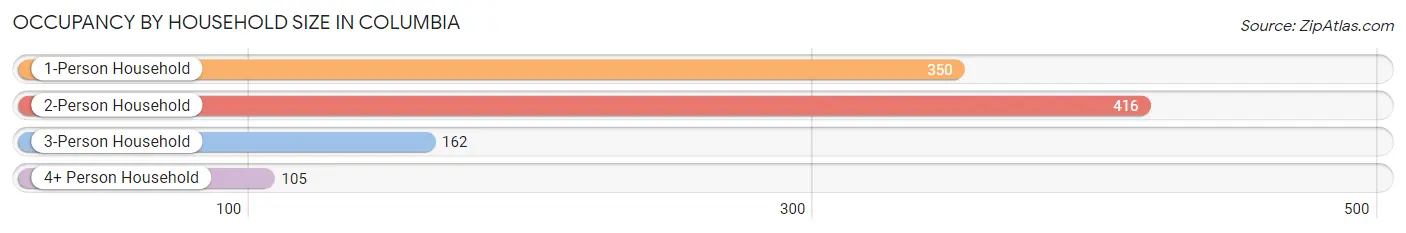
| Household Size | # Housing Units | % Housing Units |
| 1-Person Household | 350 | 33.9% |
| 2-Person Household | 416 | 40.3% |
| 3-Person Household | 162 | 15.7% |
| 4+ Person Household | 105 | 10.2% |
| Total Housing Units | 1,033 | 100.0% |
Occupancy by Ownership by Household Size in Columbia
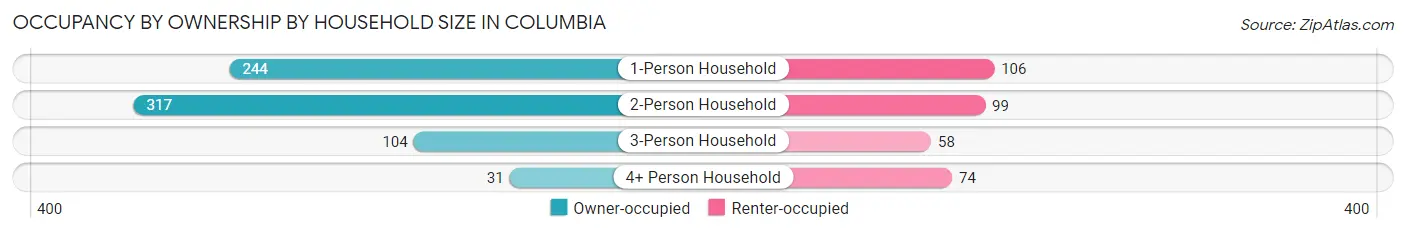
| Household Size | Owner-occupied | Renter-occupied |
| 1-Person Household | 244 (69.7%) | 106 (30.3%) |
| 2-Person Household | 317 (76.2%) | 99 (23.8%) |
| 3-Person Household | 104 (64.2%) | 58 (35.8%) |
| 4+ Person Household | 31 (29.5%) | 74 (70.5%) |
| Total Housing Units | 696 (67.4%) | 337 (32.6%) |
Occupancy by Educational Attainment in Columbia
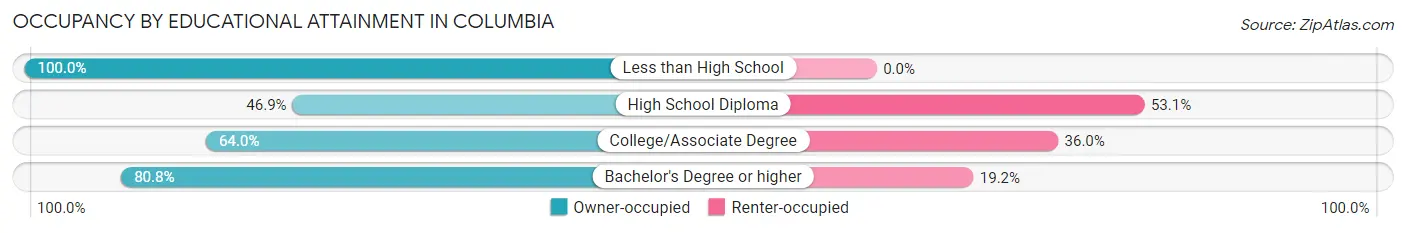
| Household Size | Owner-occupied | Renter-occupied |
| Less than High School | 41 (100.0%) | 0 (0.0%) |
| High School Diploma | 68 (46.9%) | 77 (53.1%) |
| College/Associate Degree | 372 (64.0%) | 209 (36.0%) |
| Bachelor's Degree or higher | 215 (80.8%) | 51 (19.2%) |
Occupancy by Age of Householder in Columbia
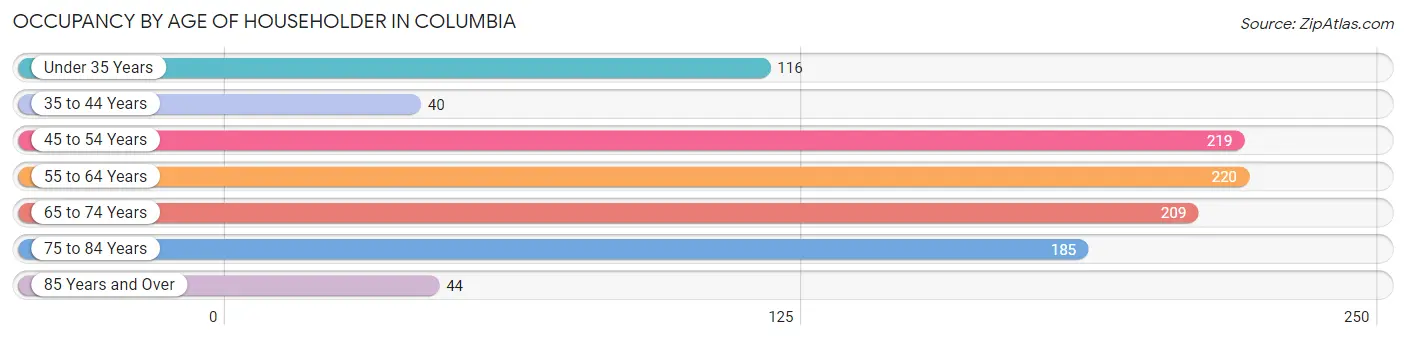
| Age Bracket | # Households | % Households |
| Under 35 Years | 116 | 11.2% |
| 35 to 44 Years | 40 | 3.9% |
| 45 to 54 Years | 219 | 21.2% |
| 55 to 64 Years | 220 | 21.3% |
| 65 to 74 Years | 209 | 20.2% |
| 75 to 84 Years | 185 | 17.9% |
| 85 Years and Over | 44 | 4.3% |
| Total | 1,033 | 100.0% |
Housing Finances in Columbia
Median Income by Occupancy in Columbia
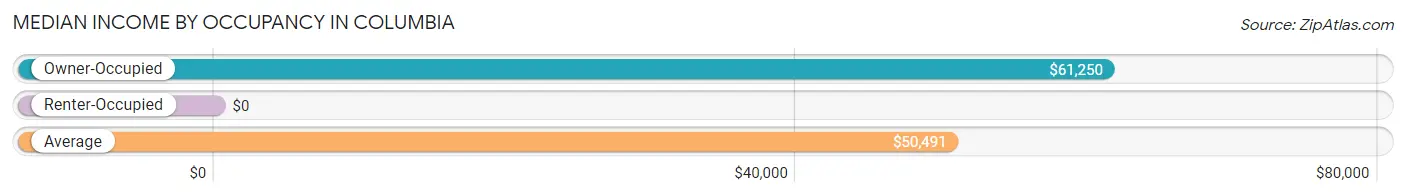
| Occupancy Type | # Households | Median Income |
| Owner-Occupied | 696 (67.4%) | $61,250 |
| Renter-Occupied | 337 (32.6%) | $0 |
| Average | 1,033 (100.0%) | $50,491 |
Occupancy by Householder Income Bracket in Columbia
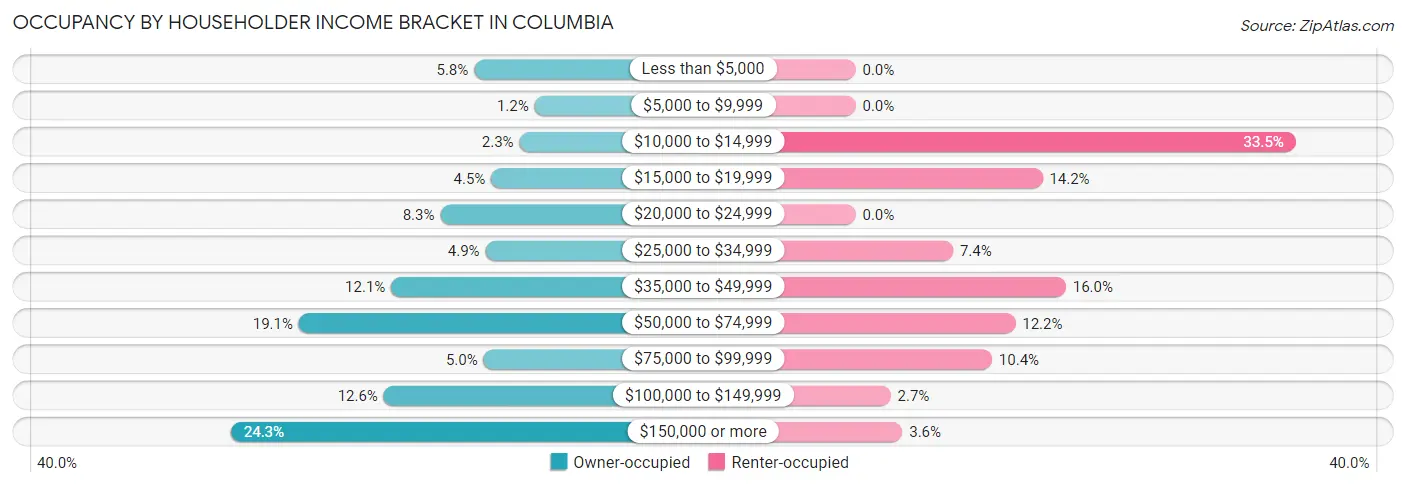
| Income Bracket | Owner-occupied | Renter-occupied |
| Less than $5,000 | 40 (5.8%) | 0 (0.0%) |
| $5,000 to $9,999 | 8 (1.1%) | 0 (0.0%) |
| $10,000 to $14,999 | 16 (2.3%) | 113 (33.5%) |
| $15,000 to $19,999 | 31 (4.4%) | 48 (14.2%) |
| $20,000 to $24,999 | 58 (8.3%) | 0 (0.0%) |
| $25,000 to $34,999 | 34 (4.9%) | 25 (7.4%) |
| $35,000 to $49,999 | 84 (12.1%) | 54 (16.0%) |
| $50,000 to $74,999 | 133 (19.1%) | 41 (12.2%) |
| $75,000 to $99,999 | 35 (5.0%) | 35 (10.4%) |
| $100,000 to $149,999 | 88 (12.6%) | 9 (2.7%) |
| $150,000 or more | 169 (24.3%) | 12 (3.6%) |
| Total | 696 (100.0%) | 337 (100.0%) |
Monthly Housing Cost Tiers in Columbia
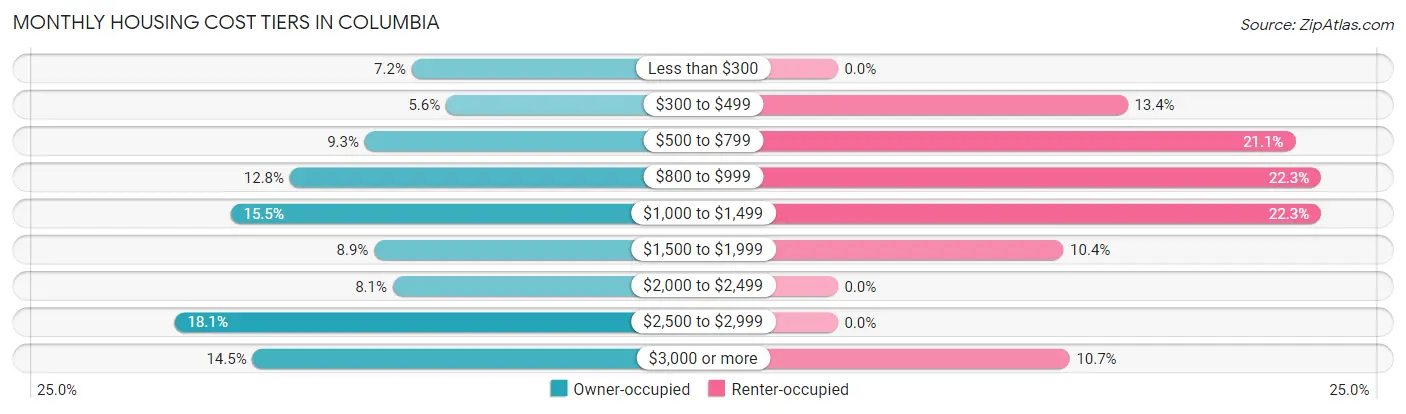
| Monthly Cost | Owner-occupied | Renter-occupied |
| Less than $300 | 50 (7.2%) | 0 (0.0%) |
| $300 to $499 | 39 (5.6%) | 45 (13.4%) |
| $500 to $799 | 65 (9.3%) | 71 (21.1%) |
| $800 to $999 | 89 (12.8%) | 75 (22.3%) |
| $1,000 to $1,499 | 108 (15.5%) | 75 (22.3%) |
| $1,500 to $1,999 | 62 (8.9%) | 35 (10.4%) |
| $2,000 to $2,499 | 56 (8.1%) | 0 (0.0%) |
| $2,500 to $2,999 | 126 (18.1%) | 0 (0.0%) |
| $3,000 or more | 101 (14.5%) | 36 (10.7%) |
| Total | 696 (100.0%) | 337 (100.0%) |
Physical Housing Characteristics in Columbia
Housing Structures in Columbia
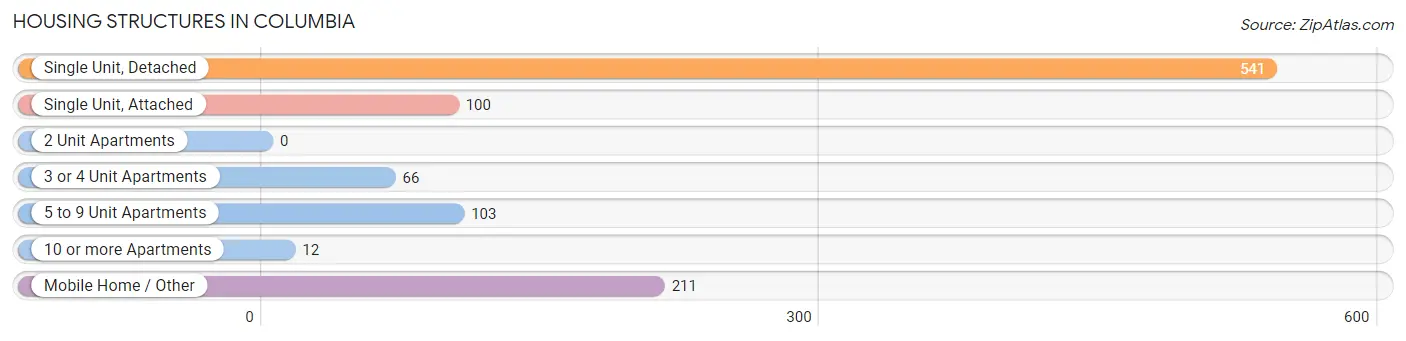
| Structure Type | # Housing Units | % Housing Units |
| Single Unit, Detached | 541 | 52.4% |
| Single Unit, Attached | 100 | 9.7% |
| 2 Unit Apartments | 0 | 0.0% |
| 3 or 4 Unit Apartments | 66 | 6.4% |
| 5 to 9 Unit Apartments | 103 | 10.0% |
| 10 or more Apartments | 12 | 1.2% |
| Mobile Home / Other | 211 | 20.4% |
| Total | 1,033 | 100.0% |
Housing Structures by Occupancy in Columbia
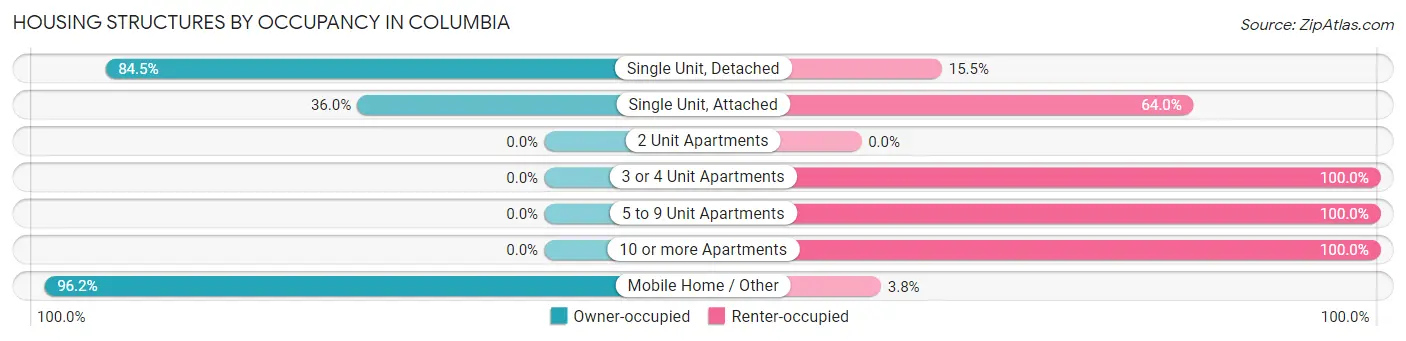
| Structure Type | Owner-occupied | Renter-occupied |
| Single Unit, Detached | 457 (84.5%) | 84 (15.5%) |
| Single Unit, Attached | 36 (36.0%) | 64 (64.0%) |
| 2 Unit Apartments | 0 (0.0%) | 0 (0.0%) |
| 3 or 4 Unit Apartments | 0 (0.0%) | 66 (100.0%) |
| 5 to 9 Unit Apartments | 0 (0.0%) | 103 (100.0%) |
| 10 or more Apartments | 0 (0.0%) | 12 (100.0%) |
| Mobile Home / Other | 203 (96.2%) | 8 (3.8%) |
| Total | 696 (67.4%) | 337 (32.6%) |
Housing Structures by Number of Rooms in Columbia
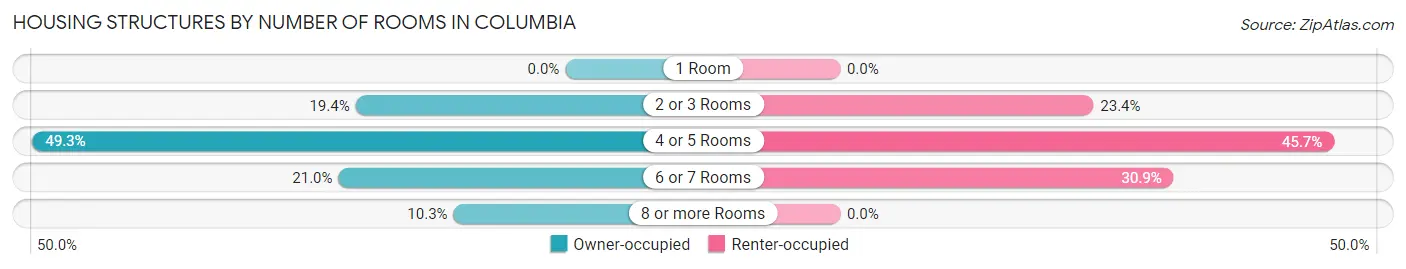
| Number of Rooms | Owner-occupied | Renter-occupied |
| 1 Room | 0 (0.0%) | 0 (0.0%) |
| 2 or 3 Rooms | 135 (19.4%) | 79 (23.4%) |
| 4 or 5 Rooms | 343 (49.3%) | 154 (45.7%) |
| 6 or 7 Rooms | 146 (21.0%) | 104 (30.9%) |
| 8 or more Rooms | 72 (10.3%) | 0 (0.0%) |
| Total | 696 (100.0%) | 337 (100.0%) |
Housing Structure by Heating Type in Columbia
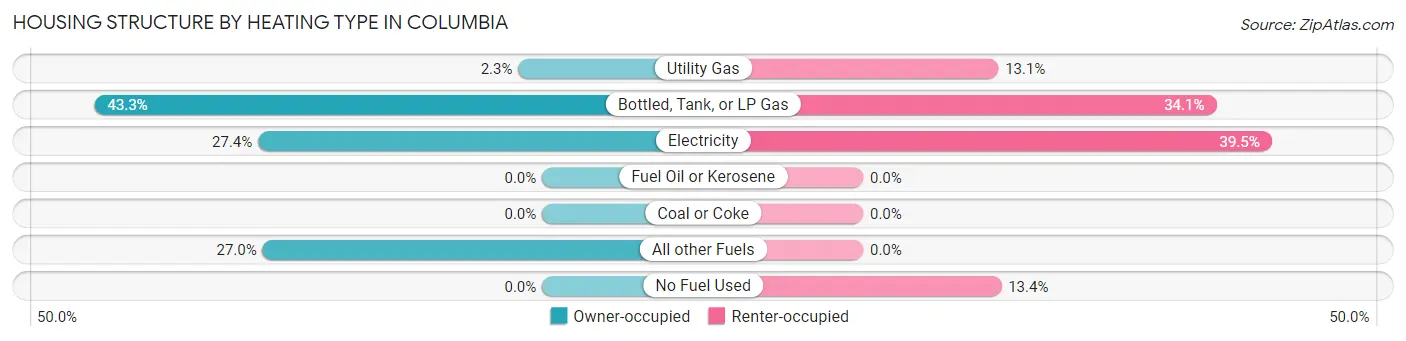
| Heating Type | Owner-occupied | Renter-occupied |
| Utility Gas | 16 (2.3%) | 44 (13.1%) |
| Bottled, Tank, or LP Gas | 301 (43.2%) | 115 (34.1%) |
| Electricity | 191 (27.4%) | 133 (39.5%) |
| Fuel Oil or Kerosene | 0 (0.0%) | 0 (0.0%) |
| Coal or Coke | 0 (0.0%) | 0 (0.0%) |
| All other Fuels | 188 (27.0%) | 0 (0.0%) |
| No Fuel Used | 0 (0.0%) | 45 (13.4%) |
| Total | 696 (100.0%) | 337 (100.0%) |
Household Vehicle Usage in Columbia
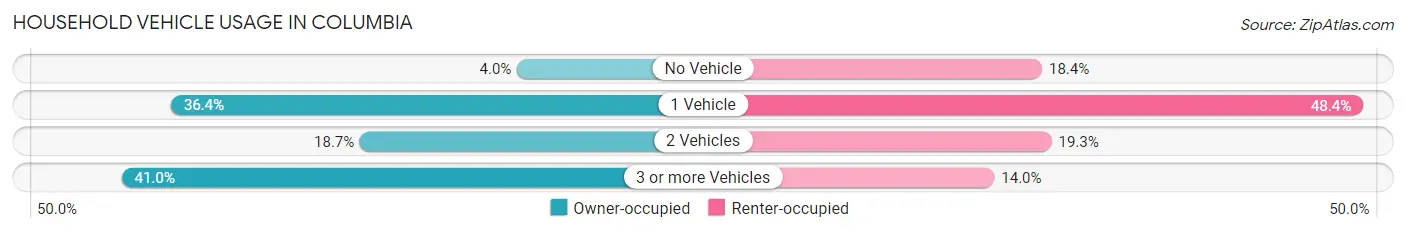
| Vehicles per Household | Owner-occupied | Renter-occupied |
| No Vehicle | 28 (4.0%) | 62 (18.4%) |
| 1 Vehicle | 253 (36.3%) | 163 (48.4%) |
| 2 Vehicles | 130 (18.7%) | 65 (19.3%) |
| 3 or more Vehicles | 285 (40.9%) | 47 (14.0%) |
| Total | 696 (100.0%) | 337 (100.0%) |
Real Estate & Mortgages in Columbia
Real Estate and Mortgage Overview in Columbia
| Characteristic | Without Mortgage | With Mortgage |
| Housing Units | 333 | 363 |
| Median Property Value | - | - |
| Median Household Income | $36,615 | $129 |
| Monthly Housing Costs | $821 | $101 |
| Real Estate Taxes | - | - |
Property Value by Mortgage Status in Columbia
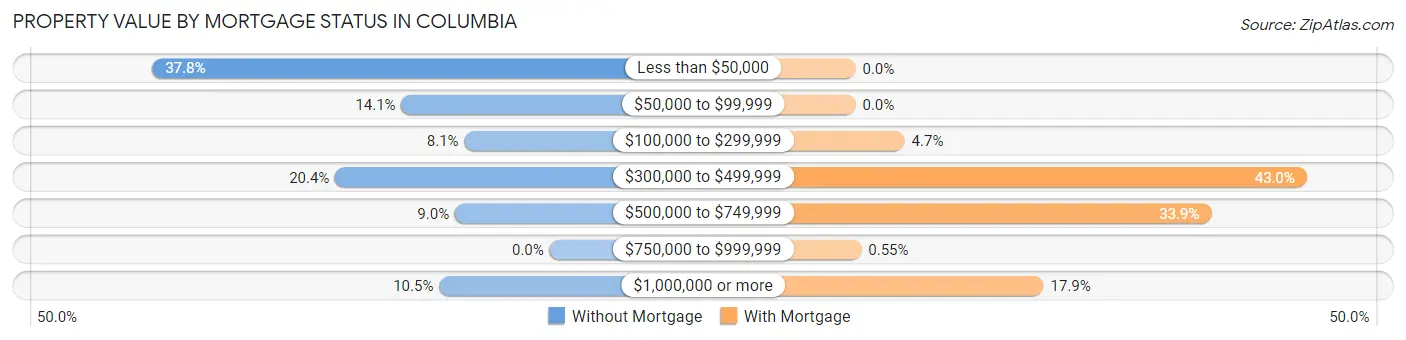
| Property Value | Without Mortgage | With Mortgage |
| Less than $50,000 | 126 (37.8%) | 0 (0.0%) |
| $50,000 to $99,999 | 47 (14.1%) | 0 (0.0%) |
| $100,000 to $299,999 | 27 (8.1%) | 17 (4.7%) |
| $300,000 to $499,999 | 68 (20.4%) | 156 (43.0%) |
| $500,000 to $749,999 | 30 (9.0%) | 123 (33.9%) |
| $750,000 to $999,999 | 0 (0.0%) | 2 (0.5%) |
| $1,000,000 or more | 35 (10.5%) | 65 (17.9%) |
| Total | 333 (100.0%) | 363 (100.0%) |
Household Income by Mortgage Status in Columbia
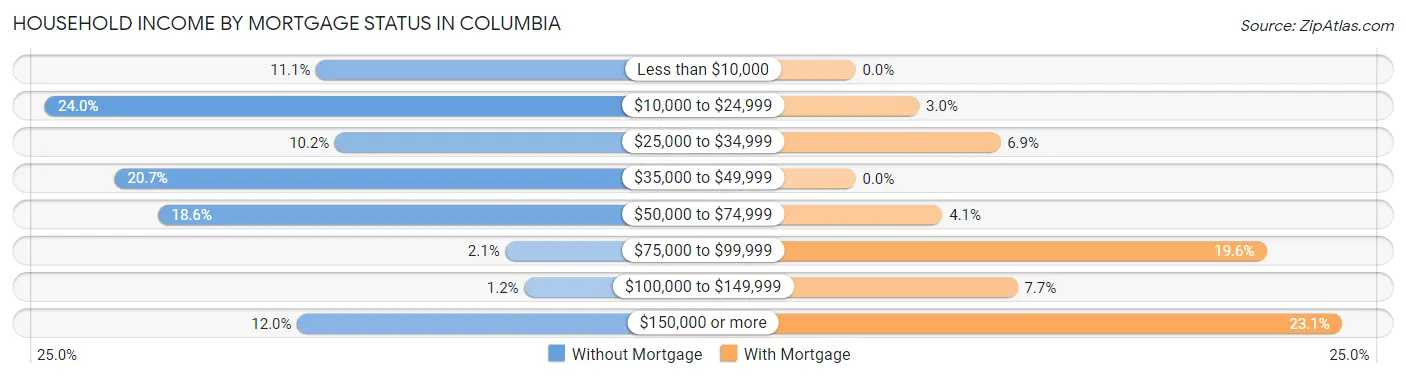
| Household Income | Without Mortgage | With Mortgage |
| Less than $10,000 | 37 (11.1%) | 0 (0.0%) |
| $10,000 to $24,999 | 80 (24.0%) | 11 (3.0%) |
| $25,000 to $34,999 | 34 (10.2%) | 25 (6.9%) |
| $35,000 to $49,999 | 69 (20.7%) | 0 (0.0%) |
| $50,000 to $74,999 | 62 (18.6%) | 15 (4.1%) |
| $75,000 to $99,999 | 7 (2.1%) | 71 (19.6%) |
| $100,000 to $149,999 | 4 (1.2%) | 28 (7.7%) |
| $150,000 or more | 40 (12.0%) | 84 (23.1%) |
| Total | 333 (100.0%) | 363 (100.0%) |
Property Value to Household Income Ratio in Columbia
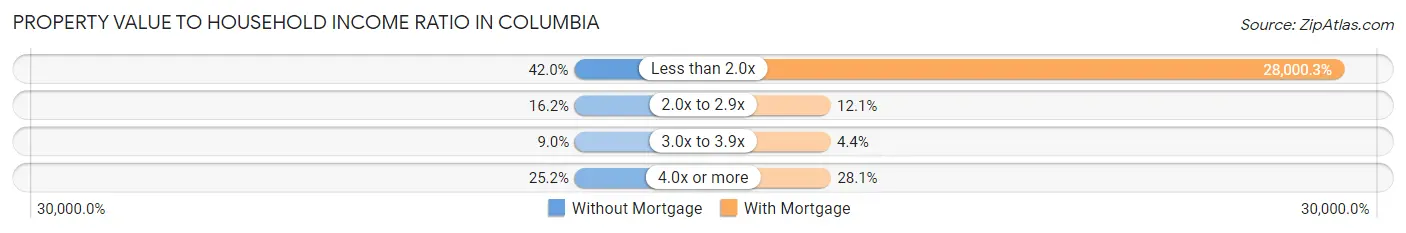
| Value-to-Income Ratio | Without Mortgage | With Mortgage |
| Less than 2.0x | 140 (42.0%) | 101,641 (28,000.3%) |
| 2.0x to 2.9x | 54 (16.2%) | 44 (12.1%) |
| 3.0x to 3.9x | 30 (9.0%) | 16 (4.4%) |
| 4.0x or more | 84 (25.2%) | 102 (28.1%) |
| Total | 333 (100.0%) | 363 (100.0%) |
Real Estate Taxes by Mortgage Status in Columbia
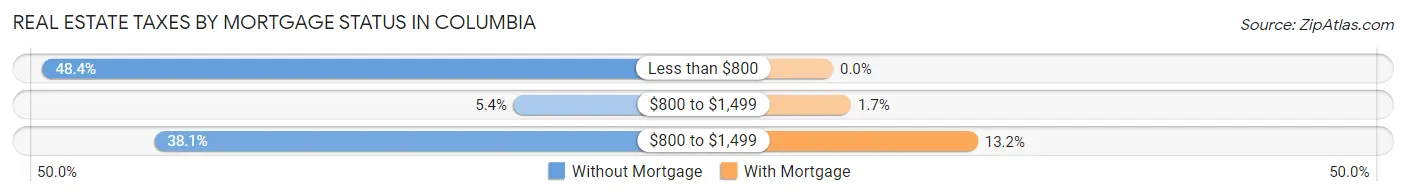
| Property Taxes | Without Mortgage | With Mortgage |
| Less than $800 | 161 (48.3%) | 0 (0.0%) |
| $800 to $1,499 | 18 (5.4%) | 6 (1.7%) |
| $800 to $1,499 | 127 (38.1%) | 48 (13.2%) |
| Total | 333 (100.0%) | 363 (100.0%) |
Health & Disability in Columbia
Health Insurance Coverage by Age in Columbia
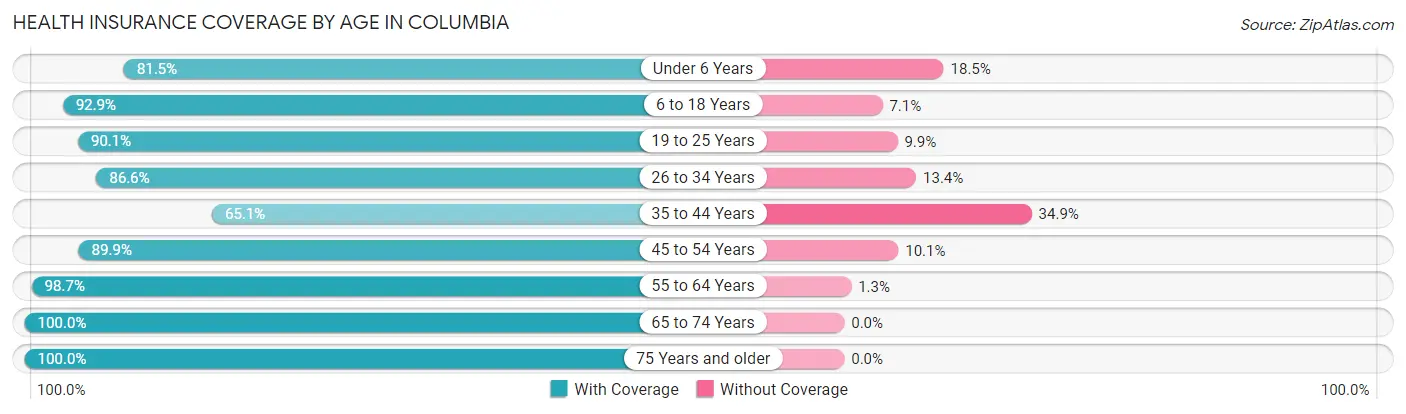
| Age Bracket | With Coverage | Without Coverage |
| Under 6 Years | 132 (81.5%) | 30 (18.5%) |
| 6 to 18 Years | 392 (92.9%) | 30 (7.1%) |
| 19 to 25 Years | 236 (90.1%) | 26 (9.9%) |
| 26 to 34 Years | 220 (86.6%) | 34 (13.4%) |
| 35 to 44 Years | 54 (65.1%) | 29 (34.9%) |
| 45 to 54 Years | 241 (89.9%) | 27 (10.1%) |
| 55 to 64 Years | 306 (98.7%) | 4 (1.3%) |
| 65 to 74 Years | 365 (100.0%) | 0 (0.0%) |
| 75 Years and older | 313 (100.0%) | 0 (0.0%) |
| Total | 2,259 (92.6%) | 180 (7.4%) |
Health Insurance Coverage by Citizenship Status in Columbia
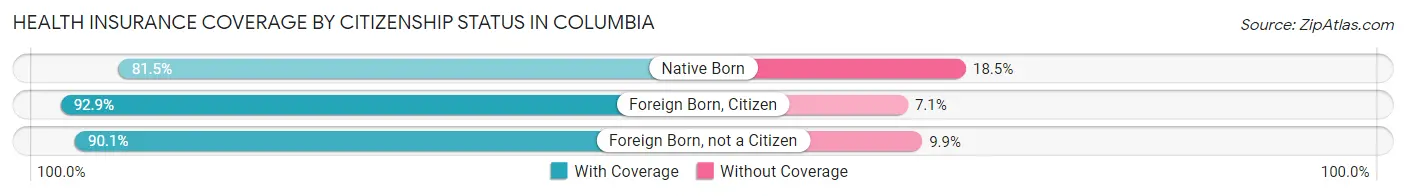
| Citizenship Status | With Coverage | Without Coverage |
| Native Born | 132 (81.5%) | 30 (18.5%) |
| Foreign Born, Citizen | 392 (92.9%) | 30 (7.1%) |
| Foreign Born, not a Citizen | 236 (90.1%) | 26 (9.9%) |
Health Insurance Coverage by Household Income in Columbia
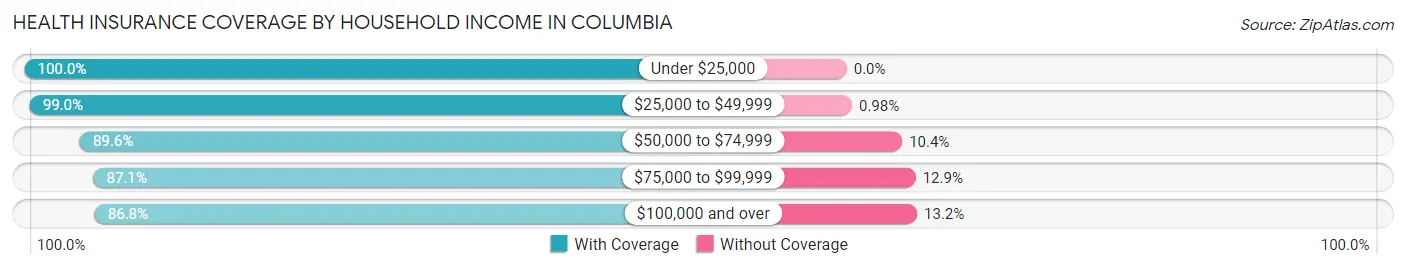
| Household Income | With Coverage | Without Coverage |
| Under $25,000 | 461 (100.0%) | 0 (0.0%) |
| $25,000 to $49,999 | 406 (99.0%) | 4 (1.0%) |
| $50,000 to $74,999 | 397 (89.6%) | 46 (10.4%) |
| $75,000 to $99,999 | 182 (87.1%) | 27 (12.9%) |
| $100,000 and over | 679 (86.8%) | 103 (13.2%) |
Public vs Private Health Insurance Coverage by Age in Columbia
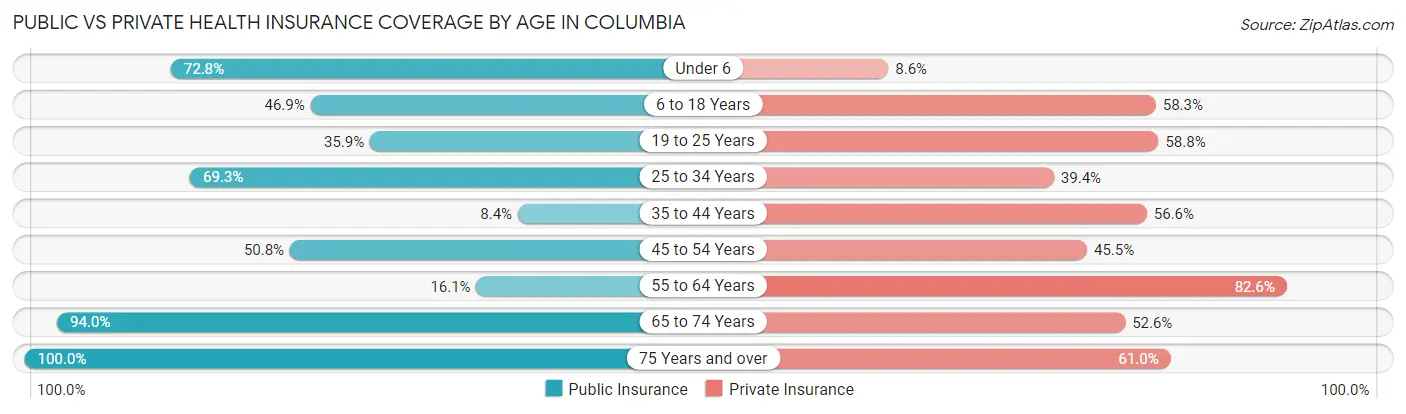
| Age Bracket | Public Insurance | Private Insurance |
| Under 6 | 118 (72.8%) | 14 (8.6%) |
| 6 to 18 Years | 198 (46.9%) | 246 (58.3%) |
| 19 to 25 Years | 94 (35.9%) | 154 (58.8%) |
| 25 to 34 Years | 176 (69.3%) | 100 (39.4%) |
| 35 to 44 Years | 7 (8.4%) | 47 (56.6%) |
| 45 to 54 Years | 136 (50.7%) | 122 (45.5%) |
| 55 to 64 Years | 50 (16.1%) | 256 (82.6%) |
| 65 to 74 Years | 343 (94.0%) | 192 (52.6%) |
| 75 Years and over | 313 (100.0%) | 191 (61.0%) |
| Total | 1,435 (58.8%) | 1,322 (54.2%) |
Disability Status by Sex by Age in Columbia
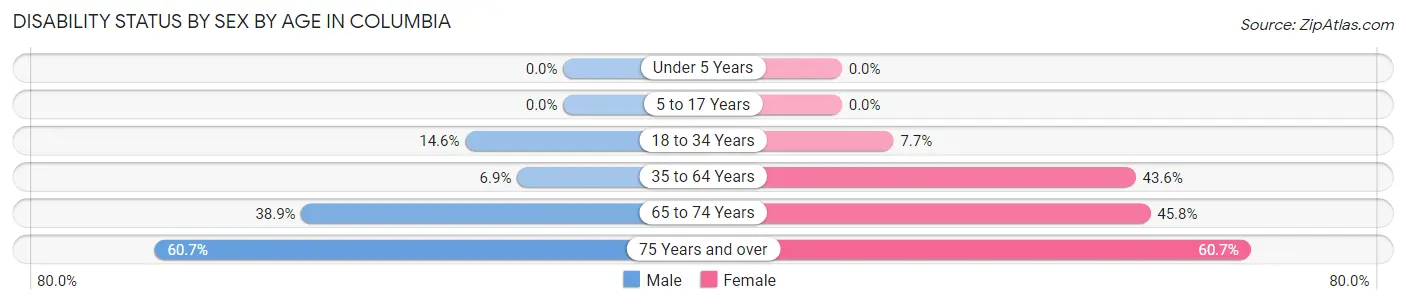
| Age Bracket | Male | Female |
| Under 5 Years | 0 (0.0%) | 0 (0.0%) |
| 5 to 17 Years | 0 (0.0%) | 0 (0.0%) |
| 18 to 34 Years | 38 (14.6%) | 22 (7.7%) |
| 35 to 64 Years | 20 (6.9%) | 161 (43.6%) |
| 65 to 74 Years | 63 (38.9%) | 93 (45.8%) |
| 75 Years and over | 102 (60.7%) | 88 (60.7%) |
Disability Class by Sex by Age in Columbia
Disability Class: Hearing Difficulty
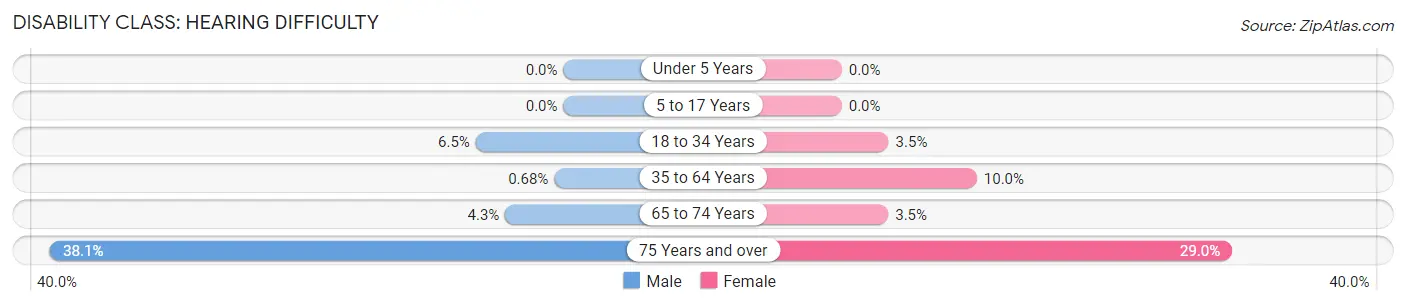
| Age Bracket | Male | Female |
| Under 5 Years | 0 (0.0%) | 0 (0.0%) |
| 5 to 17 Years | 0 (0.0%) | 0 (0.0%) |
| 18 to 34 Years | 17 (6.5%) | 10 (3.5%) |
| 35 to 64 Years | 2 (0.7%) | 37 (10.0%) |
| 65 to 74 Years | 7 (4.3%) | 7 (3.5%) |
| 75 Years and over | 64 (38.1%) | 42 (29.0%) |
Disability Class: Vision Difficulty
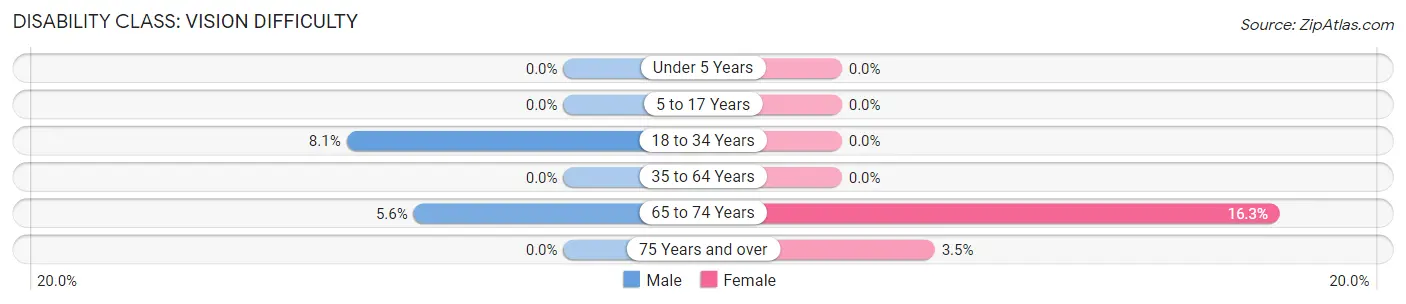
| Age Bracket | Male | Female |
| Under 5 Years | 0 (0.0%) | 0 (0.0%) |
| 5 to 17 Years | 0 (0.0%) | 0 (0.0%) |
| 18 to 34 Years | 21 (8.1%) | 0 (0.0%) |
| 35 to 64 Years | 0 (0.0%) | 0 (0.0%) |
| 65 to 74 Years | 9 (5.6%) | 33 (16.3%) |
| 75 Years and over | 0 (0.0%) | 5 (3.5%) |
Disability Class: Cognitive Difficulty
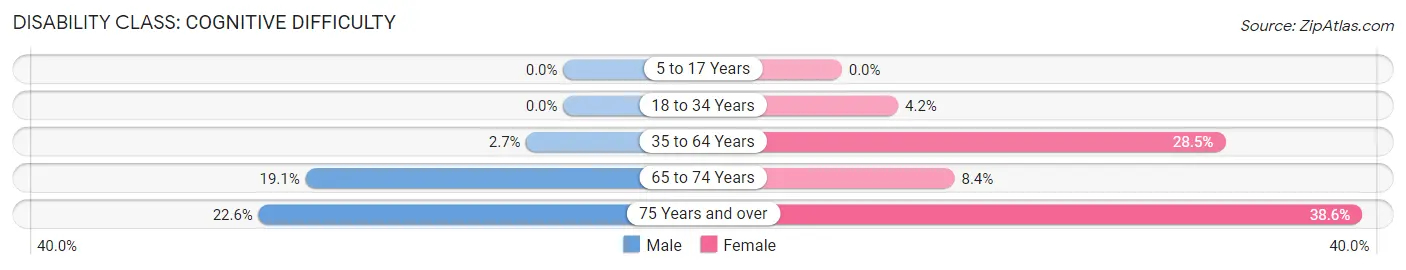
| Age Bracket | Male | Female |
| 5 to 17 Years | 0 (0.0%) | 0 (0.0%) |
| 18 to 34 Years | 0 (0.0%) | 12 (4.2%) |
| 35 to 64 Years | 8 (2.7%) | 105 (28.5%) |
| 65 to 74 Years | 31 (19.1%) | 17 (8.4%) |
| 75 Years and over | 38 (22.6%) | 56 (38.6%) |
Disability Class: Ambulatory Difficulty
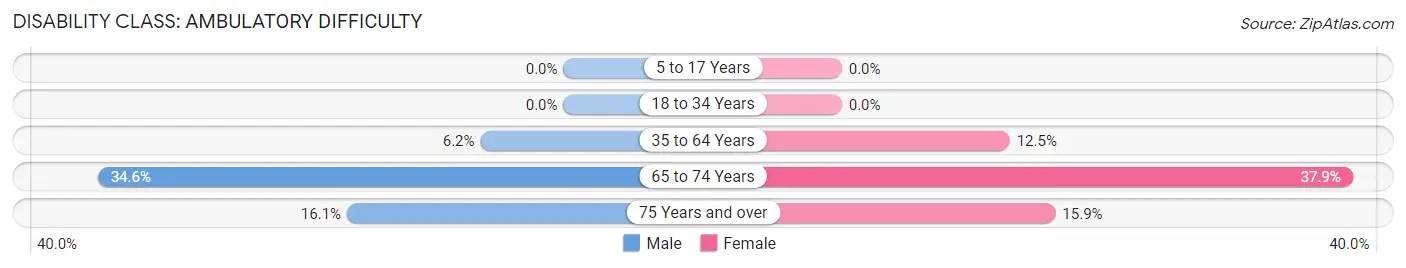
| Age Bracket | Male | Female |
| 5 to 17 Years | 0 (0.0%) | 0 (0.0%) |
| 18 to 34 Years | 0 (0.0%) | 0 (0.0%) |
| 35 to 64 Years | 18 (6.2%) | 46 (12.5%) |
| 65 to 74 Years | 56 (34.6%) | 77 (37.9%) |
| 75 Years and over | 27 (16.1%) | 23 (15.9%) |
Disability Class: Self-Care Difficulty
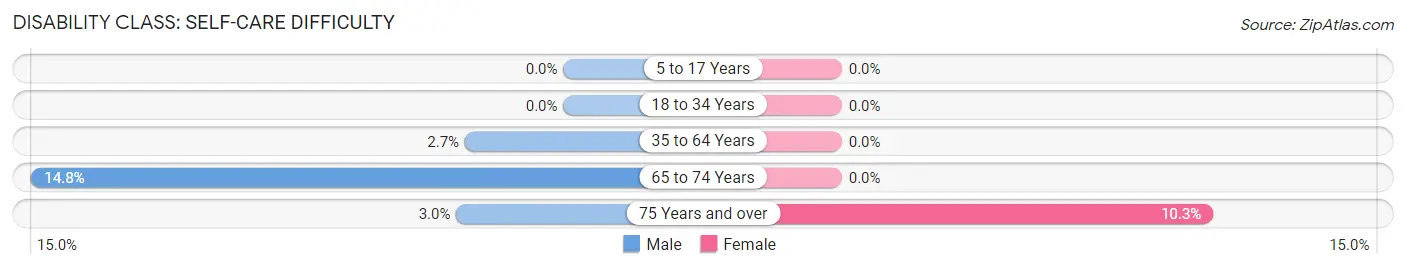
| Age Bracket | Male | Female |
| 5 to 17 Years | 0 (0.0%) | 0 (0.0%) |
| 18 to 34 Years | 0 (0.0%) | 0 (0.0%) |
| 35 to 64 Years | 8 (2.7%) | 0 (0.0%) |
| 65 to 74 Years | 24 (14.8%) | 0 (0.0%) |
| 75 Years and over | 5 (3.0%) | 15 (10.3%) |
Technology Access in Columbia
Computing Device Access in Columbia
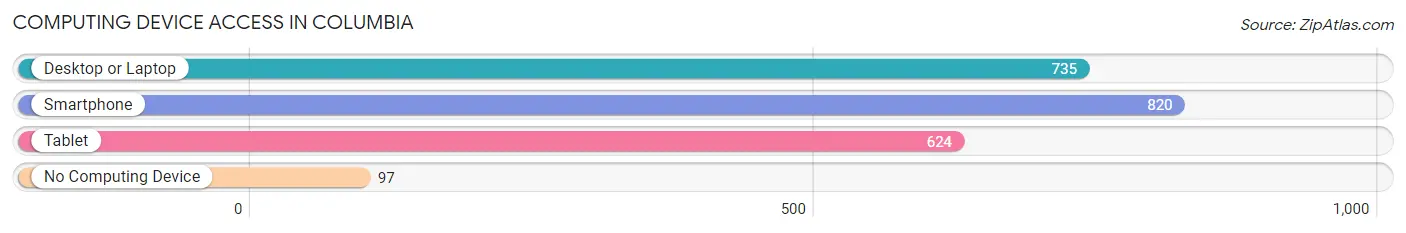
| Device Type | # Households | % Households |
| Desktop or Laptop | 735 | 71.2% |
| Smartphone | 820 | 79.4% |
| Tablet | 624 | 60.4% |
| No Computing Device | 97 | 9.4% |
| Total | 1,033 | 100.0% |
Internet Access in Columbia
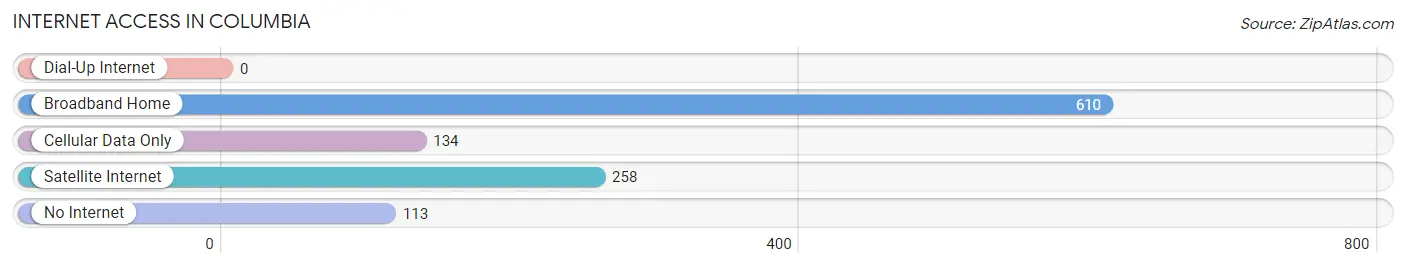
| Internet Type | # Households | % Households |
| Dial-Up Internet | 0 | 0.0% |
| Broadband Home | 610 | 59.1% |
| Cellular Data Only | 134 | 13.0% |
| Satellite Internet | 258 | 25.0% |
| No Internet | 113 | 10.9% |
| Total | 1,033 | 100.0% |
Columbia Summary
Columbia, California is a small, unincorporated community located in Tuolumne County, California. It is situated in the Sierra Nevada foothills, approximately 25 miles east of Sonora and 50 miles east of Modesto. The town is located at an elevation of 2,100 feet and has a population of approximately 2,000 people.
History
Columbia was founded in 1850 by a group of miners who were searching for gold in the area. The town was named after the Columbia River in Oregon, which was named after the ship Columbia Rediviva, which was the first American vessel to circumnavigate the globe. The town quickly grew to become a bustling mining town, with a population of over 10,000 people by the late 1850s.
The town was home to a variety of businesses, including a hotel, saloons, stores, and a theater. It was also home to a variety of churches, including the Methodist Episcopal Church, the Catholic Church, and the Congregational Church.
In 1854, the town was incorporated as a city and was the county seat of Tuolumne County. The town was home to a variety of businesses, including a newspaper, a bank, a brewery, and a variety of stores.
In 1858, the town was destroyed by a fire that started in a saloon. The fire destroyed most of the town, including the courthouse, the jail, and the post office. The town was rebuilt, but the population never returned to its pre-fire levels.
In the late 1800s, the town was home to a variety of industries, including a sawmill, a flour mill, and a tannery. The town was also home to a variety of mines, including the Columbia Mine, which was one of the largest gold mines in the area.
Geography
Columbia is located in the Sierra Nevada foothills, approximately 25 miles east of Sonora and 50 miles east of Modesto. The town is situated at an elevation of 2,100 feet and is surrounded by rolling hills and mountains. The town is located in a valley, which is surrounded by the Stanislaus National Forest.
The town is located in a temperate climate, with hot summers and mild winters. The average annual temperature is around 60 degrees Fahrenheit. The town receives an average of 20 inches of precipitation per year, with most of the precipitation occurring in the winter months.
Economy
The economy of Columbia is largely based on tourism and agriculture. The town is home to a variety of tourist attractions, including the Columbia State Historic Park, which is a preserved gold rush town. The park is home to a variety of historic buildings, including the Columbia Hotel, the Columbia Bank, and the Columbia Theater.
The town is also home to a variety of agricultural businesses, including wineries, apple orchards, and Christmas tree farms. The town is also home to a variety of small businesses, including restaurants, shops, and galleries.
Demographics
As of the 2010 census, the population of Columbia was 2,000 people. The racial makeup of the town was 94.2% White, 0.7% African American, 0.7% Native American, 0.7% Asian, 0.3% Pacific Islander, and 2.3% from other races. The median household income was $41,250, and the median family income was $50,000. The per capita income was $20,000.
Conclusion
Columbia, California is a small, unincorporated community located in Tuolumne County, California. It is situated in the Sierra Nevada foothills, approximately 25 miles east of Sonora and 50 miles east of Modesto. The town is located at an elevation of 2,100 feet and has a population of approximately 2,000 people. The economy of Columbia is largely based on tourism and agriculture, and the town is home to a variety of tourist attractions, including the Columbia State Historic Park. The racial makeup of the town is 94.2% White, 0.7% African American, 0.7% Native American, 0.7% Asian, 0.3% Pacific Islander, and 2.3% from other races. The median household income was $41,250, and the median family income was $50,000.
Common Questions
What is Per Capita Income in Columbia?
Per Capita income in Columbia is $35,409.
What is the Median Family Income in Columbia?
Median Family Income in Columbia is $71,563.
What is the Median Household income in Columbia?
Median Household Income in Columbia is $50,491.
What is Income or Wage Gap in Columbia?
Income or Wage Gap in Columbia is 59.3%.
Women in Columbia earn 40.7 cents for every dollar earned by a man.
What is Inequality or Gini Index in Columbia?
Inequality or Gini Index in Columbia is 0.49.
What is the Total Population of Columbia?
Total Population of Columbia is 2,439.
What is the Total Male Population of Columbia?
Total Male Population of Columbia is 1,132.
What is the Total Female Population of Columbia?
Total Female Population of Columbia is 1,307.
What is the Ratio of Males per 100 Females in Columbia?
There are 86.61 Males per 100 Females in Columbia.
What is the Ratio of Females per 100 Males in Columbia?
There are 115.46 Females per 100 Males in Columbia.
What is the Median Population Age in Columbia?
Median Population Age in Columbia is 45.8 Years.
What is the Average Family Size in Columbia
Average Family Size in Columbia is 2.8 People.
What is the Average Household Size in Columbia
Average Household Size in Columbia is 2.2 People.
How Large is the Labor Force in Columbia?
There are 1,094 People in the Labor Forcein in Columbia.
What is the Percentage of People in the Labor Force in Columbia?
54.1% of People are in the Labor Force in Columbia.
What is the Unemployment Rate in Columbia?
Unemployment Rate in Columbia is 8.3%.