Cities with the Highest Percentage of Eastern European Population in Oregon
RELATED REPORTS & OPTIONS
Eastern European
Oregon
Compare Cities
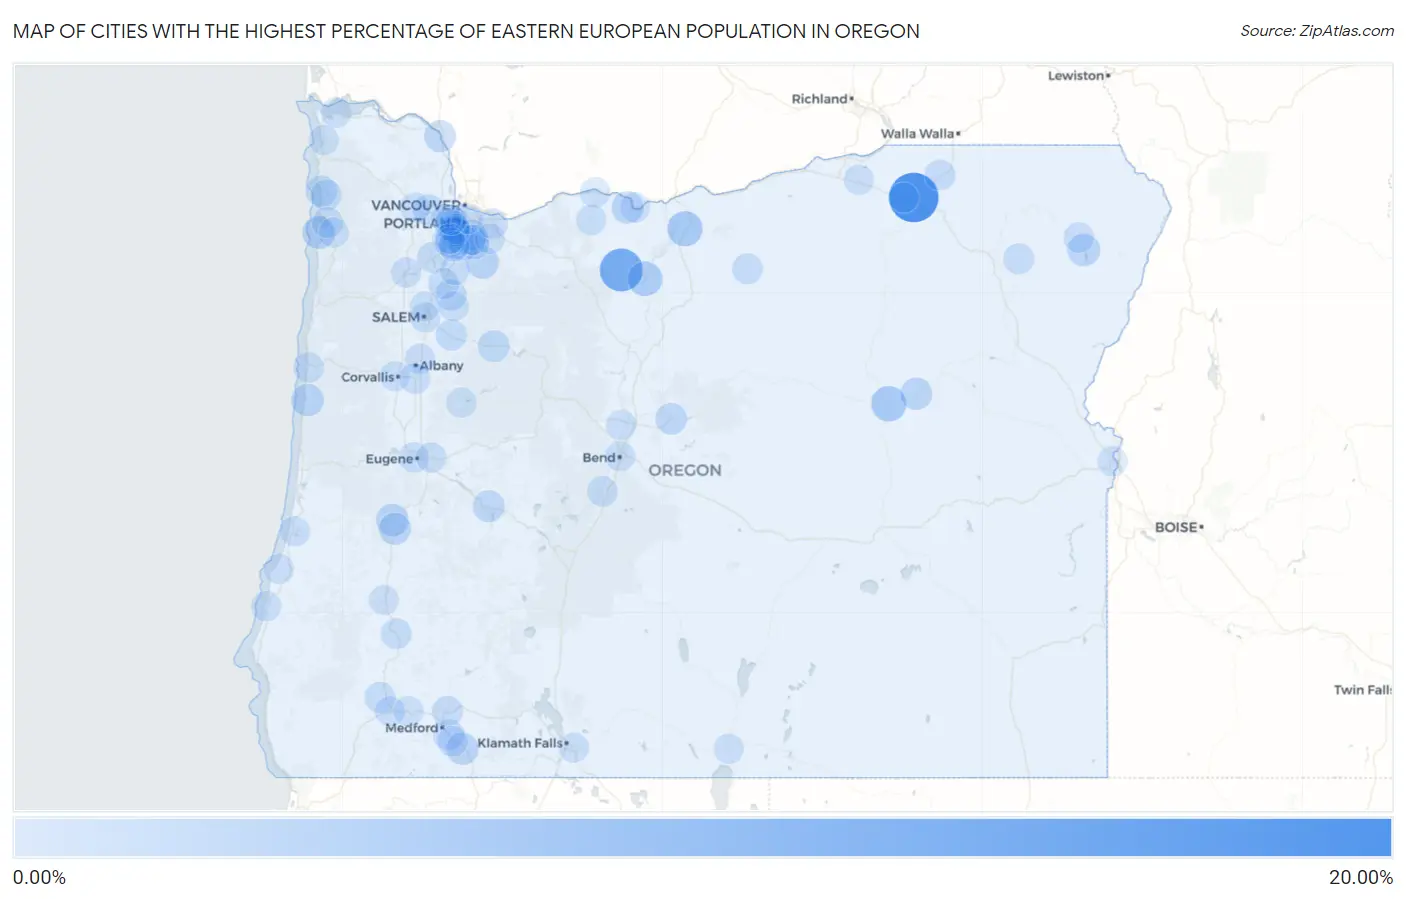
Map of Cities with the Highest Percentage of Eastern European Population in Oregon
0.00%
20.00%
Cities with the Highest Percentage of Eastern European Population in Oregon
| City | Eastern European | vs State | vs National | |
| 1. | Chemult | 17.71% | 0.38%(+17.3)#1 | 0.30%(+17.4)#23 |
| 2. | Riverside | 17.61% | 0.38%(+17.2)#2 | 0.30%(+17.3)#24 |
| 3. | Wamic | 11.54% | 0.38%(+11.2)#3 | 0.30%(+11.2)#40 |
| 4. | Canyon City | 4.68% | 0.38%(+4.30)#4 | 0.30%(+4.37)#180 |
| 5. | Moro | 4.66% | 0.38%(+4.28)#5 | 0.30%(+4.35)#181 |
| 6. | Maupin | 4.21% | 0.38%(+3.84)#6 | 0.30%(+3.91)#221 |
| 7. | Dilley | 4.10% | 0.38%(+3.72)#7 | 0.30%(+3.79)#232 |
| 8. | Neotsu | 3.84% | 0.38%(+3.46)#8 | 0.30%(+3.54)#258 |
| 9. | River Point | 3.42% | 0.38%(+3.04)#9 | 0.30%(+3.12)#313 |
| 10. | Cherry Grove | 2.86% | 0.38%(+2.49)#10 | 0.30%(+2.56)#403 |
| 11. | Dunthorpe | 2.77% | 0.38%(+2.40)#11 | 0.30%(+2.47)#416 |
| 12. | Oceanside | 2.54% | 0.38%(+2.17)#12 | 0.30%(+2.24)#476 |
| 13. | Joseph | 2.48% | 0.38%(+2.11)#13 | 0.30%(+2.18)#486 |
| 14. | Drain | 2.27% | 0.38%(+1.90)#14 | 0.30%(+1.97)#574 |
| 15. | Waldport | 2.26% | 0.38%(+1.88)#15 | 0.30%(+1.95)#586 |
| 16. | Beavercreek | 2.25% | 0.38%(+1.88)#16 | 0.30%(+1.95)#589 |
| 17. | Prairie City | 2.09% | 0.38%(+1.72)#17 | 0.30%(+1.79)#651 |
| 18. | Ashland | 2.08% | 0.38%(+1.71)#18 | 0.30%(+1.78)#658 |
| 19. | Yoncalla | 2.08% | 0.38%(+1.71)#19 | 0.30%(+1.78)#659 |
| 20. | Chenoweth | 1.98% | 0.38%(+1.60)#20 | 0.30%(+1.68)#707 |
| 21. | Oakridge | 1.81% | 0.38%(+1.43)#21 | 0.30%(+1.50)#809 |
| 22. | Metzger | 1.73% | 0.38%(+1.35)#22 | 0.30%(+1.43)#847 |
| 23. | Prescott | 1.67% | 0.38%(+1.29)#23 | 0.30%(+1.36)#885 |
| 24. | Prineville | 1.63% | 0.38%(+1.26)#24 | 0.30%(+1.33)#909 |
| 25. | Gates | 1.55% | 0.38%(+1.18)#25 | 0.30%(+1.25)#966 |
| 26. | Manzanita | 1.30% | 0.38%(+0.926)#26 | 0.30%(+0.997)#1,220 |
| 27. | Sublimity | 1.22% | 0.38%(+0.847)#27 | 0.30%(+0.919)#1,323 |
| 28. | North Plains | 1.16% | 0.38%(+0.784)#28 | 0.30%(+0.855)#1,412 |
| 29. | Mount Angel | 1.11% | 0.38%(+0.738)#29 | 0.30%(+0.810)#1,483 |
| 30. | Gladstone | 1.09% | 0.38%(+0.717)#30 | 0.30%(+0.788)#1,525 |
| 31. | Durham | 1.08% | 0.38%(+0.700)#31 | 0.30%(+0.772)#1,549 |
| 32. | Phoenix | 1.00% | 0.38%(+0.627)#32 | 0.30%(+0.699)#1,677 |
| 33. | Merlin | 0.99% | 0.38%(+0.617)#33 | 0.30%(+0.689)#1,696 |
| 34. | Stafford | 0.96% | 0.38%(+0.582)#34 | 0.30%(+0.654)#1,780 |
| 35. | White City | 0.95% | 0.38%(+0.578)#35 | 0.30%(+0.649)#1,786 |
| 36. | Milwaukie | 0.94% | 0.38%(+0.564)#36 | 0.30%(+0.635)#1,826 |
| 37. | Wheeler | 0.93% | 0.38%(+0.557)#37 | 0.30%(+0.629)#1,834 |
| 38. | West Haven Sylvan | 0.93% | 0.38%(+0.556)#38 | 0.30%(+0.627)#1,835 |
| 39. | Lake Oswego | 0.90% | 0.38%(+0.527)#39 | 0.30%(+0.598)#1,892 |
| 40. | Cove | 0.89% | 0.38%(+0.512)#40 | 0.30%(+0.584)#1,928 |
| 41. | Canyonville | 0.87% | 0.38%(+0.497)#41 | 0.30%(+0.569)#1,964 |
| 42. | Condon | 0.86% | 0.38%(+0.486)#42 | 0.30%(+0.557)#1,992 |
| 43. | Oak Grove | 0.85% | 0.38%(+0.475)#43 | 0.30%(+0.546)#2,022 |
| 44. | Newberg | 0.84% | 0.38%(+0.460)#44 | 0.30%(+0.532)#2,064 |
| 45. | Cedar Hills | 0.83% | 0.38%(+0.451)#45 | 0.30%(+0.523)#2,097 |
| 46. | West Slope | 0.83% | 0.38%(+0.450)#46 | 0.30%(+0.522)#2,100 |
| 47. | Athena | 0.83% | 0.38%(+0.450)#47 | 0.30%(+0.521)#2,101 |
| 48. | Bay City | 0.81% | 0.38%(+0.434)#48 | 0.30%(+0.506)#2,152 |
| 49. | Woodburn | 0.78% | 0.38%(+0.403)#49 | 0.30%(+0.474)#2,240 |
| 50. | Heceta Beach | 0.75% | 0.38%(+0.379)#50 | 0.30%(+0.450)#2,321 |
| 51. | Enterprise | 0.74% | 0.38%(+0.361)#51 | 0.30%(+0.433)#2,376 |
| 52. | Newport | 0.74% | 0.38%(+0.361)#52 | 0.30%(+0.433)#2,378 |
| 53. | Prineville Lake Acres | 0.71% | 0.38%(+0.336)#53 | 0.30%(+0.407)#2,466 |
| 54. | Three Rivers | 0.69% | 0.38%(+0.316)#54 | 0.30%(+0.387)#2,525 |
| 55. | Talent | 0.69% | 0.38%(+0.312)#55 | 0.30%(+0.384)#2,540 |
| 56. | Garden Home Whitford | 0.62% | 0.38%(+0.246)#56 | 0.30%(+0.317)#2,796 |
| 57. | Mcminnville | 0.60% | 0.38%(+0.223)#57 | 0.30%(+0.295)#2,889 |
| 58. | Eugene | 0.60% | 0.38%(+0.221)#58 | 0.30%(+0.293)#2,897 |
| 59. | Oatfield | 0.57% | 0.38%(+0.198)#59 | 0.30%(+0.270)#2,992 |
| 60. | Millersburg | 0.57% | 0.38%(+0.198)#60 | 0.30%(+0.270)#2,994 |
| 61. | River Road | 0.56% | 0.38%(+0.190)#61 | 0.30%(+0.261)#3,021 |
| 62. | Portland | 0.55% | 0.38%(+0.178)#62 | 0.30%(+0.249)#3,080 |
| 63. | Bull Mountain | 0.49% | 0.38%(+0.118)#63 | 0.30%(+0.190)#3,368 |
| 64. | Mount Hood | 0.49% | 0.38%(+0.118)#64 | 0.30%(+0.190)#3,370 |
| 65. | Tangent | 0.46% | 0.38%(+0.087)#65 | 0.30%(+0.158)#3,562 |
| 66. | Raleigh Hills | 0.46% | 0.38%(+0.085)#66 | 0.30%(+0.156)#3,573 |
| 67. | Springfield | 0.45% | 0.38%(+0.073)#67 | 0.30%(+0.145)#3,637 |
| 68. | Oak Hills | 0.43% | 0.38%(+0.058)#68 | 0.30%(+0.129)#3,721 |
| 69. | Astoria | 0.43% | 0.38%(+0.057)#69 | 0.30%(+0.128)#3,725 |
| 70. | Corvallis | 0.42% | 0.38%(+0.048)#70 | 0.30%(+0.119)#3,778 |
| 71. | Eagle Crest | 0.42% | 0.38%(+0.048)#71 | 0.30%(+0.119)#3,779 |
| 72. | Bandon | 0.42% | 0.38%(+0.047)#72 | 0.30%(+0.118)#3,786 |
| 73. | Sweet Home | 0.42% | 0.38%(+0.041)#73 | 0.30%(+0.112)#3,830 |
| 74. | Ontario | 0.41% | 0.38%(+0.038)#74 | 0.30%(+0.110)#3,847 |
| 75. | Salem | 0.41% | 0.38%(+0.036)#75 | 0.30%(+0.107)#3,865 |
| 76. | The Dalles | 0.40% | 0.38%(+0.025)#76 | 0.30%(+0.097)#3,948 |
| 77. | Lakeside | 0.38% | 0.38%(+0.006)#77 | 0.30%(+0.077)#4,105 |
| 78. | Aurora | 0.38% | 0.38%(+0.004)#78 | 0.30%(+0.075)#4,117 |
| 79. | Keizer | 0.38% | 0.38%(+0.003)#79 | 0.30%(+0.075)#4,120 |
| 80. | Bend | 0.38% | 0.38%(+0.003)#80 | 0.30%(+0.074)#4,123 |
| 81. | Stanfield | 0.38% | 0.38%(+0.001)#81 | 0.30%(+0.072)#4,140 |
| 82. | Silverton | 0.37% | 0.38%(-0.002)#82 | 0.30%(+0.070)#4,165 |
| 83. | Hood River | 0.36% | 0.38%(-0.013)#83 | 0.30%(+0.058)#4,249 |
| 84. | Damascus | 0.36% | 0.38%(-0.015)#84 | 0.30%(+0.056)#4,269 |
| 85. | Rogue River | 0.35% | 0.38%(-0.025)#85 | 0.30%(+0.047)#4,348 |
| 86. | Barview | 0.35% | 0.38%(-0.028)#86 | 0.30%(+0.044)#4,374 |
| 87. | Gresham | 0.34% | 0.38%(-0.031)#87 | 0.30%(+0.041)#4,401 |
| 88. | Green | 0.34% | 0.38%(-0.032)#88 | 0.30%(+0.040)#4,410 |
| 89. | Santa Clara | 0.34% | 0.38%(-0.032)#89 | 0.30%(+0.039)#4,416 |
| 90. | Banks | 0.34% | 0.38%(-0.033)#90 | 0.30%(+0.038)#4,422 |
| 91. | Grants Pass | 0.34% | 0.38%(-0.035)#91 | 0.30%(+0.036)#4,444 |
| 92. | Gearhart | 0.34% | 0.38%(-0.035)#92 | 0.30%(+0.036)#4,445 |
| 93. | Lakeview | 0.34% | 0.38%(-0.036)#93 | 0.30%(+0.036)#4,448 |
| 94. | King City | 0.34% | 0.38%(-0.039)#94 | 0.30%(+0.032)#4,484 |
| 95. | Altamont | 0.33% | 0.38%(-0.041)#95 | 0.30%(+0.031)#4,499 |
| 96. | Tillamook | 0.33% | 0.38%(-0.049)#96 | 0.30%(+0.022)#4,597 |
| 97. | Tualatin | 0.32% | 0.38%(-0.052)#97 | 0.30%(+0.020)#4,611 |
| 98. | Tigard | 0.32% | 0.38%(-0.054)#98 | 0.30%(+0.017)#4,634 |
| 99. | Cedar Mill | 0.32% | 0.38%(-0.057)#99 | 0.30%(+0.015)#4,661 |
| 100. | Pendleton | 0.32% | 0.38%(-0.058)#100 | 0.30%(+0.014)#4,669 |
Common Questions
What are the Top 10 Cities with the Highest Percentage of Eastern European Population in Oregon?
Top 10 Cities with the Highest Percentage of Eastern European Population in Oregon are:
#1
17.61%
#2
11.54%
#3
4.68%
#4
4.66%
#5
4.21%
#6
2.54%
#7
2.48%
#8
2.27%
#9
2.26%
#10
2.25%
What city has the Highest Percentage of Eastern European Population in Oregon?
Riverside has the Highest Percentage of Eastern European Population in Oregon with 17.61%.
What is the Percentage of Eastern European Population in the State of Oregon?
Percentage of Eastern European Population in Oregon is 0.38%.
What is the Percentage of Eastern European Population in the United States?
Percentage of Eastern European Population in the United States is 0.30%.