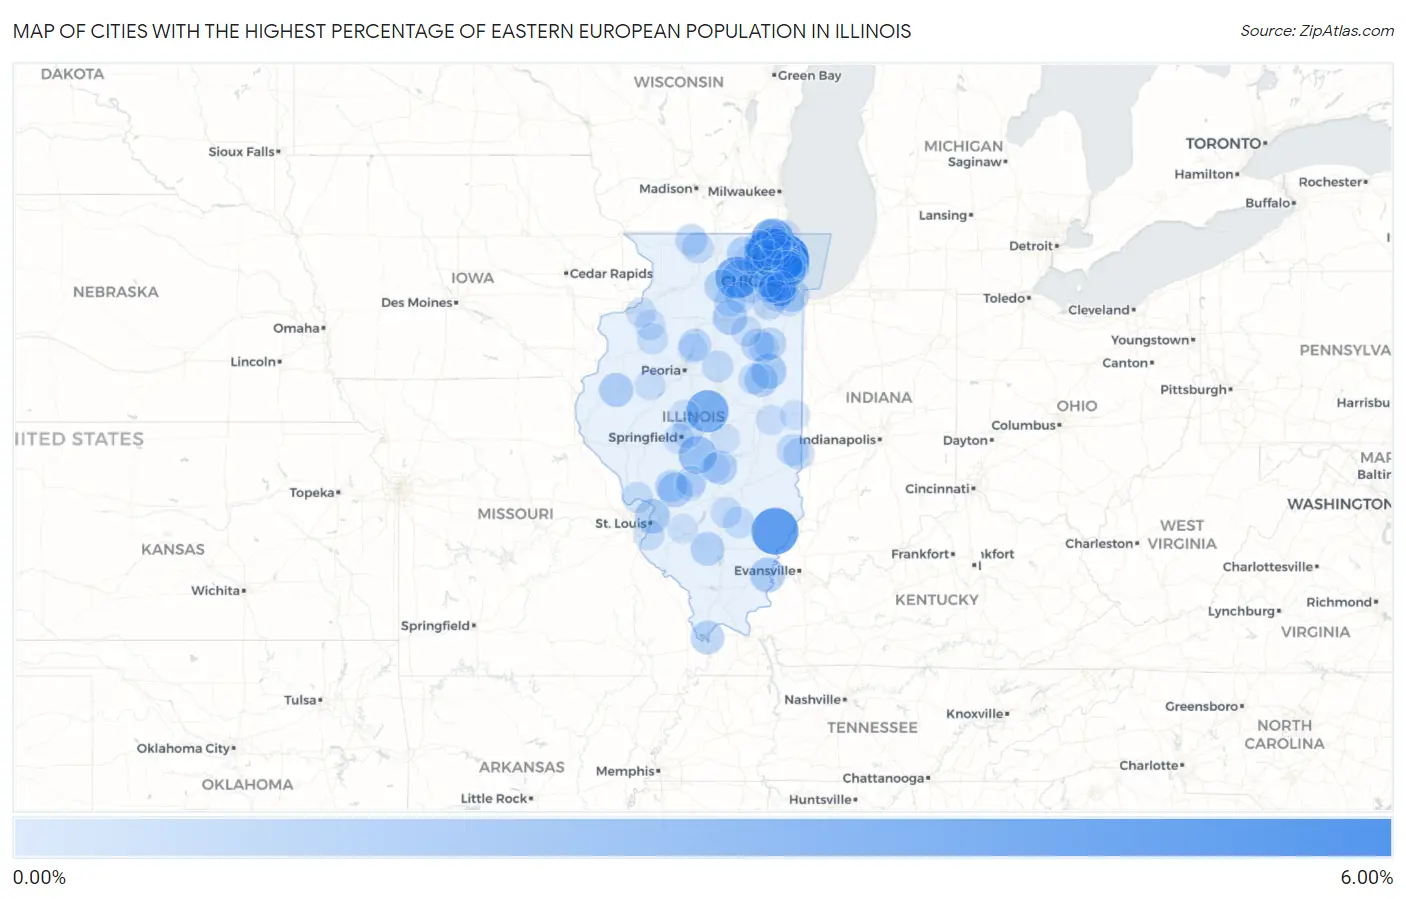
Cities with the Highest Percentage of Eastern European Population in Illinois
RELATED REPORTS & OPTIONS
Eastern European
Illinois
Compare Cities
Map of Cities with the Highest Percentage of Eastern European Population in Illinois
0.00%
6.00%
Cities with the Highest Percentage of Eastern European Population in Illinois
| City | Eastern European | vs State | vs National | |
| 1. | Deerfield | 5.83% | 0.33%(+5.50)#1 | 0.30%(+5.53)#108 |
| 2. | Hawthorn Woods | 5.39% | 0.33%(+5.06)#2 | 0.30%(+5.09)#128 |
| 3. | West Salem | 5.07% | 0.33%(+4.74)#3 | 0.30%(+4.77)#151 |
| 4. | Highland Park | 4.70% | 0.33%(+4.37)#4 | 0.30%(+4.40)#179 |
| 5. | Tower Lakes | 4.13% | 0.33%(+3.80)#5 | 0.30%(+3.83)#226 |
| 6. | Riverwoods | 4.02% | 0.33%(+3.69)#6 | 0.30%(+3.71)#240 |
| 7. | Venetian Village | 4.00% | 0.33%(+3.67)#7 | 0.30%(+3.70)#241 |
| 8. | Beason | 3.82% | 0.33%(+3.49)#8 | 0.30%(+3.52)#259 |
| 9. | Northbrook | 3.80% | 0.33%(+3.47)#9 | 0.30%(+3.50)#260 |
| 10. | Ridgefield | 3.68% | 0.33%(+3.35)#10 | 0.30%(+3.38)#275 |
| 11. | Cortland | 3.65% | 0.33%(+3.32)#11 | 0.30%(+3.35)#278 |
| 12. | Glencoe | 3.55% | 0.33%(+3.22)#12 | 0.30%(+3.25)#293 |
| 13. | Clarendon Hills | 3.00% | 0.33%(+2.67)#13 | 0.30%(+2.70)#374 |
| 14. | Langleyville | 2.63% | 0.33%(+2.30)#14 | 0.30%(+2.33)#453 |
| 15. | Maple Park | 2.63% | 0.33%(+2.30)#15 | 0.30%(+2.33)#454 |
| 16. | Lincolnshire | 2.09% | 0.33%(+1.76)#16 | 0.30%(+1.78)#654 |
| 17. | Buffalo Grove | 1.97% | 0.33%(+1.64)#17 | 0.30%(+1.66)#715 |
| 18. | Thawville | 1.94% | 0.33%(+1.61)#18 | 0.30%(+1.64)#741 |
| 19. | New Haven | 1.86% | 0.33%(+1.53)#19 | 0.30%(+1.55)#783 |
| 20. | Madison | 1.83% | 0.33%(+1.50)#20 | 0.30%(+1.53)#798 |
| 21. | Dayton | 1.81% | 0.33%(+1.48)#21 | 0.30%(+1.50)#810 |
| 22. | White City | 1.77% | 0.33%(+1.44)#22 | 0.30%(+1.47)#830 |
| 23. | Indian Head Park | 1.77% | 0.33%(+1.44)#23 | 0.30%(+1.46)#834 |
| 24. | Colchester | 1.70% | 0.33%(+1.37)#24 | 0.30%(+1.39)#862 |
| 25. | Tower Hill | 1.64% | 0.33%(+1.31)#25 | 0.30%(+1.34)#905 |
| 26. | Union | 1.58% | 0.33%(+1.25)#26 | 0.30%(+1.28)#945 |
| 27. | Evanston | 1.58% | 0.33%(+1.25)#27 | 0.30%(+1.28)#948 |
| 28. | Melvin | 1.57% | 0.33%(+1.24)#28 | 0.30%(+1.27)#954 |
| 29. | Skokie | 1.54% | 0.33%(+1.21)#29 | 0.30%(+1.24)#980 |
| 30. | Lee | 1.54% | 0.33%(+1.21)#30 | 0.30%(+1.23)#984 |
| 31. | Radom | 1.54% | 0.33%(+1.21)#31 | 0.30%(+1.23)#986 |
| 32. | Lake Forest | 1.54% | 0.33%(+1.21)#32 | 0.30%(+1.23)#987 |
| 33. | Rolling Meadows | 1.54% | 0.33%(+1.21)#33 | 0.30%(+1.23)#988 |
| 34. | Cairo | 1.52% | 0.33%(+1.19)#34 | 0.30%(+1.22)#1,002 |
| 35. | Merrionette Park | 1.49% | 0.33%(+1.16)#35 | 0.30%(+1.19)#1,028 |
| 36. | Green Oaks | 1.37% | 0.33%(+1.04)#36 | 0.30%(+1.06)#1,141 |
| 37. | Campus | 1.28% | 0.33%(+0.952)#37 | 0.30%(+0.978)#1,245 |
| 38. | Lacon | 1.25% | 0.33%(+0.925)#38 | 0.30%(+0.951)#1,274 |
| 39. | South Barrington | 1.24% | 0.33%(+0.910)#39 | 0.30%(+0.936)#1,298 |
| 40. | Gillespie | 1.22% | 0.33%(+0.892)#40 | 0.30%(+0.918)#1,326 |
| 41. | Burr Ridge | 1.21% | 0.33%(+0.883)#41 | 0.30%(+0.909)#1,344 |
| 42. | Herscher | 1.20% | 0.33%(+0.867)#42 | 0.30%(+0.893)#1,366 |
| 43. | Rock City | 1.18% | 0.33%(+0.854)#43 | 0.30%(+0.880)#1,378 |
| 44. | East Dundee | 1.17% | 0.33%(+0.842)#44 | 0.30%(+0.868)#1,391 |
| 45. | Long Grove | 1.16% | 0.33%(+0.830)#45 | 0.30%(+0.856)#1,410 |
| 46. | Vernon Hills | 1.16% | 0.33%(+0.825)#46 | 0.30%(+0.851)#1,419 |
| 47. | Glenview | 1.14% | 0.33%(+0.814)#47 | 0.30%(+0.840)#1,431 |
| 48. | La Grange Park | 1.12% | 0.33%(+0.788)#48 | 0.30%(+0.814)#1,470 |
| 49. | Crest Hill | 1.10% | 0.33%(+0.771)#49 | 0.30%(+0.798)#1,501 |
| 50. | Wilmette | 1.06% | 0.33%(+0.735)#50 | 0.30%(+0.761)#1,569 |
| 51. | Paris | 1.06% | 0.33%(+0.726)#51 | 0.30%(+0.753)#1,584 |
| 52. | Westmont | 1.05% | 0.33%(+0.721)#52 | 0.30%(+0.747)#1,589 |
| 53. | Pecatonica | 1.03% | 0.33%(+0.698)#53 | 0.30%(+0.724)#1,632 |
| 54. | Grandwood Park | 1.02% | 0.33%(+0.690)#54 | 0.30%(+0.716)#1,640 |
| 55. | El Paso | 1.02% | 0.33%(+0.686)#55 | 0.30%(+0.712)#1,648 |
| 56. | Vermilion | 1.02% | 0.33%(+0.685)#56 | 0.30%(+0.711)#1,652 |
| 57. | Lisle | 0.99% | 0.33%(+0.657)#57 | 0.30%(+0.684)#1,707 |
| 58. | Winnetka | 0.97% | 0.33%(+0.638)#58 | 0.30%(+0.664)#1,759 |
| 59. | Lincolnwood | 0.96% | 0.33%(+0.627)#59 | 0.30%(+0.653)#1,781 |
| 60. | Prestbury | 0.95% | 0.33%(+0.622)#60 | 0.30%(+0.649)#1,789 |
| 61. | Leland | 0.95% | 0.33%(+0.622)#61 | 0.30%(+0.648)#1,792 |
| 62. | Xenia | 0.93% | 0.33%(+0.599)#62 | 0.30%(+0.625)#1,841 |
| 63. | Kinmundy | 0.92% | 0.33%(+0.585)#63 | 0.30%(+0.612)#1,866 |
| 64. | Sibley | 0.90% | 0.33%(+0.571)#64 | 0.30%(+0.597)#1,895 |
| 65. | Altona | 0.89% | 0.33%(+0.560)#65 | 0.30%(+0.586)#1,924 |
| 66. | Grafton | 0.88% | 0.33%(+0.547)#66 | 0.30%(+0.573)#1,947 |
| 67. | Columbia | 0.87% | 0.33%(+0.540)#67 | 0.30%(+0.566)#1,972 |
| 68. | Northfield | 0.86% | 0.33%(+0.529)#68 | 0.30%(+0.555)#2,000 |
| 69. | Spaulding | 0.83% | 0.33%(+0.499)#69 | 0.30%(+0.525)#2,083 |
| 70. | Sandwich | 0.83% | 0.33%(+0.497)#70 | 0.30%(+0.523)#2,092 |
| 71. | Cabery | 0.83% | 0.33%(+0.497)#71 | 0.30%(+0.523)#2,094 |
| 72. | Cambridge | 0.80% | 0.33%(+0.470)#72 | 0.30%(+0.496)#2,178 |
| 73. | Hillsboro | 0.79% | 0.33%(+0.463)#73 | 0.30%(+0.489)#2,192 |
| 74. | Middletown | 0.79% | 0.33%(+0.457)#74 | 0.30%(+0.484)#2,213 |
| 75. | Cuba | 0.78% | 0.33%(+0.445)#75 | 0.30%(+0.471)#2,247 |
| 76. | Barrington | 0.77% | 0.33%(+0.444)#76 | 0.30%(+0.470)#2,251 |
| 77. | Verona | 0.77% | 0.33%(+0.442)#77 | 0.30%(+0.468)#2,259 |
| 78. | North Barrington | 0.77% | 0.33%(+0.440)#78 | 0.30%(+0.466)#2,268 |
| 79. | Lemont | 0.77% | 0.33%(+0.439)#79 | 0.30%(+0.465)#2,271 |
| 80. | Libertyville | 0.76% | 0.33%(+0.434)#80 | 0.30%(+0.460)#2,287 |
| 81. | Lake Barrington | 0.76% | 0.33%(+0.433)#81 | 0.30%(+0.459)#2,295 |
| 82. | Leland Grove | 0.74% | 0.33%(+0.414)#82 | 0.30%(+0.441)#2,352 |
| 83. | Golf | 0.73% | 0.33%(+0.403)#83 | 0.30%(+0.429)#2,391 |
| 84. | Sidney | 0.71% | 0.33%(+0.384)#84 | 0.30%(+0.411)#2,456 |
| 85. | Huntley | 0.71% | 0.33%(+0.383)#85 | 0.30%(+0.409)#2,464 |
| 86. | Winthrop Harbor | 0.70% | 0.33%(+0.372)#86 | 0.30%(+0.398)#2,488 |
| 87. | Gages Lake | 0.70% | 0.33%(+0.368)#87 | 0.30%(+0.394)#2,502 |
| 88. | Oak Forest | 0.69% | 0.33%(+0.361)#88 | 0.30%(+0.387)#2,524 |
| 89. | Colona | 0.68% | 0.33%(+0.355)#89 | 0.30%(+0.381)#2,545 |
| 90. | Downers Grove | 0.66% | 0.33%(+0.334)#90 | 0.30%(+0.360)#2,613 |
| 91. | Pana | 0.64% | 0.33%(+0.309)#91 | 0.30%(+0.335)#2,707 |
| 92. | Tilton | 0.63% | 0.33%(+0.301)#92 | 0.30%(+0.327)#2,741 |
| 93. | Hopewell | 0.63% | 0.33%(+0.299)#93 | 0.30%(+0.325)#2,757 |
| 94. | Antioch | 0.63% | 0.33%(+0.295)#94 | 0.30%(+0.322)#2,770 |
| 95. | Wheaton | 0.62% | 0.33%(+0.294)#95 | 0.30%(+0.320)#2,778 |
| 96. | Mchenry | 0.62% | 0.33%(+0.292)#96 | 0.30%(+0.318)#2,785 |
| 97. | Albers | 0.62% | 0.33%(+0.292)#97 | 0.30%(+0.318)#2,789 |
| 98. | Western Springs | 0.62% | 0.33%(+0.290)#98 | 0.30%(+0.316)#2,799 |
| 99. | Mount Zion | 0.61% | 0.33%(+0.278)#99 | 0.30%(+0.304)#2,849 |
| 100. | Taylor Springs | 0.60% | 0.33%(+0.273)#100 | 0.30%(+0.300)#2,868 |
Common Questions
What are the Top 10 Cities with the Highest Percentage of Eastern European Population in Illinois?
Top 10 Cities with the Highest Percentage of Eastern European Population in Illinois are:
#1
5.83%
#2
5.39%
#3
5.07%
#4
4.70%
#5
4.13%
#6
4.02%
#7
4.00%
#8
3.82%
#9
3.80%
#10
3.65%
What city has the Highest Percentage of Eastern European Population in Illinois?
Deerfield has the Highest Percentage of Eastern European Population in Illinois with 5.83%.
What is the Percentage of Eastern European Population in the State of Illinois?
Percentage of Eastern European Population in Illinois is 0.33%.
What is the Percentage of Eastern European Population in the United States?
Percentage of Eastern European Population in the United States is 0.30%.