Eureka, CA Map & Demographics
Eureka Map
Eureka Overview
$33,270
PER CAPITA INCOME
$72,199
AVG FAMILY INCOME
$51,971
AVG HOUSEHOLD INCOME
14.7%
WAGE / INCOME GAP [ % ]
85.3¢/ $1
WAGE / INCOME GAP [ $ ]
$12,330
FAMILY INCOME DEFICIT
0.48
INEQUALITY / GINI INDEX
26,519
TOTAL POPULATION
13,310
MALE POPULATION
13,209
FEMALE POPULATION
100.76
MALES / 100 FEMALES
99.24
FEMALES / 100 MALES
39.8
MEDIAN AGE
3.0
AVG FAMILY SIZE
2.3
AVG HOUSEHOLD SIZE
13,747
LABOR FORCE [ PEOPLE ]
61.5%
PERCENT IN LABOR FORCE
10.1%
UNEMPLOYMENT RATE
Eureka Area Codes
Income in Eureka
Income Overview in Eureka
Per Capita Income in Eureka is $33,270, while median incomes of families and households are $72,199 and $51,971 respectively.
| Characteristic | Number | Measure |
| Per Capita Income | 26,519 | $33,270 |
| Median Family Income | 5,440 | $72,199 |
| Mean Family Income | 5,440 | $94,960 |
| Median Household Income | 10,905 | $51,971 |
| Mean Household Income | 10,905 | $76,887 |
| Income Deficit | 5,440 | $12,330 |
| Wage / Income Gap (%) | 26,519 | 14.69% |
| Wage / Income Gap ($) | 26,519 | 85.31¢ per $1 |
| Gini / Inequality Index | 26,519 | 0.48 |
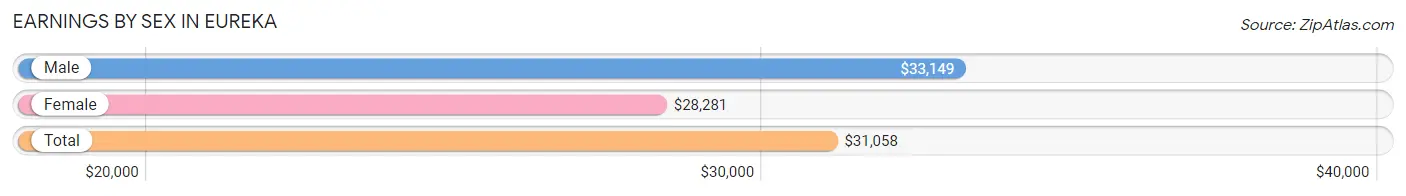
Earnings by Sex in Eureka
Average Earnings in Eureka are $31,058, $33,149 for men and $28,281 for women, a difference of 14.7%.
| Sex | Number | Average Earnings |
| Male | 6,987 (49.7%) | $33,149 |
| Female | 7,057 (50.2%) | $28,281 |
| Total | 14,044 (100.0%) | $31,058 |
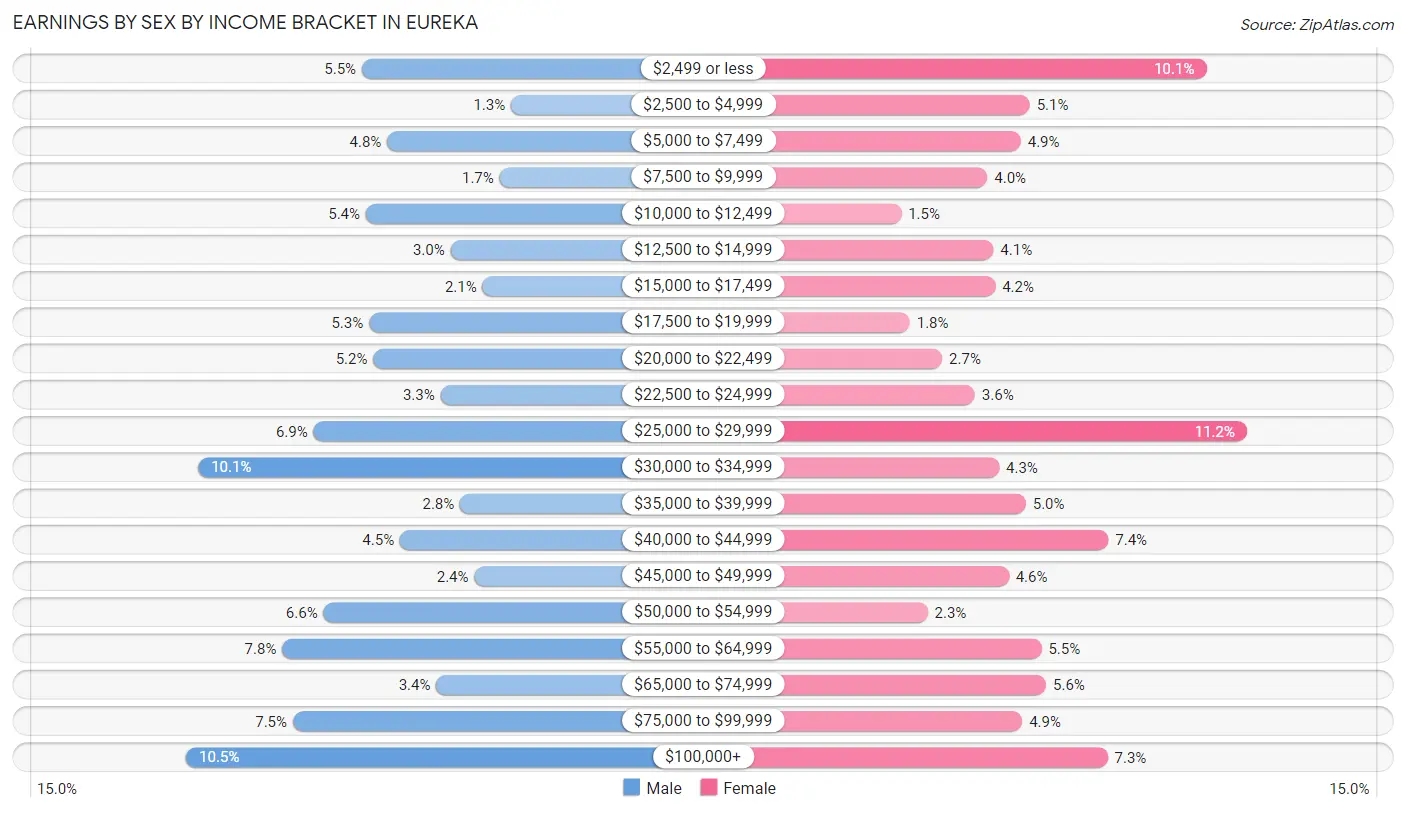
Earnings by Sex by Income Bracket in Eureka
The most common earnings brackets in Eureka are $100,000+ for men (731 | 10.5%) and $25,000 to $29,999 for women (793 | 11.2%).
| Income | Male | Female |
| $2,499 or less | 386 (5.5%) | 713 (10.1%) |
| $2,500 to $4,999 | 93 (1.3%) | 363 (5.1%) |
| $5,000 to $7,499 | 336 (4.8%) | 345 (4.9%) |
| $7,500 to $9,999 | 115 (1.7%) | 279 (4.0%) |
| $10,000 to $12,499 | 378 (5.4%) | 108 (1.5%) |
| $12,500 to $14,999 | 212 (3.0%) | 291 (4.1%) |
| $15,000 to $17,499 | 149 (2.1%) | 294 (4.2%) |
| $17,500 to $19,999 | 372 (5.3%) | 125 (1.8%) |
| $20,000 to $22,499 | 363 (5.2%) | 189 (2.7%) |
| $22,500 to $24,999 | 231 (3.3%) | 254 (3.6%) |
| $25,000 to $29,999 | 481 (6.9%) | 793 (11.2%) |
| $30,000 to $34,999 | 707 (10.1%) | 302 (4.3%) |
| $35,000 to $39,999 | 193 (2.8%) | 355 (5.0%) |
| $40,000 to $44,999 | 311 (4.4%) | 519 (7.3%) |
| $45,000 to $49,999 | 165 (2.4%) | 321 (4.5%) |
| $50,000 to $54,999 | 461 (6.6%) | 160 (2.3%) |
| $55,000 to $64,999 | 542 (7.8%) | 386 (5.5%) |
| $65,000 to $74,999 | 240 (3.4%) | 395 (5.6%) |
| $75,000 to $99,999 | 521 (7.5%) | 348 (4.9%) |
| $100,000+ | 731 (10.5%) | 517 (7.3%) |
| Total | 6,987 (100.0%) | 7,057 (100.0%) |
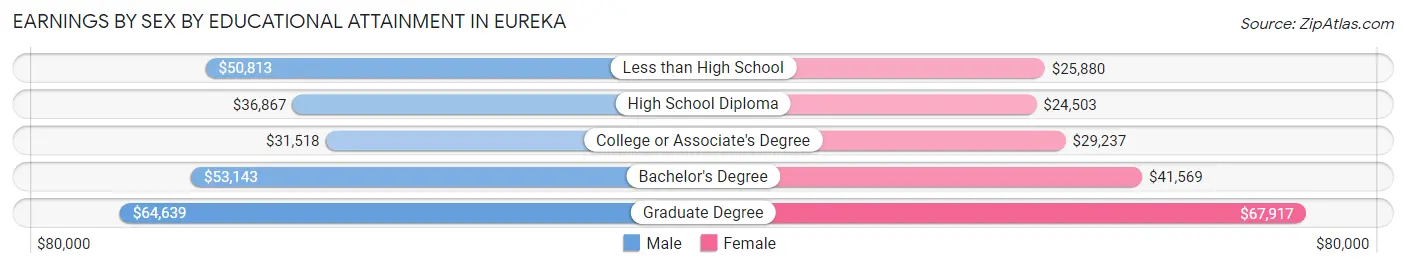
Earnings by Sex by Educational Attainment in Eureka
Average earnings in Eureka are $36,818 for men and $34,043 for women, a difference of 7.5%. Men with an educational attainment of graduate degree enjoy the highest average annual earnings of $64,639, while those with college or associate's degree education earn the least with $31,518. Women with an educational attainment of graduate degree earn the most with the average annual earnings of $67,917, while those with high school diploma education have the smallest earnings of $24,503.
| Educational Attainment | Male Income | Female Income |
| Less than High School | $50,813 | $25,880 |
| High School Diploma | $36,867 | $24,503 |
| College or Associate's Degree | $31,518 | $29,237 |
| Bachelor's Degree | $53,143 | $41,569 |
| Graduate Degree | $64,639 | $67,917 |
| Total | $36,818 | $34,043 |
Family Income in Eureka
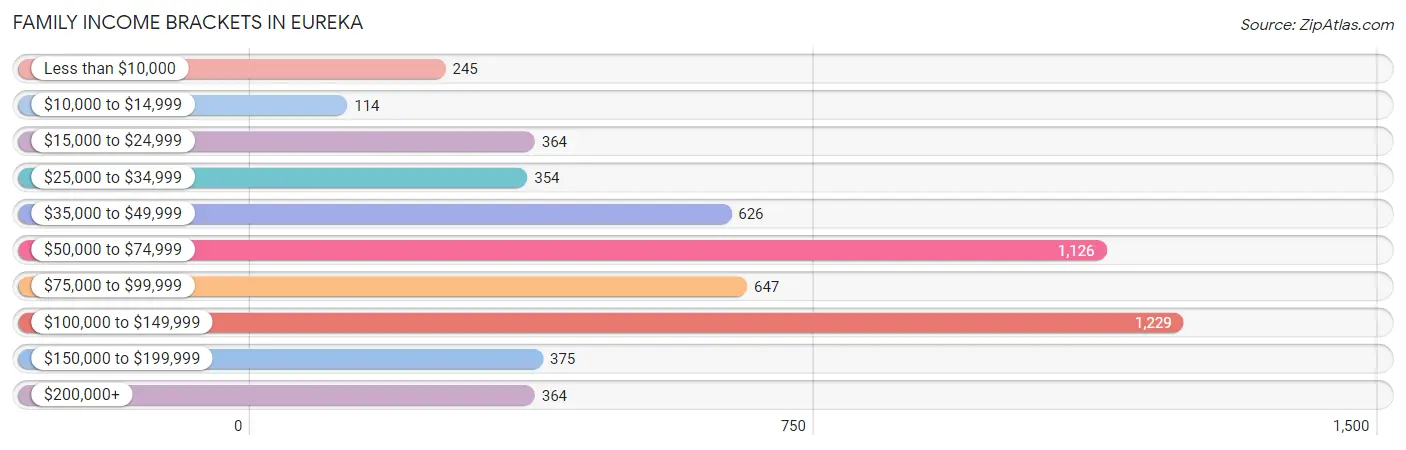
Family Income Brackets in Eureka
According to the Eureka family income data, there are 1,229 families falling into the $100,000 to $149,999 income range, which is the most common income bracket and makes up 22.6% of all families. Conversely, the $10,000 to $14,999 income bracket is the least frequent group with only 114 families (2.1%) belonging to this category.
| Income Bracket | # Families | % Families |
| Less than $10,000 | 245 | 4.5% |
| $10,000 to $14,999 | 114 | 2.1% |
| $15,000 to $24,999 | 364 | 6.7% |
| $25,000 to $34,999 | 354 | 6.5% |
| $35,000 to $49,999 | 626 | 11.5% |
| $50,000 to $74,999 | 1,126 | 20.7% |
| $75,000 to $99,999 | 647 | 11.9% |
| $100,000 to $149,999 | 1,229 | 22.6% |
| $150,000 to $199,999 | 375 | 6.9% |
| $200,000+ | 364 | 6.7% |
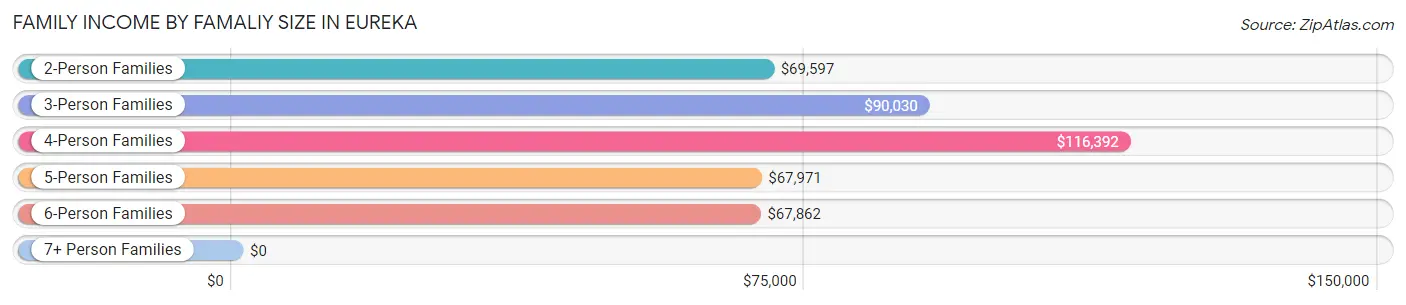
Family Income by Famaliy Size in Eureka
4-person families (835 | 15.3%) account for the highest median family income in Eureka with $116,392 per family, while 2-person families (2,952 | 54.3%) have the highest median income of $34,798 per family member.
| Income Bracket | # Families | Median Income |
| 2-Person Families | 2,952 (54.3%) | $69,597 |
| 3-Person Families | 1,102 (20.3%) | $90,030 |
| 4-Person Families | 835 (15.3%) | $116,392 |
| 5-Person Families | 307 (5.6%) | $67,971 |
| 6-Person Families | 175 (3.2%) | $67,862 |
| 7+ Person Families | 69 (1.3%) | $0 |
| Total | 5,440 (100.0%) | $72,199 |
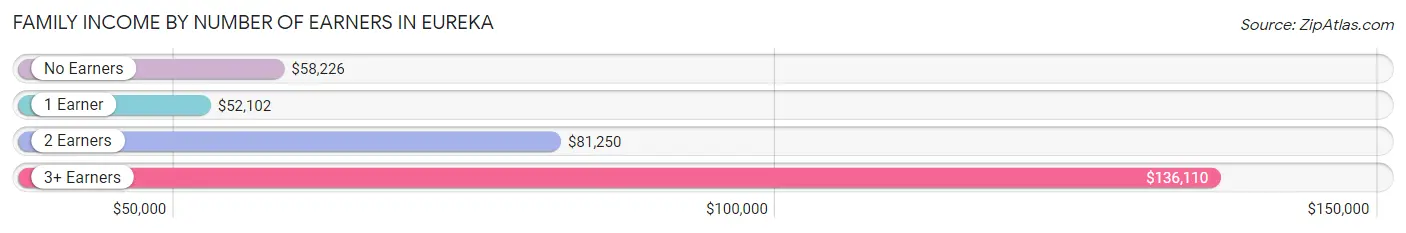
Family Income by Number of Earners in Eureka
The median family income in Eureka is $72,199, with families comprising 3+ earners (595) having the highest median family income of $136,110, while families with 1 earner (1,685) have the lowest median family income of $52,102, accounting for 10.9% and 31.0% of families, respectively.
| Number of Earners | # Families | Median Income |
| No Earners | 1,218 (22.4%) | $58,226 |
| 1 Earner | 1,685 (31.0%) | $52,102 |
| 2 Earners | 1,942 (35.7%) | $81,250 |
| 3+ Earners | 595 (10.9%) | $136,110 |
| Total | 5,440 (100.0%) | $72,199 |
Household Income in Eureka
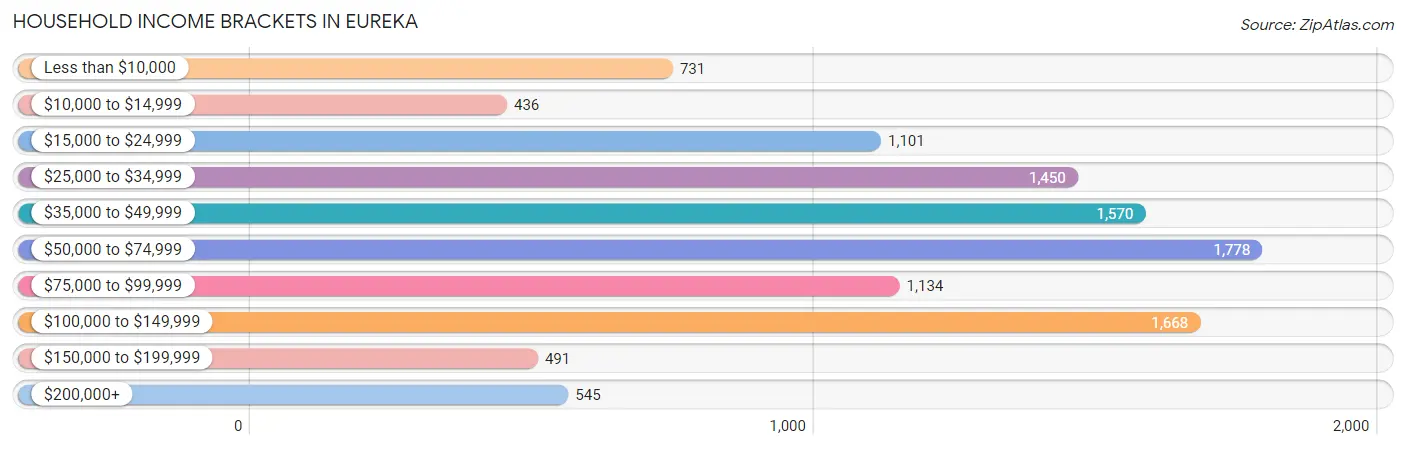
Household Income Brackets in Eureka
With 1,778 households falling in the category, the $50,000 to $74,999 income range is the most frequent in Eureka, accounting for 16.3% of all households. In contrast, only 436 households (4.0%) fall into the $10,000 to $14,999 income bracket, making it the least populous group.
| Income Bracket | # Households | % Households |
| Less than $10,000 | 731 | 6.7% |
| $10,000 to $14,999 | 436 | 4.0% |
| $15,000 to $24,999 | 1,101 | 10.1% |
| $25,000 to $34,999 | 1,450 | 13.3% |
| $35,000 to $49,999 | 1,570 | 14.4% |
| $50,000 to $74,999 | 1,778 | 16.3% |
| $75,000 to $99,999 | 1,134 | 10.4% |
| $100,000 to $149,999 | 1,668 | 15.3% |
| $150,000 to $199,999 | 491 | 4.5% |
| $200,000+ | 545 | 5.0% |
Household Income by Householder Age in Eureka
The median household income in Eureka is $51,971, with the highest median household income of $56,828 found in the 45 to 64 years age bracket for the primary householder. A total of 3,610 households (33.1%) fall into this category. Meanwhile, the 15 to 24 years age bracket for the primary householder has the lowest median household income of $23,577, with 553 households (5.1%) in this group.
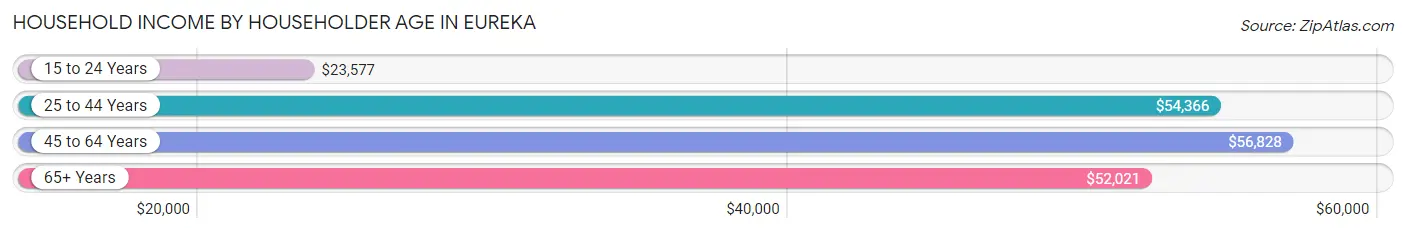
| Income Bracket | # Households | Median Income |
| 15 to 24 Years | 553 (5.1%) | $23,577 |
| 25 to 44 Years | 3,739 (34.3%) | $54,366 |
| 45 to 64 Years | 3,610 (33.1%) | $56,828 |
| 65+ Years | 3,003 (27.5%) | $52,021 |
| Total | 10,905 (100.0%) | $51,971 |
Poverty in Eureka
Income Below Poverty by Sex and Age in Eureka
With 19.5% poverty level for males and 19.1% for females among the residents of Eureka, 16 and 17 year old males and 5 year old females are the most vulnerable to poverty, with 132 males (61.7%) and 52 females (55.9%) in their respective age groups living below the poverty level.
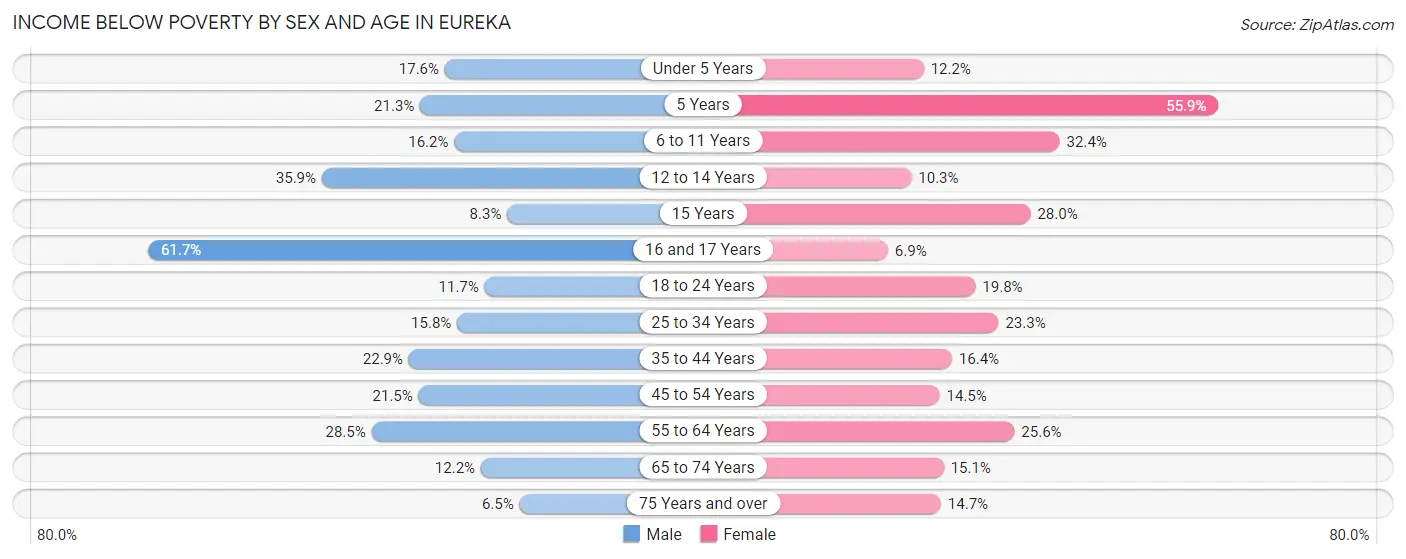
| Age Bracket | Male | Female |
| Under 5 Years | 79 (17.6%) | 86 (12.2%) |
| 5 Years | 27 (21.3%) | 52 (55.9%) |
| 6 to 11 Years | 182 (16.2%) | 186 (32.4%) |
| 12 to 14 Years | 142 (35.9%) | 28 (10.3%) |
| 15 Years | 18 (8.3%) | 51 (28.0%) |
| 16 and 17 Years | 132 (61.7%) | 10 (6.9%) |
| 18 to 24 Years | 121 (11.7%) | 300 (19.8%) |
| 25 to 34 Years | 318 (15.8%) | 436 (23.3%) |
| 35 to 44 Years | 471 (22.9%) | 338 (16.4%) |
| 45 to 54 Years | 425 (21.5%) | 229 (14.5%) |
| 55 to 64 Years | 422 (28.5%) | 406 (25.6%) |
| 65 to 74 Years | 165 (12.2%) | 238 (15.1%) |
| 75 Years and over | 39 (6.5%) | 142 (14.7%) |
| Total | 2,541 (19.5%) | 2,502 (19.1%) |
Income Above Poverty by Sex and Age in Eureka
According to the poverty statistics in Eureka, males aged 75 years and over and females aged 16 and 17 years are the age groups that are most secure financially, with 93.5% of males and 93.1% of females in these age groups living above the poverty line.
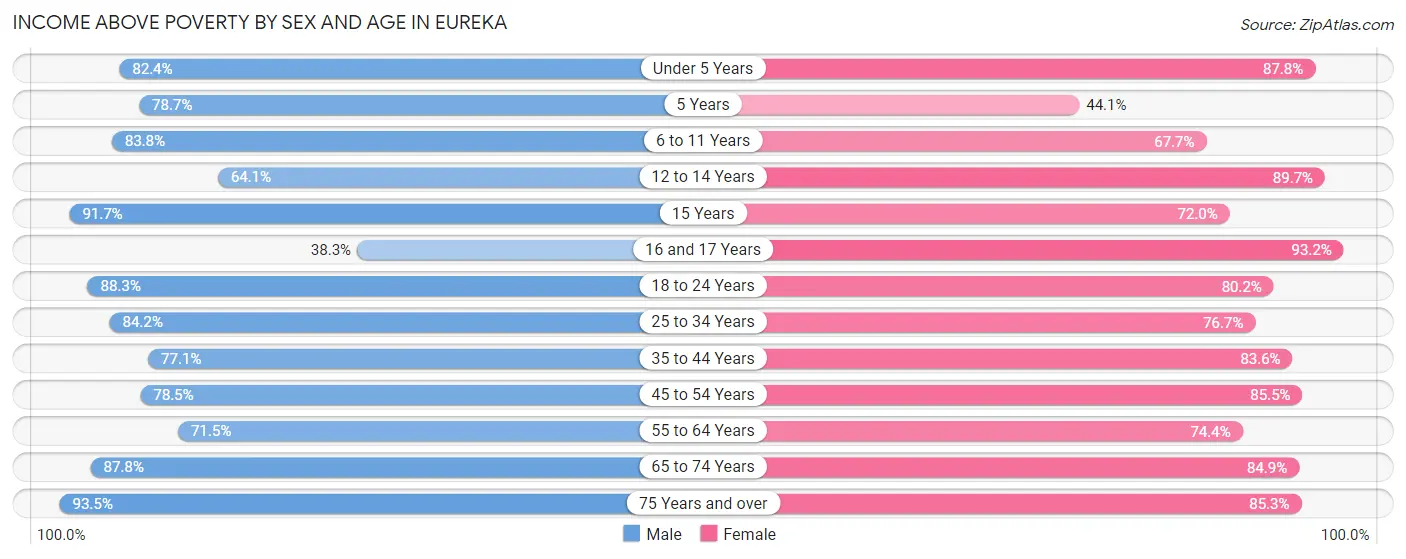
| Age Bracket | Male | Female |
| Under 5 Years | 370 (82.4%) | 621 (87.8%) |
| 5 Years | 100 (78.7%) | 41 (44.1%) |
| 6 to 11 Years | 942 (83.8%) | 389 (67.6%) |
| 12 to 14 Years | 254 (64.1%) | 243 (89.7%) |
| 15 Years | 198 (91.7%) | 131 (72.0%) |
| 16 and 17 Years | 82 (38.3%) | 136 (93.1%) |
| 18 to 24 Years | 914 (88.3%) | 1,212 (80.2%) |
| 25 to 34 Years | 1,698 (84.2%) | 1,438 (76.7%) |
| 35 to 44 Years | 1,582 (77.1%) | 1,728 (83.6%) |
| 45 to 54 Years | 1,553 (78.5%) | 1,349 (85.5%) |
| 55 to 64 Years | 1,060 (71.5%) | 1,178 (74.4%) |
| 65 to 74 Years | 1,183 (87.8%) | 1,335 (84.9%) |
| 75 Years and over | 561 (93.5%) | 823 (85.3%) |
| Total | 10,497 (80.5%) | 10,624 (80.9%) |
Income Below Poverty Among Married-Couple Families in Eureka
The poverty statistics for married-couple families in Eureka show that 4.3% or 162 of the total 3,756 families live below the poverty line. Families with 5 or more children have the highest poverty rate of 68.5%, comprising of 37 families. On the other hand, families with 1 or 2 children have the lowest poverty rate of 0.6%, which includes 6 families.
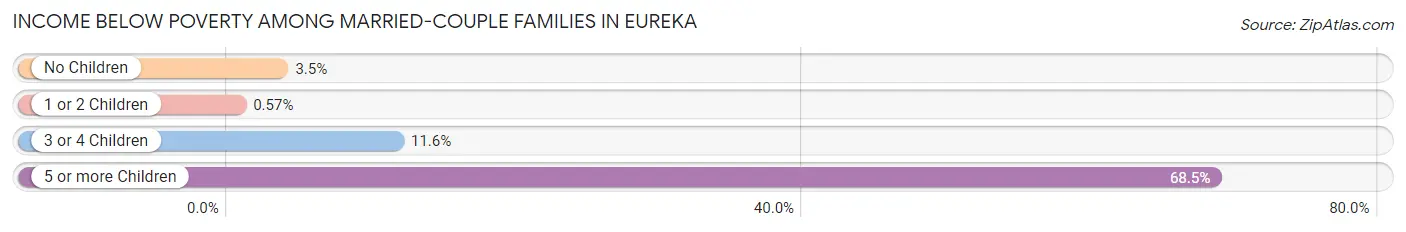
| Children | Above Poverty | Below Poverty |
| No Children | 2,253 (96.5%) | 82 (3.5%) |
| 1 or 2 Children | 1,041 (99.4%) | 6 (0.6%) |
| 3 or 4 Children | 283 (88.4%) | 37 (11.6%) |
| 5 or more Children | 17 (31.5%) | 37 (68.5%) |
| Total | 3,594 (95.7%) | 162 (4.3%) |
Income Below Poverty Among Single-Parent Households in Eureka
According to the poverty data in Eureka, 13.0% or 73 single-father households and 29.5% or 332 single-mother households are living below the poverty line. Among single-father households, those with 1 or 2 children have the highest poverty rate, with 60 households (17.0%) experiencing poverty. Likewise, among single-mother households, those with 3 or 4 children have the highest poverty rate, with 79 households (100.0%) falling below the poverty line.
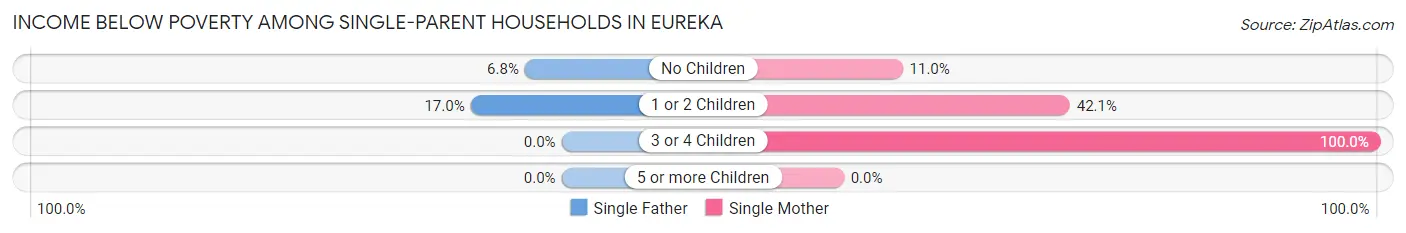
| Children | Single Father | Single Mother |
| No Children | 13 (6.8%) | 66 (11.0%) |
| 1 or 2 Children | 60 (17.0%) | 187 (42.1%) |
| 3 or 4 Children | 0 (0.0%) | 79 (100.0%) |
| 5 or more Children | 0 (0.0%) | 0 (0.0%) |
| Total | 73 (13.0%) | 332 (29.5%) |
Income Below Poverty Among Married-Couple vs Single-Parent Households in Eureka
The poverty data for Eureka shows that 162 of the married-couple family households (4.3%) and 405 of the single-parent households (24.0%) are living below the poverty level. Within the married-couple family households, those with 5 or more children have the highest poverty rate, with 37 households (68.5%) falling below the poverty line. Among the single-parent households, those with 3 or 4 children have the highest poverty rate, with 79 household (83.2%) living below poverty.
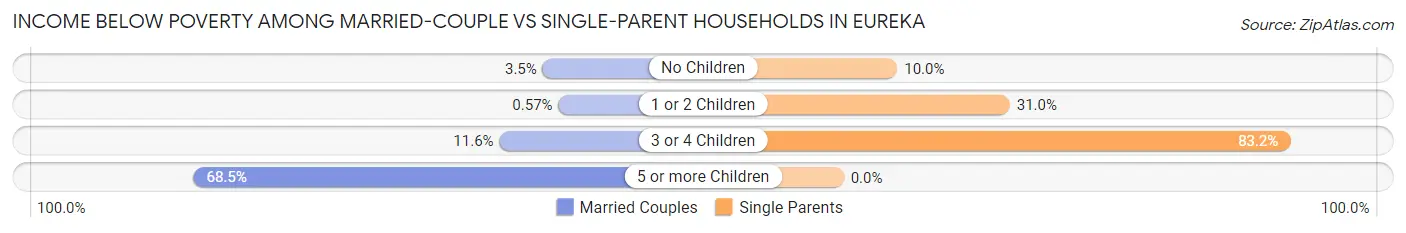
| Children | Married-Couple Families | Single-Parent Households |
| No Children | 82 (3.5%) | 79 (10.0%) |
| 1 or 2 Children | 6 (0.6%) | 247 (30.9%) |
| 3 or 4 Children | 37 (11.6%) | 79 (83.2%) |
| 5 or more Children | 37 (68.5%) | 0 (0.0%) |
| Total | 162 (4.3%) | 405 (24.0%) |
Race in Eureka
The most populous races in Eureka are White / Caucasian (18,550 | 70.0%), Hispanic or Latino (3,793 | 14.3%), and Two or more Races (3,246 | 12.2%).
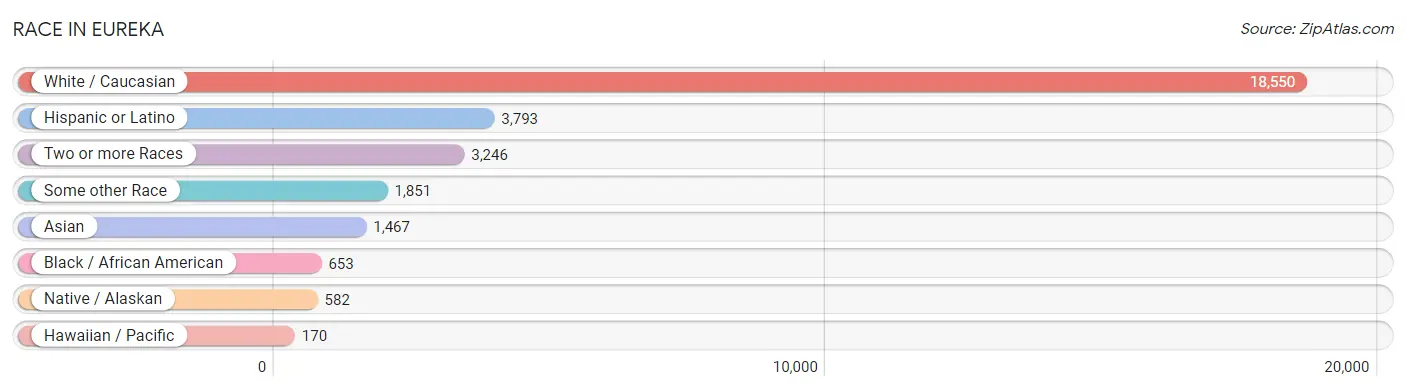
| Race | # Population | % Population |
| Asian | 1,467 | 5.5% |
| Black / African American | 653 | 2.5% |
| Hawaiian / Pacific | 170 | 0.6% |
| Hispanic or Latino | 3,793 | 14.3% |
| Native / Alaskan | 582 | 2.2% |
| White / Caucasian | 18,550 | 70.0% |
| Two or more Races | 3,246 | 12.2% |
| Some other Race | 1,851 | 7.0% |
| Total | 26,519 | 100.0% |
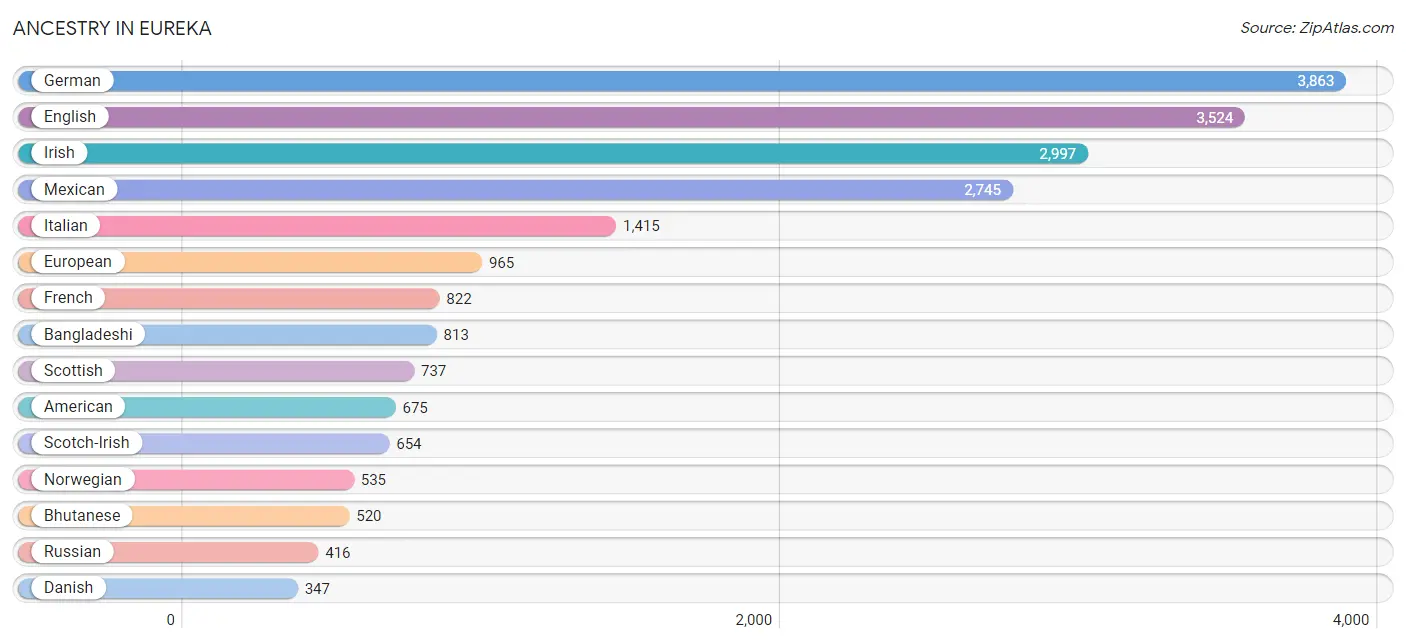
Ancestry in Eureka
The most populous ancestries reported in Eureka are German (3,863 | 14.6%), English (3,524 | 13.3%), Irish (2,997 | 11.3%), Mexican (2,745 | 10.3%), and Italian (1,415 | 5.3%), together accounting for 54.8% of all Eureka residents.
| Ancestry | # Population | % Population |
| African | 16 | 0.1% |
| Aleut | 143 | 0.5% |
| American | 675 | 2.5% |
| Arab | 13 | 0.1% |
| Armenian | 42 | 0.2% |
| Austrian | 14 | 0.1% |
| Bangladeshi | 813 | 3.1% |
| Basque | 62 | 0.2% |
| Belgian | 57 | 0.2% |
| Bhutanese | 520 | 2.0% |
| Blackfeet | 182 | 0.7% |
| British | 171 | 0.6% |
| Burmese | 267 | 1.0% |
| Canadian | 39 | 0.2% |
| Central American | 338 | 1.3% |
| Cherokee | 232 | 0.9% |
| Cheyenne | 31 | 0.1% |
| Chippewa | 120 | 0.4% |
| Colombian | 36 | 0.1% |
| Creek | 21 | 0.1% |
| Croatian | 18 | 0.1% |
| Cuban | 153 | 0.6% |
| Czech | 107 | 0.4% |
| Czechoslovakian | 6 | 0.0% |
| Danish | 347 | 1.3% |
| Dutch | 192 | 0.7% |
| Eastern European | 343 | 1.3% |
| English | 3,524 | 13.3% |
| Ethiopian | 36 | 0.1% |
| European | 965 | 3.6% |
| Filipino | 16 | 0.1% |
| Finnish | 135 | 0.5% |
| French | 822 | 3.1% |
| French Canadian | 186 | 0.7% |
| German | 3,863 | 14.6% |
| Ghanaian | 71 | 0.3% |
| Greek | 164 | 0.6% |
| Guamanian / Chamorro | 139 | 0.5% |
| Guatemalan | 33 | 0.1% |
| Hungarian | 8 | 0.0% |
| Indian (Asian) | 283 | 1.1% |
| Iranian | 18 | 0.1% |
| Irish | 2,997 | 11.3% |
| Israeli | 1 | 0.0% |
| Italian | 1,415 | 5.3% |
| Jamaican | 7 | 0.0% |
| Korean | 268 | 1.0% |
| Latvian | 195 | 0.7% |
| Malaysian | 105 | 0.4% |
| Mexican | 2,745 | 10.3% |
| Mexican American Indian | 56 | 0.2% |
| Native Hawaiian | 215 | 0.8% |
| Nicaraguan | 36 | 0.1% |
| Nigerian | 17 | 0.1% |
| Northern European | 93 | 0.4% |
| Norwegian | 535 | 2.0% |
| Pakistani | 53 | 0.2% |
| Pennsylvania German | 28 | 0.1% |
| Peruvian | 25 | 0.1% |
| Pima | 4 | 0.0% |
| Polish | 345 | 1.3% |
| Portuguese | 278 | 1.1% |
| Pueblo | 6 | 0.0% |
| Puerto Rican | 187 | 0.7% |
| Russian | 416 | 1.6% |
| Salvadoran | 269 | 1.0% |
| Samoan | 1 | 0.0% |
| Scandinavian | 152 | 0.6% |
| Scotch-Irish | 654 | 2.5% |
| Scottish | 737 | 2.8% |
| Seminole | 106 | 0.4% |
| Serbian | 13 | 0.1% |
| Sioux | 70 | 0.3% |
| Slovak | 10 | 0.0% |
| South African | 17 | 0.1% |
| South American | 61 | 0.2% |
| Spaniard | 83 | 0.3% |
| Spanish | 127 | 0.5% |
| Sri Lankan | 25 | 0.1% |
| Subsaharan African | 157 | 0.6% |
| Swedish | 313 | 1.2% |
| Swiss | 260 | 1.0% |
| Thai | 133 | 0.5% |
| Tongan | 32 | 0.1% |
| Trinidadian and Tobagonian | 8 | 0.0% |
| Ukrainian | 205 | 0.8% |
| Welsh | 121 | 0.5% |
| Yaqui | 23 | 0.1% | View All 88 Rows |
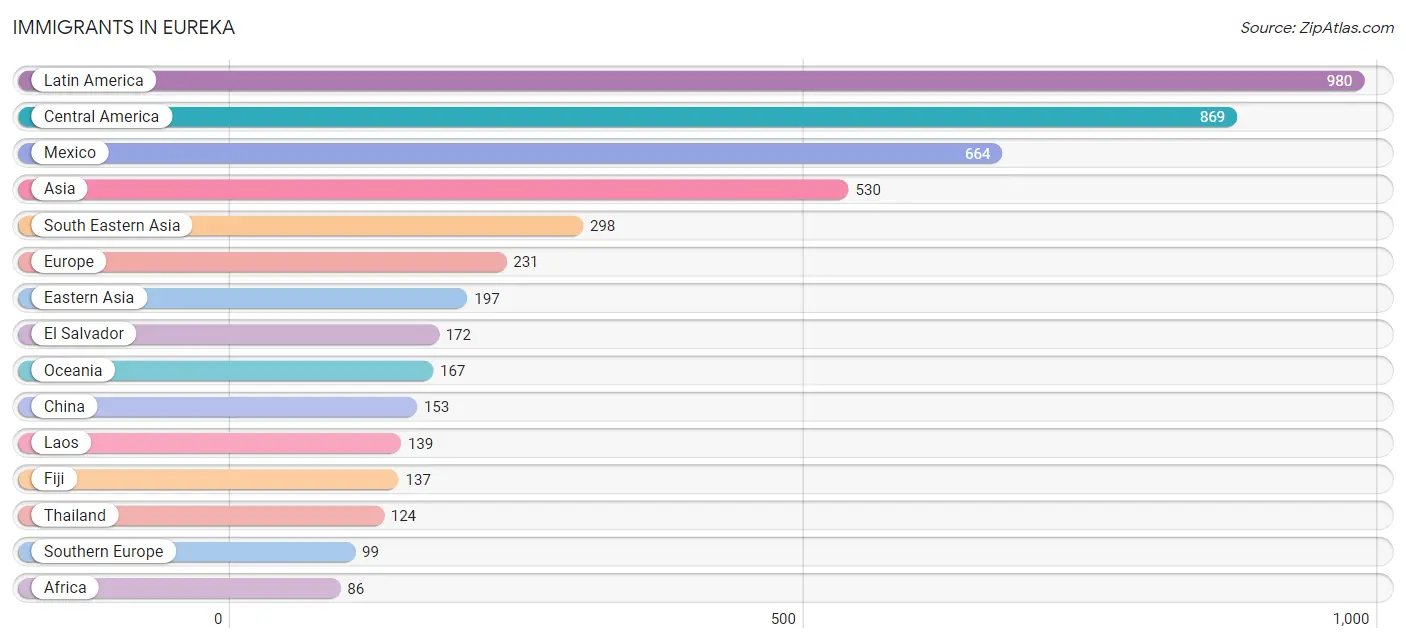
Immigrants in Eureka
The most numerous immigrant groups reported in Eureka came from Latin America (980 | 3.7%), Central America (869 | 3.3%), Mexico (664 | 2.5%), Asia (530 | 2.0%), and South Eastern Asia (298 | 1.1%), together accounting for 12.6% of all Eureka residents.
| Immigration Origin | # Population | % Population |
| Africa | 86 | 0.3% |
| Asia | 530 | 2.0% |
| Australia | 10 | 0.0% |
| Canada | 77 | 0.3% |
| Caribbean | 50 | 0.2% |
| Central America | 869 | 3.3% |
| China | 153 | 0.6% |
| Colombia | 36 | 0.1% |
| Cuba | 32 | 0.1% |
| Czechoslovakia | 29 | 0.1% |
| Eastern Africa | 14 | 0.1% |
| Eastern Asia | 197 | 0.7% |
| Eastern Europe | 49 | 0.2% |
| El Salvador | 172 | 0.6% |
| England | 28 | 0.1% |
| Ethiopia | 14 | 0.1% |
| Europe | 231 | 0.9% |
| Fiji | 137 | 0.5% |
| Germany | 17 | 0.1% |
| Ghana | 71 | 0.3% |
| Guatemala | 33 | 0.1% |
| Hong Kong | 6 | 0.0% |
| India | 20 | 0.1% |
| Italy | 82 | 0.3% |
| Japan | 1 | 0.0% |
| Korea | 43 | 0.2% |
| Laos | 139 | 0.5% |
| Latin America | 980 | 3.7% |
| Liberia | 1 | 0.0% |
| Mexico | 664 | 2.5% |
| Northern Europe | 61 | 0.2% |
| Oceania | 167 | 0.6% |
| Pakistan | 15 | 0.1% |
| Peru | 25 | 0.1% |
| Philippines | 35 | 0.1% |
| Portugal | 8 | 0.0% |
| Russia | 20 | 0.1% |
| South America | 61 | 0.2% |
| South Central Asia | 35 | 0.1% |
| South Eastern Asia | 298 | 1.1% |
| Southern Europe | 99 | 0.4% |
| Spain | 9 | 0.0% |
| Switzerland | 5 | 0.0% |
| Thailand | 124 | 0.5% |
| Trinidad and Tobago | 18 | 0.1% |
| Western Africa | 72 | 0.3% |
| Western Europe | 22 | 0.1% | View All 47 Rows |
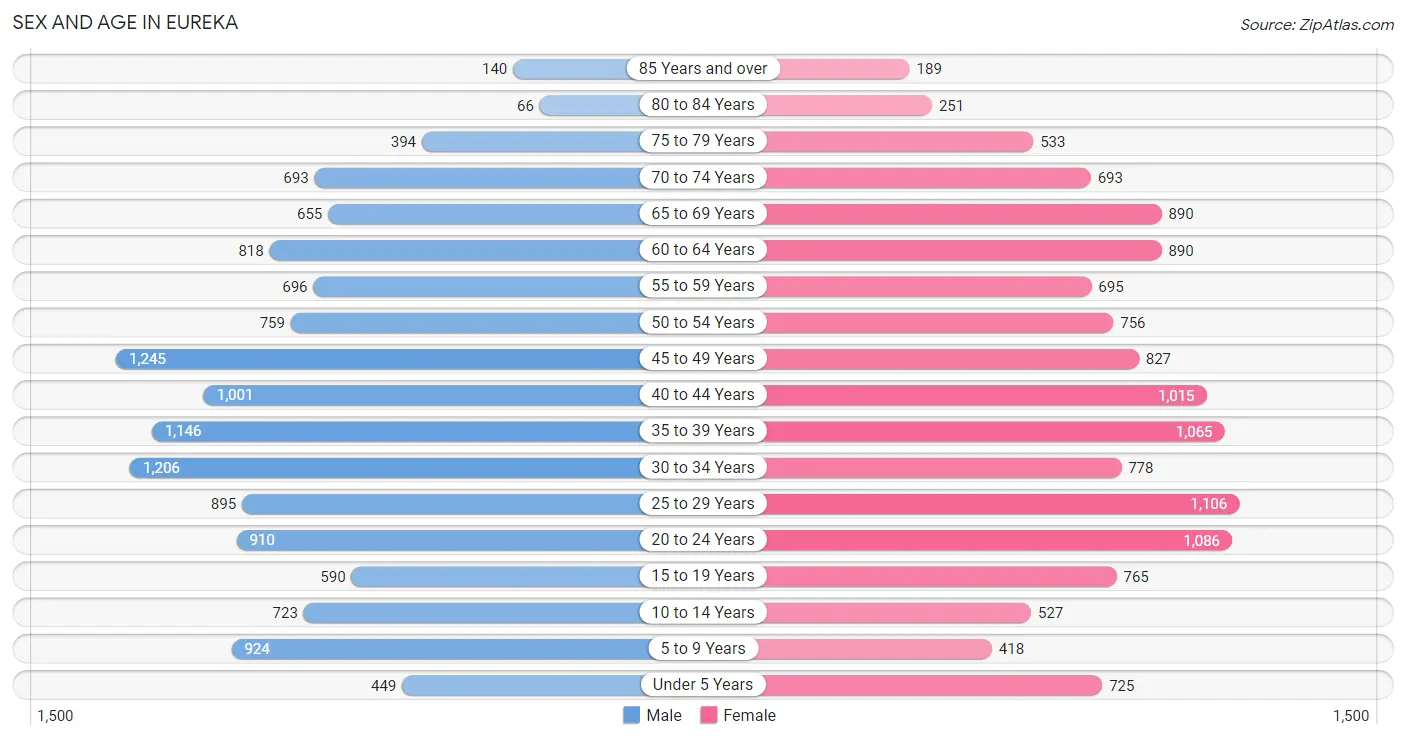
Sex and Age in Eureka
Sex and Age in Eureka
The most populous age groups in Eureka are 45 to 49 Years (1,245 | 9.3%) for men and 25 to 29 Years (1,106 | 8.4%) for women.
| Age Bracket | Male | Female |
| Under 5 Years | 449 (3.4%) | 725 (5.5%) |
| 5 to 9 Years | 924 (6.9%) | 418 (3.2%) |
| 10 to 14 Years | 723 (5.4%) | 527 (4.0%) |
| 15 to 19 Years | 590 (4.4%) | 765 (5.8%) |
| 20 to 24 Years | 910 (6.8%) | 1,086 (8.2%) |
| 25 to 29 Years | 895 (6.7%) | 1,106 (8.4%) |
| 30 to 34 Years | 1,206 (9.1%) | 778 (5.9%) |
| 35 to 39 Years | 1,146 (8.6%) | 1,065 (8.1%) |
| 40 to 44 Years | 1,001 (7.5%) | 1,015 (7.7%) |
| 45 to 49 Years | 1,245 (9.3%) | 827 (6.3%) |
| 50 to 54 Years | 759 (5.7%) | 756 (5.7%) |
| 55 to 59 Years | 696 (5.2%) | 695 (5.3%) |
| 60 to 64 Years | 818 (6.1%) | 890 (6.7%) |
| 65 to 69 Years | 655 (4.9%) | 890 (6.7%) |
| 70 to 74 Years | 693 (5.2%) | 693 (5.2%) |
| 75 to 79 Years | 394 (3.0%) | 533 (4.0%) |
| 80 to 84 Years | 66 (0.5%) | 251 (1.9%) |
| 85 Years and over | 140 (1.1%) | 189 (1.4%) |
| Total | 13,310 (100.0%) | 13,209 (100.0%) |
Families and Households in Eureka
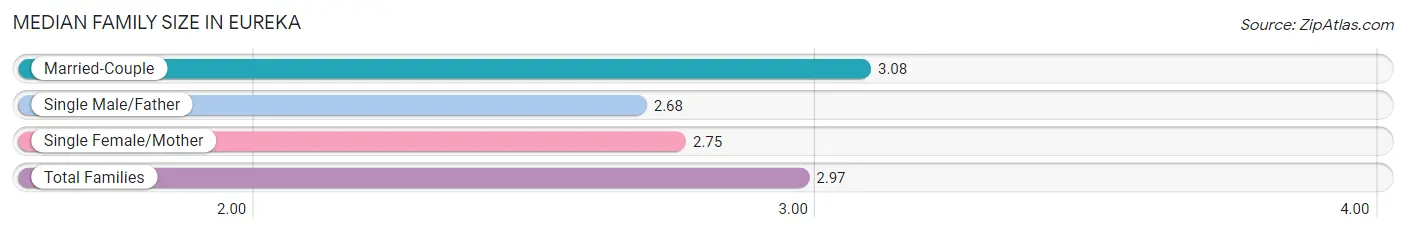
Median Family Size in Eureka
The median family size in Eureka is 2.97 persons per family, with married-couple families (3,756 | 69.0%) accounting for the largest median family size of 3.08 persons per family. On the other hand, single male/father families (560 | 10.3%) represent the smallest median family size with 2.68 persons per family.
| Family Type | # Families | Family Size |
| Married-Couple | 3,756 (69.0%) | 3.08 |
| Single Male/Father | 560 (10.3%) | 2.68 |
| Single Female/Mother | 1,124 (20.7%) | 2.75 |
| Total Families | 5,440 (100.0%) | 2.97 |
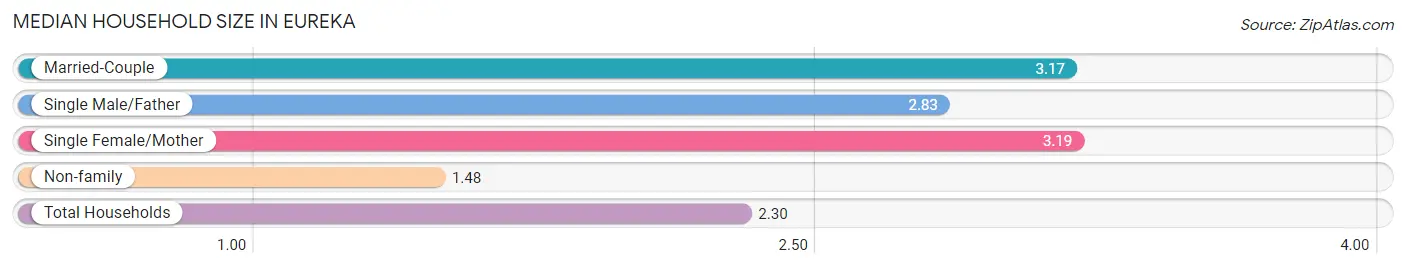
Median Household Size in Eureka
The median household size in Eureka is 2.30 persons per household, with single female/mother households (1,124 | 10.3%) accounting for the largest median household size of 3.19 persons per household. non-family households (5,465 | 50.1%) represent the smallest median household size with 1.48 persons per household.
| Household Type | # Households | Household Size |
| Married-Couple | 3,756 (34.4%) | 3.17 |
| Single Male/Father | 560 (5.1%) | 2.83 |
| Single Female/Mother | 1,124 (10.3%) | 3.19 |
| Non-family | 5,465 (50.1%) | 1.48 |
| Total Households | 10,905 (100.0%) | 2.30 |
Household Size by Marriage Status in Eureka
Out of a total of 10,905 households in Eureka, 5,440 (49.9%) are family households, while 5,465 (50.1%) are nonfamily households. The most numerous type of family households are 2-person households, comprising 2,698, and the most common type of nonfamily households are 1-person households, comprising 3,823.
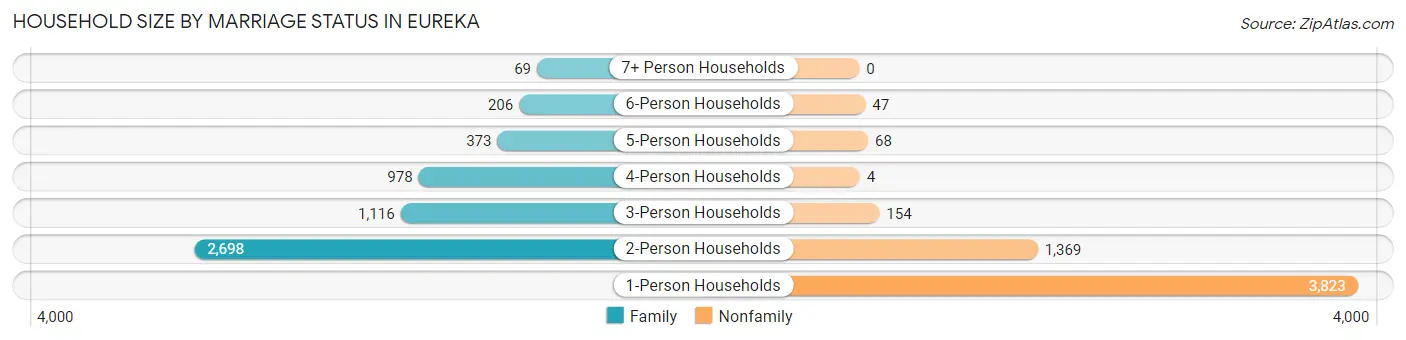
| Household Size | Family Households | Nonfamily Households |
| 1-Person Households | - | 3,823 (35.1%) |
| 2-Person Households | 2,698 (24.7%) | 1,369 (12.6%) |
| 3-Person Households | 1,116 (10.2%) | 154 (1.4%) |
| 4-Person Households | 978 (9.0%) | 4 (0.0%) |
| 5-Person Households | 373 (3.4%) | 68 (0.6%) |
| 6-Person Households | 206 (1.9%) | 47 (0.4%) |
| 7+ Person Households | 69 (0.6%) | 0 (0.0%) |
| Total | 5,440 (49.9%) | 5,465 (50.1%) |
Female Fertility in Eureka
Fertility by Age in Eureka
Average fertility rate in Eureka is 46.0 births per 1,000 women. Women in the age bracket of 20 to 34 years have the highest fertility rate with 94.0 births per 1,000 women. Women in the age bracket of 20 to 34 years acount for 88.3% of all women with births.
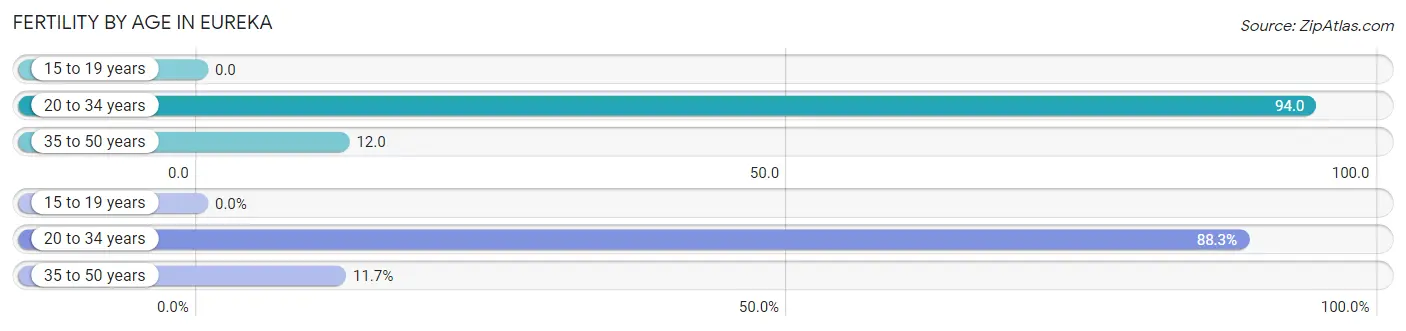
| Age Bracket | Women with Births | Births / 1,000 Women |
| 15 to 19 years | 0 (0.0%) | 0.0 |
| 20 to 34 years | 279 (88.3%) | 94.0 |
| 35 to 50 years | 37 (11.7%) | 12.0 |
| Total | 316 (100.0%) | 46.0 |
Fertility by Age by Marriage Status in Eureka
65.2% of women with births (316) in Eureka are married. The highest percentage of unmarried women with births falls into 20 to 34 years age bracket with 39.4% of them unmarried at the time of birth, while the lowest percentage of unmarried women with births belong to 35 to 50 years age bracket with 0.0% of them unmarried.
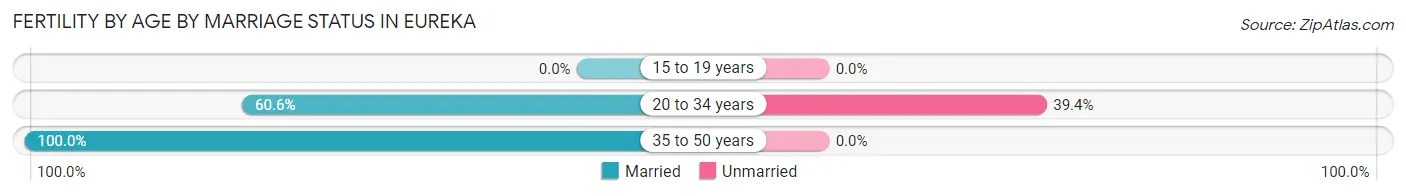
| Age Bracket | Married | Unmarried |
| 15 to 19 years | 0 (0.0%) | 0 (0.0%) |
| 20 to 34 years | 169 (60.6%) | 110 (39.4%) |
| 35 to 50 years | 37 (100.0%) | 0 (0.0%) |
| Total | 206 (65.2%) | 110 (34.8%) |
Fertility by Education in Eureka
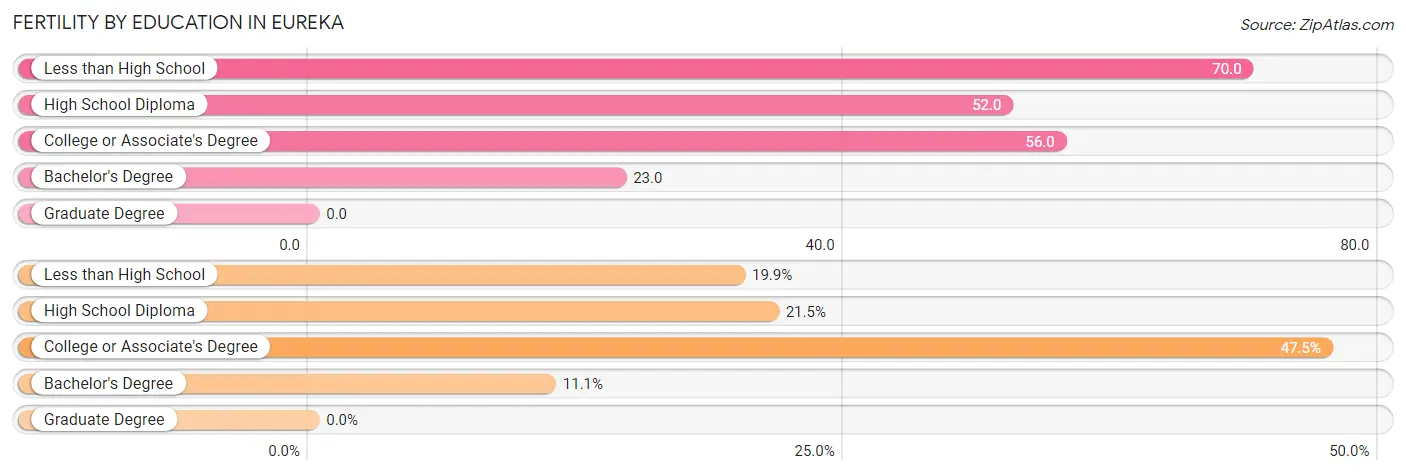
| Educational Attainment | Women with Births | Births / 1,000 Women |
| Less than High School | 63 (19.9%) | 70.0 |
| High School Diploma | 68 (21.5%) | 52.0 |
| College or Associate's Degree | 150 (47.5%) | 56.0 |
| Bachelor's Degree | 35 (11.1%) | 23.0 |
| Graduate Degree | 0 (0.0%) | 0.0 |
| Total | 316 (100.0%) | 46.0 |
Fertility by Education by Marriage Status in Eureka
34.8% of women with births in Eureka are unmarried. Women with the educational attainment of less than high school are most likely to be married with 100.0% of them married at childbirth, while women with the educational attainment of college or associate's degree are least likely to be married with 71.3% of them unmarried at childbirth.
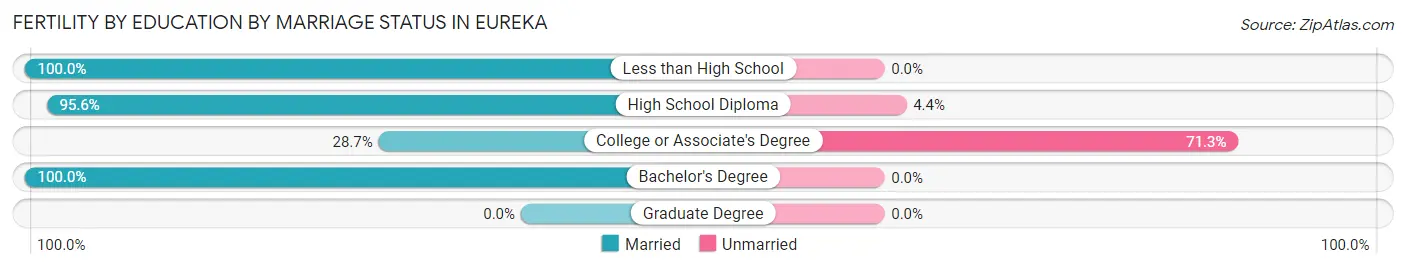
| Educational Attainment | Married | Unmarried |
| Less than High School | 63 (100.0%) | 0 (0.0%) |
| High School Diploma | 65 (95.6%) | 3 (4.4%) |
| College or Associate's Degree | 43 (28.7%) | 107 (71.3%) |
| Bachelor's Degree | 35 (100.0%) | 0 (0.0%) |
| Graduate Degree | 0 (0.0%) | 0 (0.0%) |
| Total | 206 (65.2%) | 110 (34.8%) |
Employment Characteristics in Eureka
Employment by Class of Employer in Eureka
Among the 11,792 employed individuals in Eureka, private company employees (6,580 | 55.8%), not-for-profit organizations (1,214 | 10.3%), and local government employees (1,211 | 10.3%) make up the most common classes of employment.
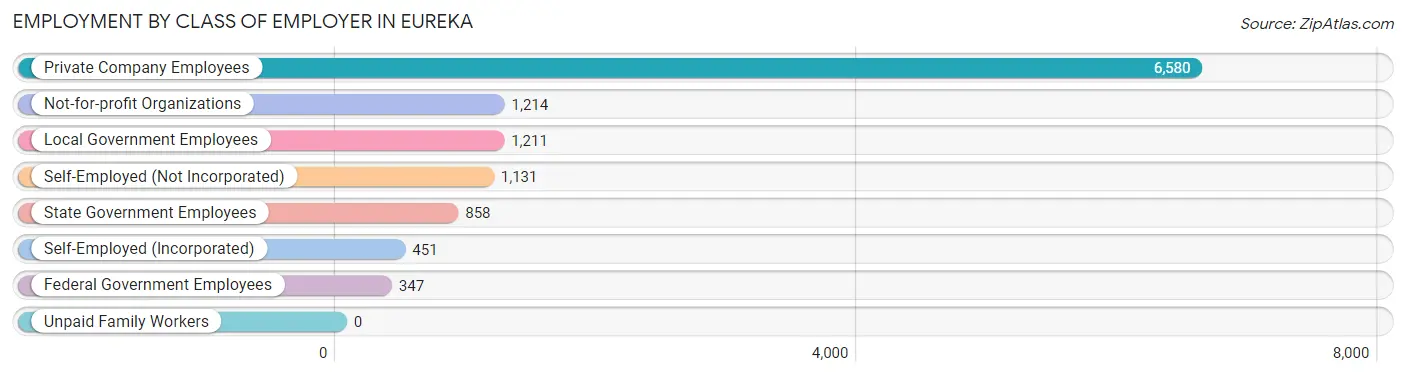
| Employer Class | # Employees | % Employees |
| Private Company Employees | 6,580 | 55.8% |
| Self-Employed (Incorporated) | 451 | 3.8% |
| Self-Employed (Not Incorporated) | 1,131 | 9.6% |
| Not-for-profit Organizations | 1,214 | 10.3% |
| Local Government Employees | 1,211 | 10.3% |
| State Government Employees | 858 | 7.3% |
| Federal Government Employees | 347 | 2.9% |
| Unpaid Family Workers | 0 | 0.0% |
| Total | 11,792 | 100.0% |
Employment Status by Age in Eureka
According to the labor force statistics for Eureka, out of the total population over 16 years of age (22,353), 61.5% or 13,747 individuals are in the labor force, with 10.1% or 1,388 of them unemployed. The age group with the highest labor force participation rate is 30 to 34 years, with 84.9% or 1,684 individuals in the labor force. Within the labor force, the 16 to 19 years age range has the highest percentage of unemployed individuals, with 25.7% or 104 of them being unemployed.
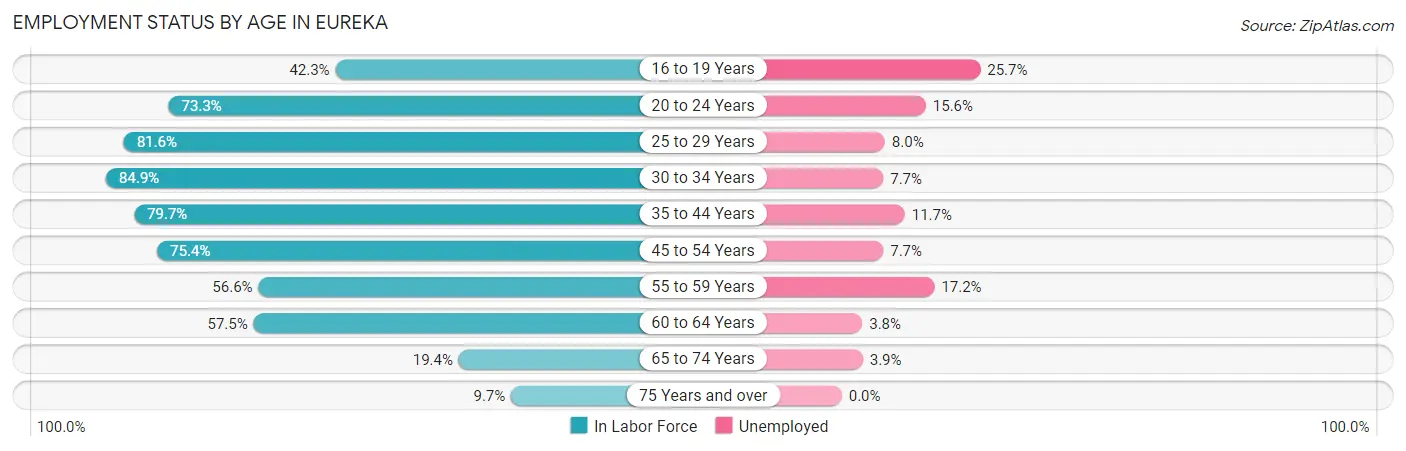
| Age Bracket | In Labor Force | Unemployed |
| 16 to 19 Years | 404 (42.3%) | 104 (25.7%) |
| 20 to 24 Years | 1,463 (73.3%) | 228 (15.6%) |
| 25 to 29 Years | 1,633 (81.6%) | 131 (8.0%) |
| 30 to 34 Years | 1,684 (84.9%) | 130 (7.7%) |
| 35 to 44 Years | 3,369 (79.7%) | 394 (11.7%) |
| 45 to 54 Years | 2,705 (75.4%) | 208 (7.7%) |
| 55 to 59 Years | 787 (56.6%) | 135 (17.2%) |
| 60 to 64 Years | 982 (57.5%) | 37 (3.8%) |
| 65 to 74 Years | 569 (19.4%) | 22 (3.9%) |
| 75 Years and over | 153 (9.7%) | 0 (0.0%) |
| Total | 13,747 (61.5%) | 1,388 (10.1%) |
Employment Status by Educational Attainment in Eureka
According to labor force statistics for Eureka, 74.9% of individuals (11,159) out of the total population between 25 and 64 years of age (14,898) are in the labor force, with 9.2% or 1,027 of them being unemployed. The group with the highest labor force participation rate are those with the educational attainment of bachelor's degree or higher, with 83.9% or 3,459 individuals in the labor force. Within the labor force, individuals with college / associate degree education have the highest percentage of unemployment, with 11.5% or 485 of them being unemployed.
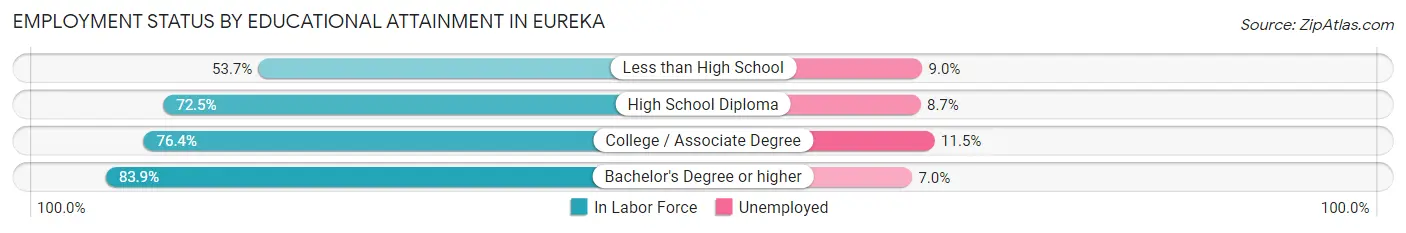
| Educational Attainment | In Labor Force | Unemployed |
| Less than High School | 941 (53.7%) | 158 (9.0%) |
| High School Diploma | 2,541 (72.5%) | 305 (8.7%) |
| College / Associate Degree | 4,215 (76.4%) | 634 (11.5%) |
| Bachelor's Degree or higher | 3,459 (83.9%) | 289 (7.0%) |
| Total | 11,159 (74.9%) | 1,371 (9.2%) |
Employment Occupations by Sex in Eureka
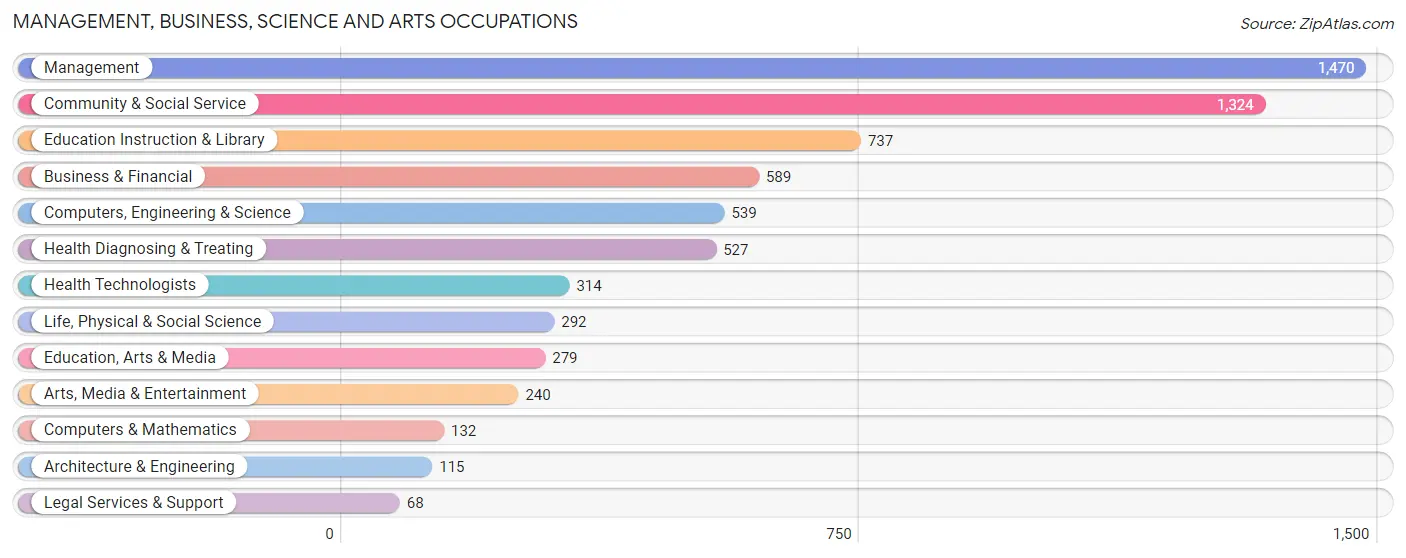
Management, Business, Science and Arts Occupations
The most common Management, Business, Science and Arts occupations in Eureka are Management (1,470 | 12.0%), Community & Social Service (1,324 | 10.8%), Education Instruction & Library (737 | 6.0%), Business & Financial (589 | 4.8%), and Computers, Engineering & Science (539 | 4.4%).
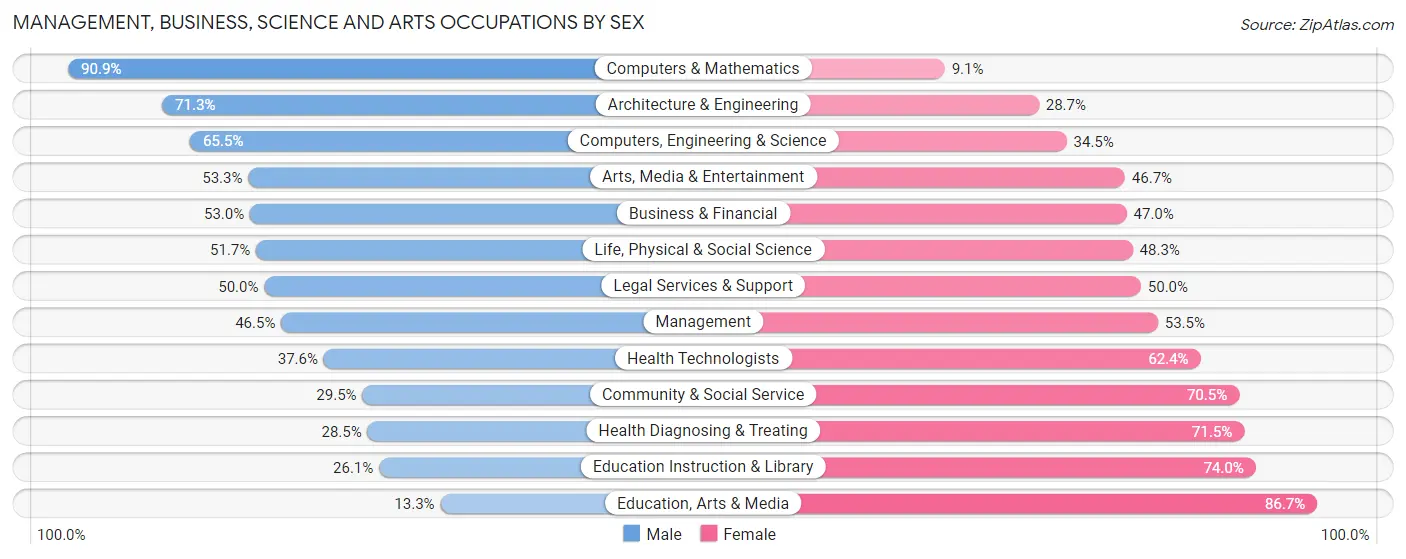
Management, Business, Science and Arts Occupations by Sex
Within the Management, Business, Science and Arts occupations in Eureka, the most male-oriented occupations are Computers & Mathematics (90.9%), Architecture & Engineering (71.3%), and Computers, Engineering & Science (65.5%), while the most female-oriented occupations are Education, Arts & Media (86.7%), Education Instruction & Library (74.0%), and Health Diagnosing & Treating (71.5%).
| Occupation | Male | Female |
| Management | 683 (46.5%) | 787 (53.5%) |
| Business & Financial | 312 (53.0%) | 277 (47.0%) |
| Computers, Engineering & Science | 353 (65.5%) | 186 (34.5%) |
| Computers & Mathematics | 120 (90.9%) | 12 (9.1%) |
| Architecture & Engineering | 82 (71.3%) | 33 (28.7%) |
| Life, Physical & Social Science | 151 (51.7%) | 141 (48.3%) |
| Community & Social Service | 391 (29.5%) | 933 (70.5%) |
| Education, Arts & Media | 37 (13.3%) | 242 (86.7%) |
| Legal Services & Support | 34 (50.0%) | 34 (50.0%) |
| Education Instruction & Library | 192 (26.1%) | 545 (74.0%) |
| Arts, Media & Entertainment | 128 (53.3%) | 112 (46.7%) |
| Health Diagnosing & Treating | 150 (28.5%) | 377 (71.5%) |
| Health Technologists | 118 (37.6%) | 196 (62.4%) |
| Total (Category) | 1,889 (42.5%) | 2,560 (57.5%) |
| Total (Overall) | 5,940 (48.4%) | 6,336 (51.6%) |
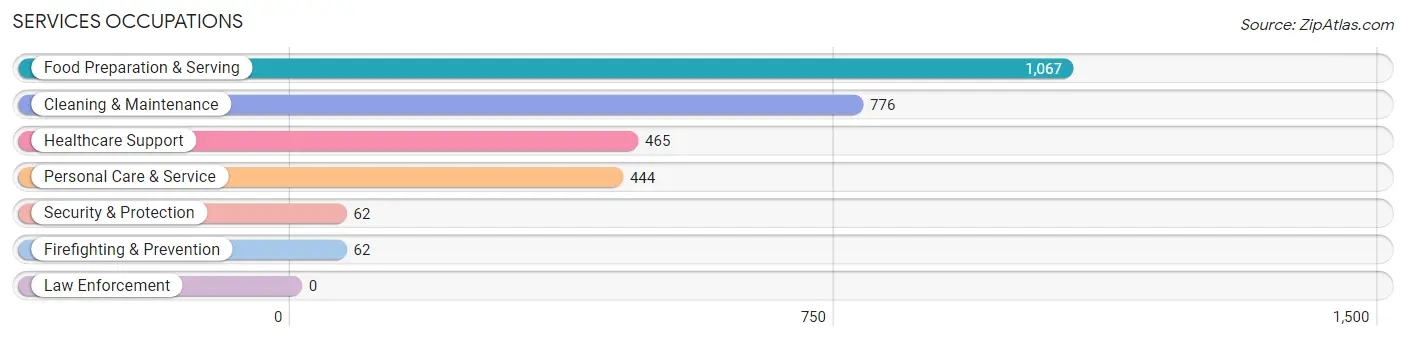
Services Occupations
The most common Services occupations in Eureka are Food Preparation & Serving (1,067 | 8.7%), Cleaning & Maintenance (776 | 6.3%), Healthcare Support (465 | 3.8%), Personal Care & Service (444 | 3.6%), and Security & Protection (62 | 0.5%).
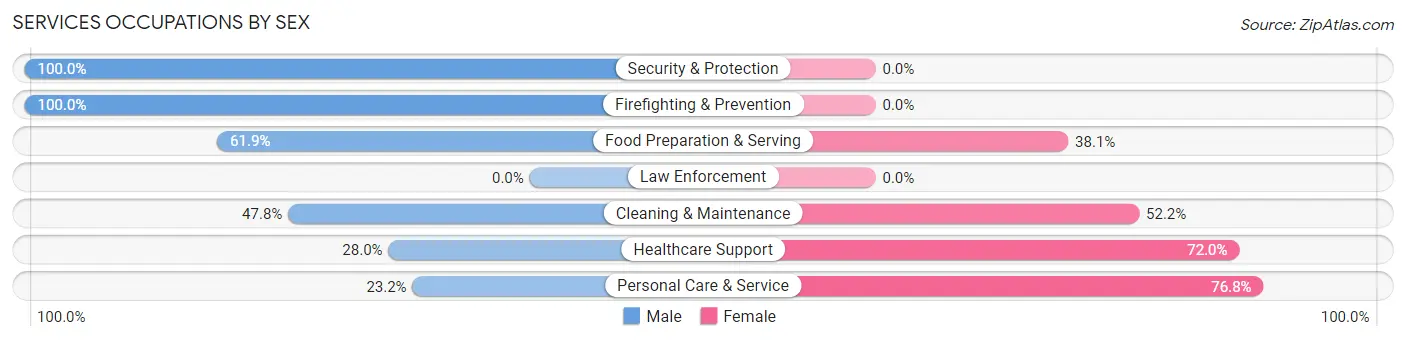
Services Occupations by Sex
Within the Services occupations in Eureka, the most male-oriented occupations are Security & Protection (100.0%), Firefighting & Prevention (100.0%), and Food Preparation & Serving (61.9%), while the most female-oriented occupations are Personal Care & Service (76.8%), Healthcare Support (72.0%), and Cleaning & Maintenance (52.2%).
| Occupation | Male | Female |
| Healthcare Support | 130 (28.0%) | 335 (72.0%) |
| Security & Protection | 62 (100.0%) | 0 (0.0%) |
| Firefighting & Prevention | 62 (100.0%) | 0 (0.0%) |
| Law Enforcement | 0 (0.0%) | 0 (0.0%) |
| Food Preparation & Serving | 660 (61.9%) | 407 (38.1%) |
| Cleaning & Maintenance | 371 (47.8%) | 405 (52.2%) |
| Personal Care & Service | 103 (23.2%) | 341 (76.8%) |
| Total (Category) | 1,326 (47.1%) | 1,488 (52.9%) |
| Total (Overall) | 5,940 (48.4%) | 6,336 (51.6%) |
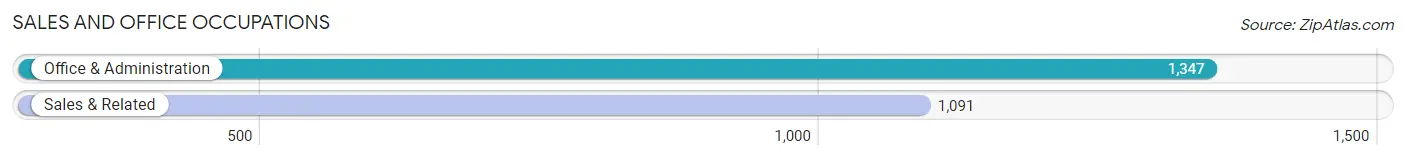
Sales and Office Occupations
The most common Sales and Office occupations in Eureka are Office & Administration (1,347 | 11.0%), and Sales & Related (1,091 | 8.9%).
Sales and Office Occupations by Sex
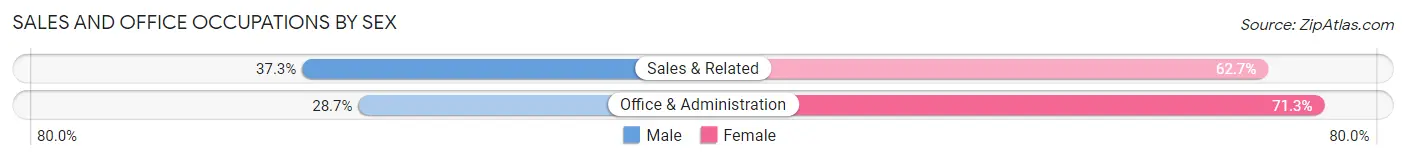
| Occupation | Male | Female |
| Sales & Related | 407 (37.3%) | 684 (62.7%) |
| Office & Administration | 386 (28.7%) | 961 (71.3%) |
| Total (Category) | 793 (32.5%) | 1,645 (67.5%) |
| Total (Overall) | 5,940 (48.4%) | 6,336 (51.6%) |
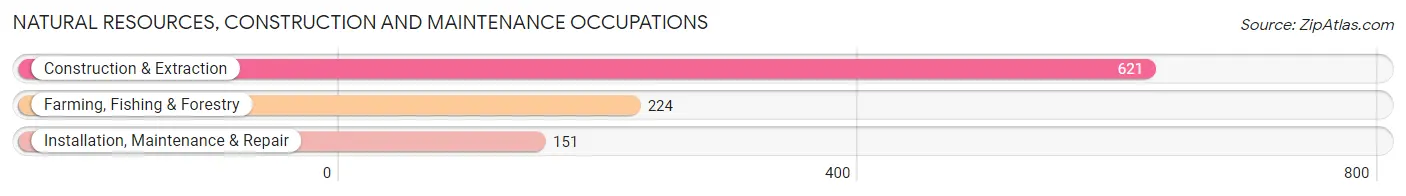
Natural Resources, Construction and Maintenance Occupations
The most common Natural Resources, Construction and Maintenance occupations in Eureka are Construction & Extraction (621 | 5.1%), Farming, Fishing & Forestry (224 | 1.8%), and Installation, Maintenance & Repair (151 | 1.2%).
Natural Resources, Construction and Maintenance Occupations by Sex
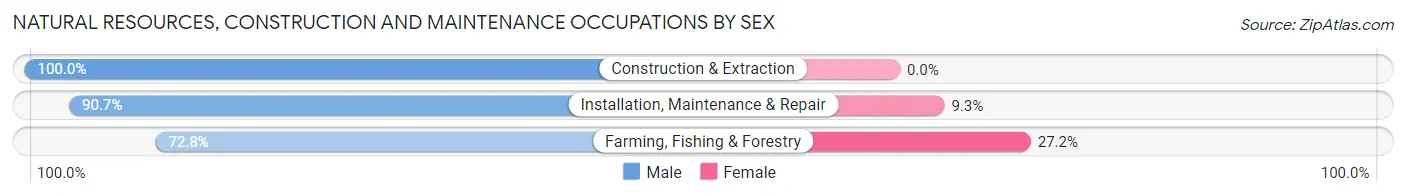
| Occupation | Male | Female |
| Farming, Fishing & Forestry | 163 (72.8%) | 61 (27.2%) |
| Construction & Extraction | 621 (100.0%) | 0 (0.0%) |
| Installation, Maintenance & Repair | 137 (90.7%) | 14 (9.3%) |
| Total (Category) | 921 (92.5%) | 75 (7.5%) |
| Total (Overall) | 5,940 (48.4%) | 6,336 (51.6%) |
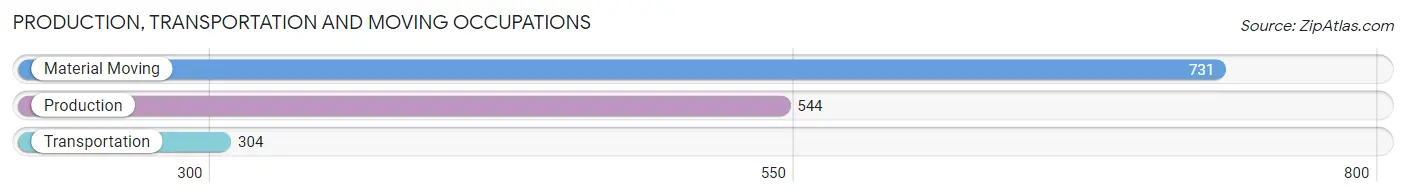
Production, Transportation and Moving Occupations
The most common Production, Transportation and Moving occupations in Eureka are Material Moving (731 | 5.9%), Production (544 | 4.4%), and Transportation (304 | 2.5%).
Production, Transportation and Moving Occupations by Sex
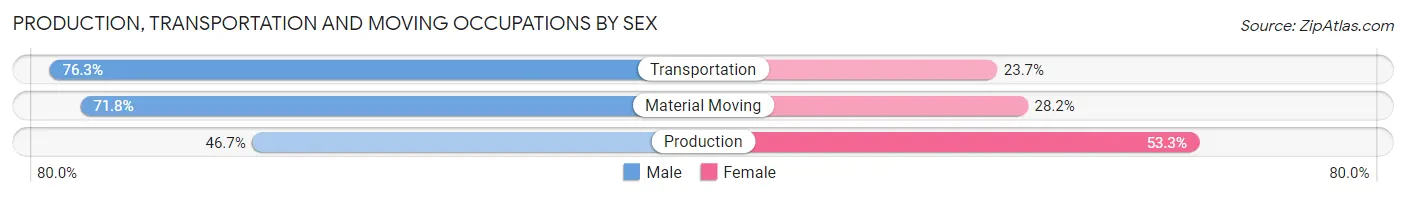
| Occupation | Male | Female |
| Production | 254 (46.7%) | 290 (53.3%) |
| Transportation | 232 (76.3%) | 72 (23.7%) |
| Material Moving | 525 (71.8%) | 206 (28.2%) |
| Total (Category) | 1,011 (64.0%) | 568 (36.0%) |
| Total (Overall) | 5,940 (48.4%) | 6,336 (51.6%) |
Employment Industries by Sex in Eureka
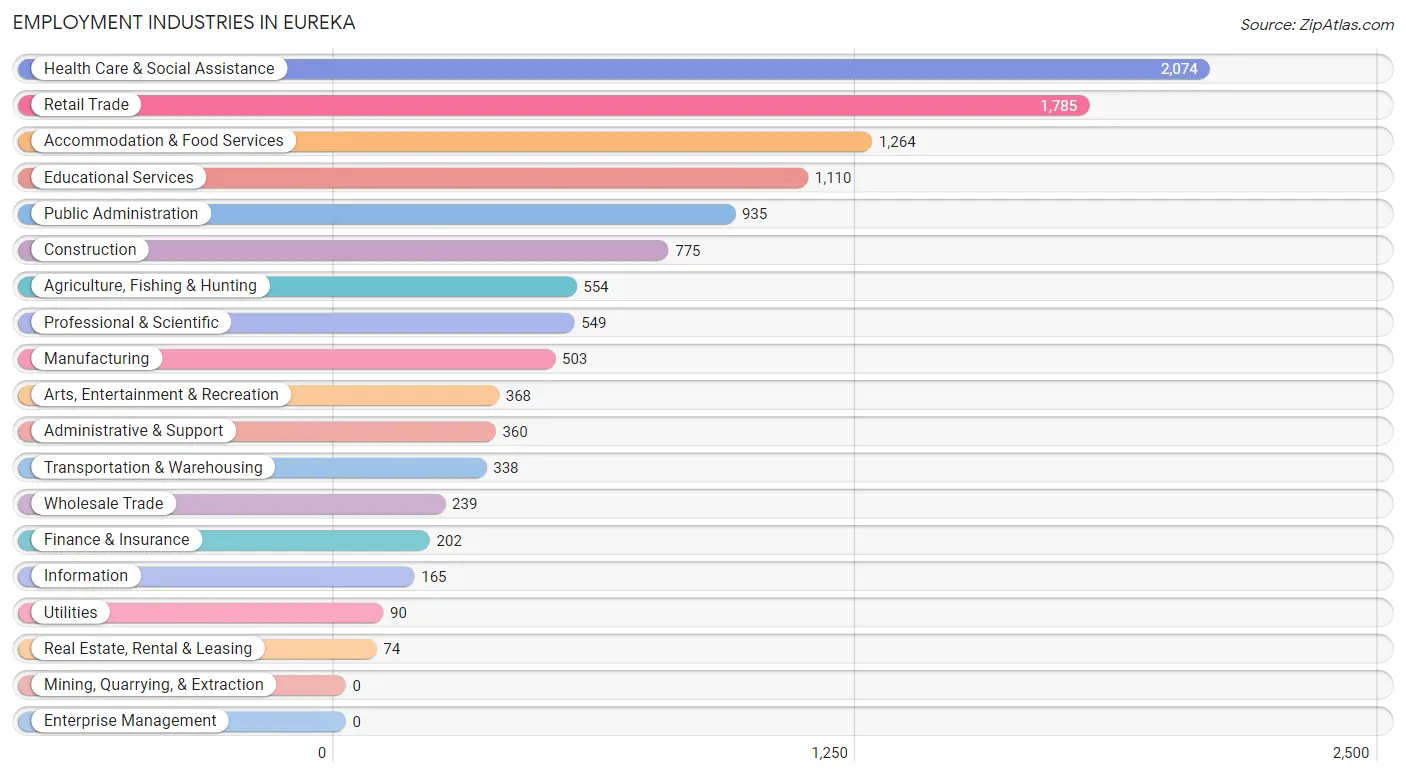
Employment Industries in Eureka
The major employment industries in Eureka include Health Care & Social Assistance (2,074 | 16.9%), Retail Trade (1,785 | 14.5%), Accommodation & Food Services (1,264 | 10.3%), Educational Services (1,110 | 9.0%), and Public Administration (935 | 7.6%).
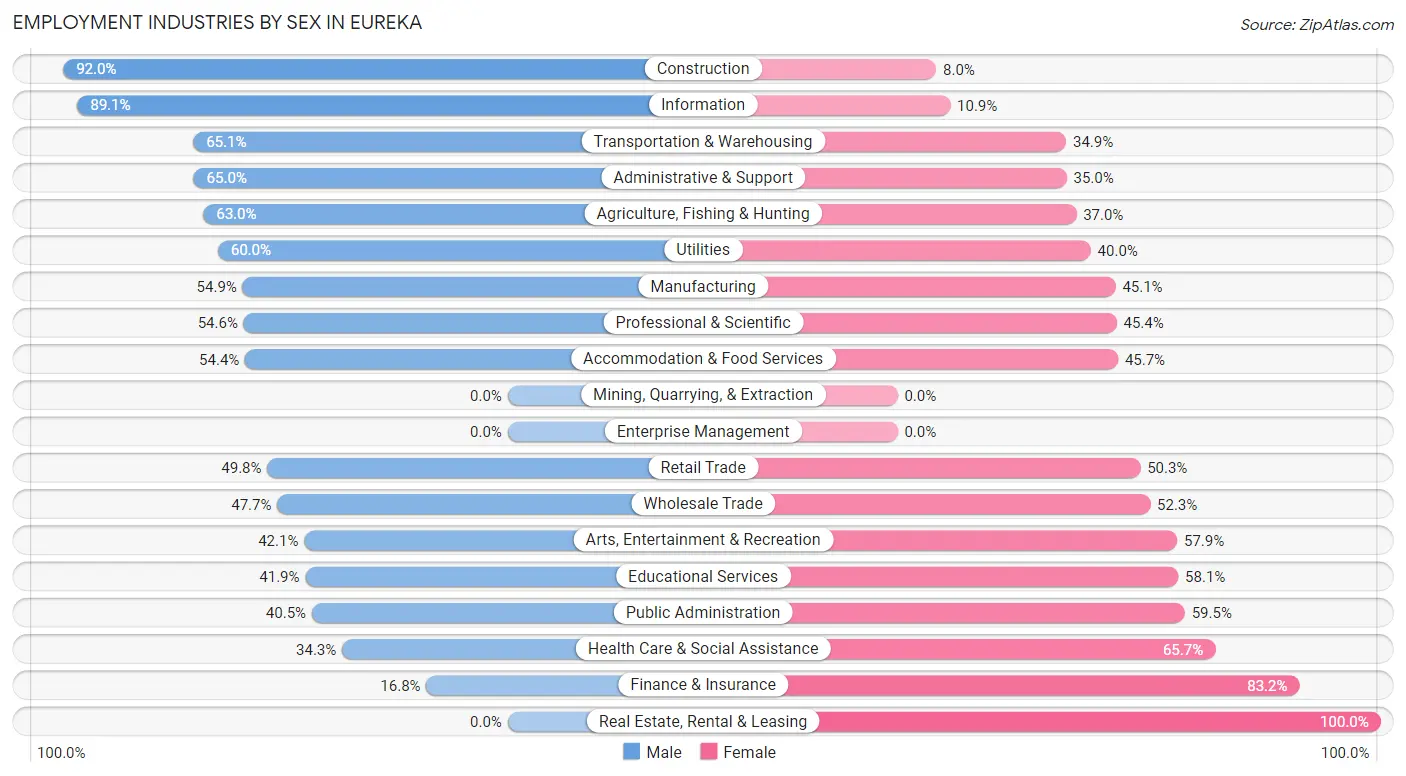
Employment Industries by Sex in Eureka
The Eureka industries that see more men than women are Construction (92.0%), Information (89.1%), and Transportation & Warehousing (65.1%), whereas the industries that tend to have a higher number of women are Real Estate, Rental & Leasing (100.0%), Finance & Insurance (83.2%), and Health Care & Social Assistance (65.7%).
| Industry | Male | Female |
| Agriculture, Fishing & Hunting | 349 (63.0%) | 205 (37.0%) |
| Mining, Quarrying, & Extraction | 0 (0.0%) | 0 (0.0%) |
| Construction | 713 (92.0%) | 62 (8.0%) |
| Manufacturing | 276 (54.9%) | 227 (45.1%) |
| Wholesale Trade | 114 (47.7%) | 125 (52.3%) |
| Retail Trade | 888 (49.7%) | 897 (50.2%) |
| Transportation & Warehousing | 220 (65.1%) | 118 (34.9%) |
| Utilities | 54 (60.0%) | 36 (40.0%) |
| Information | 147 (89.1%) | 18 (10.9%) |
| Finance & Insurance | 34 (16.8%) | 168 (83.2%) |
| Real Estate, Rental & Leasing | 0 (0.0%) | 74 (100.0%) |
| Professional & Scientific | 300 (54.6%) | 249 (45.4%) |
| Enterprise Management | 0 (0.0%) | 0 (0.0%) |
| Administrative & Support | 234 (65.0%) | 126 (35.0%) |
| Educational Services | 465 (41.9%) | 645 (58.1%) |
| Health Care & Social Assistance | 711 (34.3%) | 1,363 (65.7%) |
| Arts, Entertainment & Recreation | 155 (42.1%) | 213 (57.9%) |
| Accommodation & Food Services | 687 (54.3%) | 577 (45.7%) |
| Public Administration | 379 (40.5%) | 556 (59.5%) |
| Total | 5,940 (48.4%) | 6,336 (51.6%) |
Education in Eureka
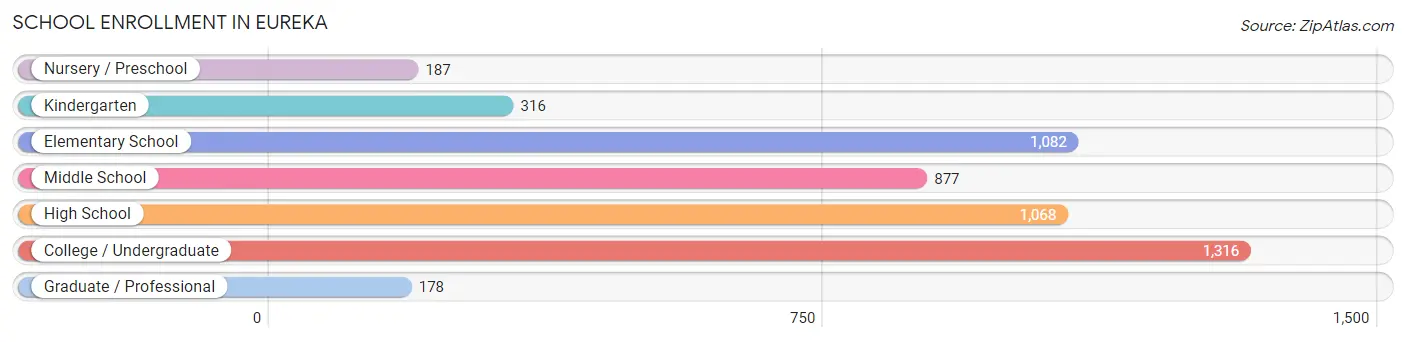
School Enrollment in Eureka
The most common levels of schooling among the 5,024 students in Eureka are college / undergraduate (1,316 | 26.2%), elementary school (1,082 | 21.5%), and high school (1,068 | 21.3%).
| School Level | # Students | % Students |
| Nursery / Preschool | 187 | 3.7% |
| Kindergarten | 316 | 6.3% |
| Elementary School | 1,082 | 21.5% |
| Middle School | 877 | 17.5% |
| High School | 1,068 | 21.3% |
| College / Undergraduate | 1,316 | 26.2% |
| Graduate / Professional | 178 | 3.5% |
| Total | 5,024 | 100.0% |
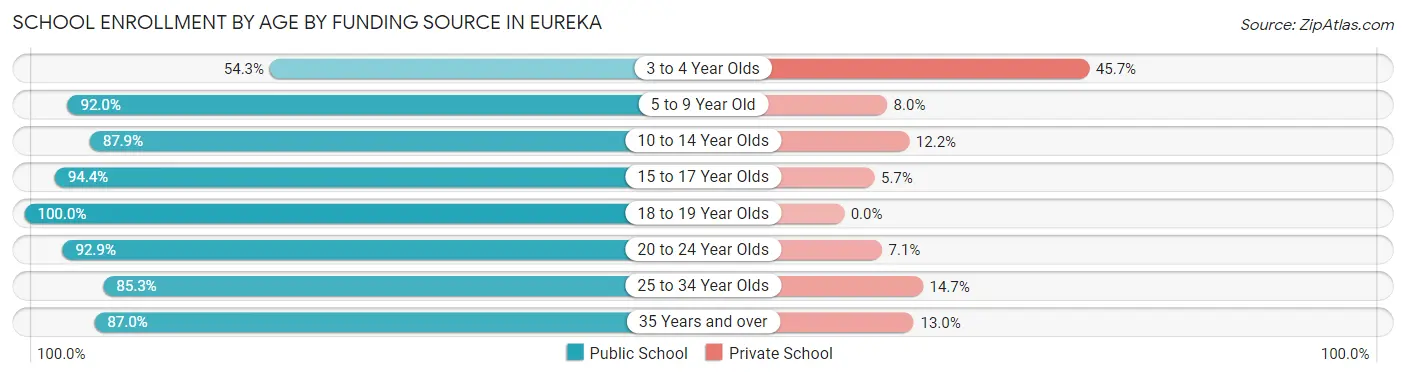
School Enrollment by Age by Funding Source in Eureka
Out of a total of 5,024 students who are enrolled in schools in Eureka, 487 (9.7%) attend a private institution, while the remaining 4,537 (90.3%) are enrolled in public schools. The age group of 3 to 4 year olds has the highest likelihood of being enrolled in private schools, with 74 (45.7% in the age bracket) enrolled. Conversely, the age group of 18 to 19 year olds has the lowest likelihood of being enrolled in a private school, with 418 (100.0% in the age bracket) attending a public institution.
| Age Bracket | Public School | Private School |
| 3 to 4 Year Olds | 88 (54.3%) | 74 (45.7%) |
| 5 to 9 Year Old | 1,194 (92.0%) | 104 (8.0%) |
| 10 to 14 Year Olds | 1,027 (87.8%) | 142 (12.1%) |
| 15 to 17 Year Olds | 702 (94.4%) | 42 (5.7%) |
| 18 to 19 Year Olds | 418 (100.0%) | 0 (0.0%) |
| 20 to 24 Year Olds | 671 (92.9%) | 51 (7.1%) |
| 25 to 34 Year Olds | 331 (85.3%) | 57 (14.7%) |
| 35 Years and over | 107 (87.0%) | 16 (13.0%) |
| Total | 4,537 (90.3%) | 487 (9.7%) |
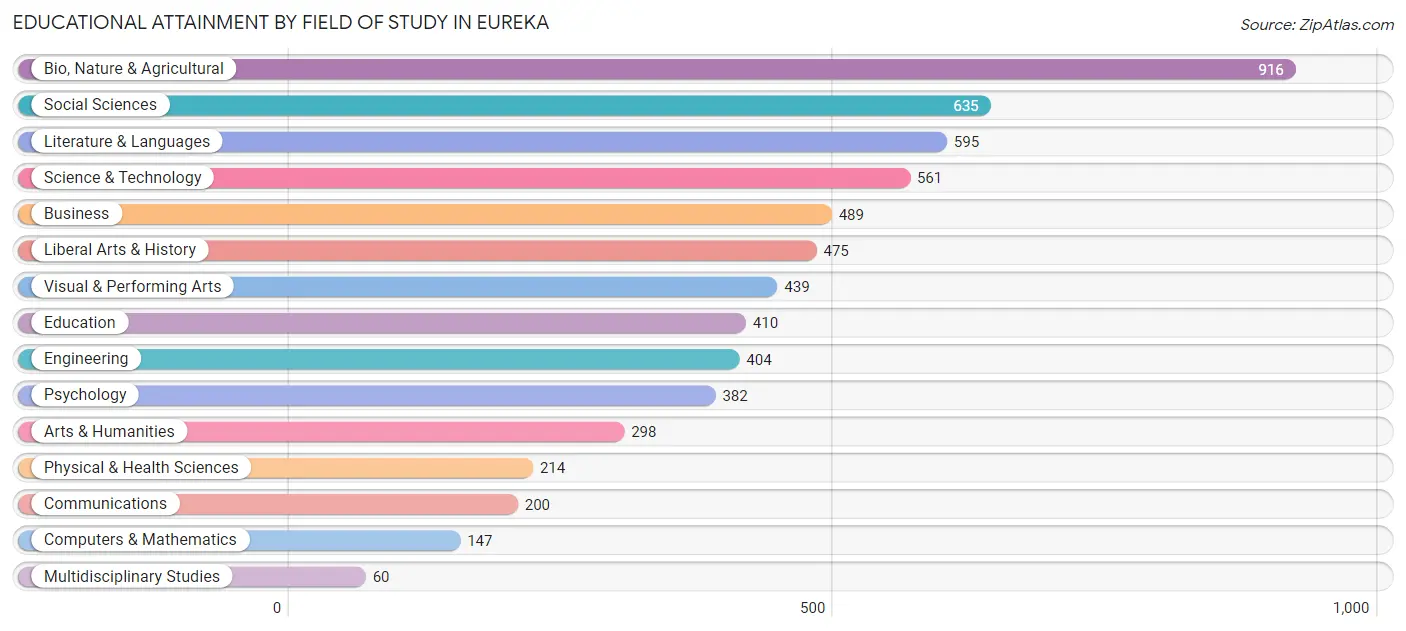
Educational Attainment by Field of Study in Eureka
Bio, nature & agricultural (916 | 14.7%), social sciences (635 | 10.2%), literature & languages (595 | 9.6%), science & technology (561 | 9.0%), and business (489 | 7.9%) are the most common fields of study among 6,225 individuals in Eureka who have obtained a bachelor's degree or higher.
| Field of Study | # Graduates | % Graduates |
| Computers & Mathematics | 147 | 2.4% |
| Bio, Nature & Agricultural | 916 | 14.7% |
| Physical & Health Sciences | 214 | 3.4% |
| Psychology | 382 | 6.1% |
| Social Sciences | 635 | 10.2% |
| Engineering | 404 | 6.5% |
| Multidisciplinary Studies | 60 | 1.0% |
| Science & Technology | 561 | 9.0% |
| Business | 489 | 7.9% |
| Education | 410 | 6.6% |
| Literature & Languages | 595 | 9.6% |
| Liberal Arts & History | 475 | 7.6% |
| Visual & Performing Arts | 439 | 7.0% |
| Communications | 200 | 3.2% |
| Arts & Humanities | 298 | 4.8% |
| Total | 6,225 | 100.0% |
Transportation & Commute in Eureka
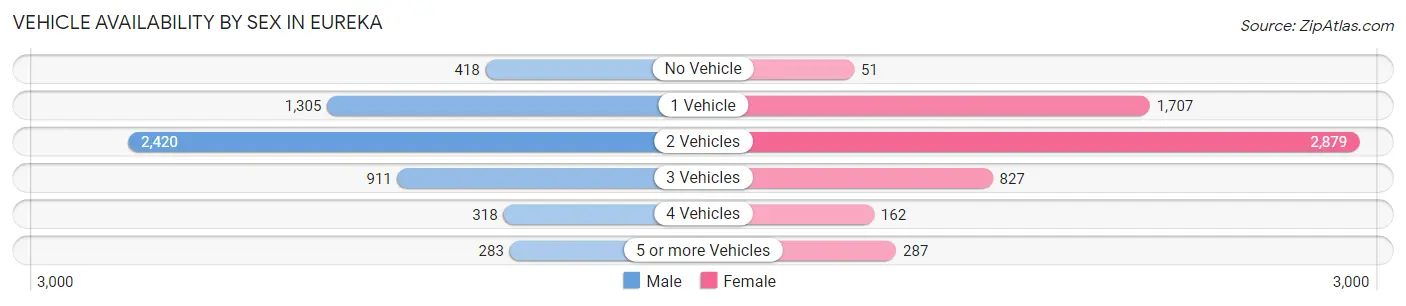
Vehicle Availability by Sex in Eureka
The most prevalent vehicle ownership categories in Eureka are males with 2 vehicles (2,420, accounting for 42.8%) and females with 2 vehicles (2,879, making up 40.9%).
| Vehicles Available | Male | Female |
| No Vehicle | 418 (7.4%) | 51 (0.9%) |
| 1 Vehicle | 1,305 (23.1%) | 1,707 (28.9%) |
| 2 Vehicles | 2,420 (42.8%) | 2,879 (48.7%) |
| 3 Vehicles | 911 (16.1%) | 827 (14.0%) |
| 4 Vehicles | 318 (5.6%) | 162 (2.7%) |
| 5 or more Vehicles | 283 (5.0%) | 287 (4.9%) |
| Total | 5,655 (100.0%) | 5,913 (100.0%) |
Commute Time in Eureka
The most frequently occuring commute durations in Eureka are 5 to 9 minutes (3,335 commuters, 31.2%), 10 to 14 minutes (1,839 commuters, 17.2%), and 15 to 19 minutes (1,530 commuters, 14.3%).
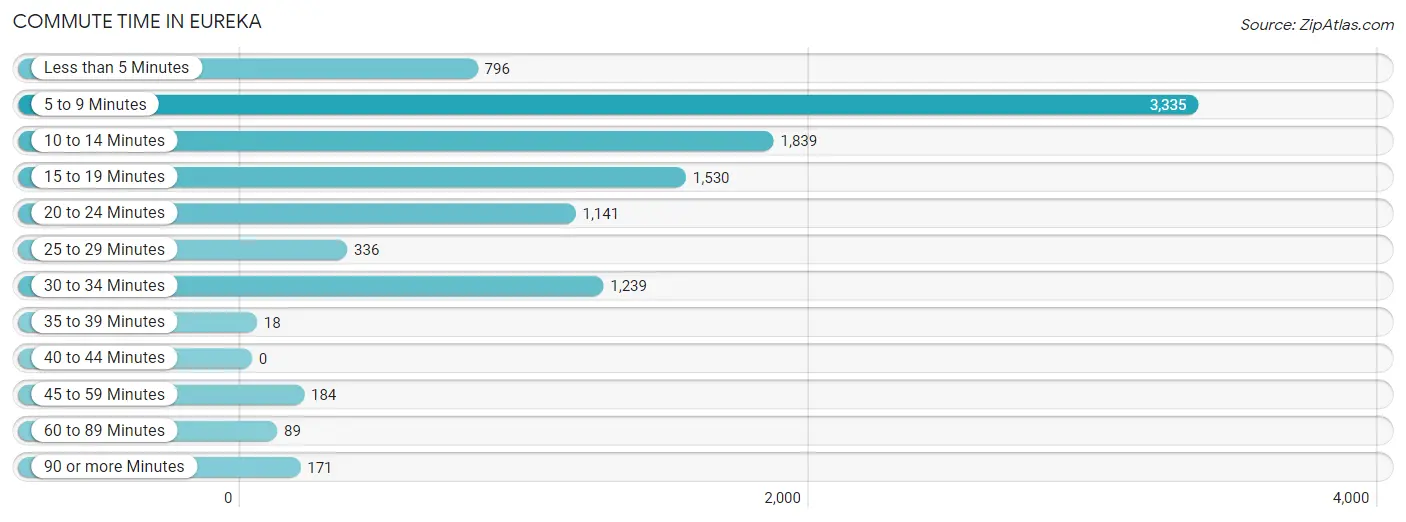
| Commute Time | # Commuters | % Commuters |
| Less than 5 Minutes | 796 | 7.4% |
| 5 to 9 Minutes | 3,335 | 31.2% |
| 10 to 14 Minutes | 1,839 | 17.2% |
| 15 to 19 Minutes | 1,530 | 14.3% |
| 20 to 24 Minutes | 1,141 | 10.7% |
| 25 to 29 Minutes | 336 | 3.2% |
| 30 to 34 Minutes | 1,239 | 11.6% |
| 35 to 39 Minutes | 18 | 0.2% |
| 40 to 44 Minutes | 0 | 0.0% |
| 45 to 59 Minutes | 184 | 1.7% |
| 60 to 89 Minutes | 89 | 0.8% |
| 90 or more Minutes | 171 | 1.6% |
Commute Time by Sex in Eureka
The most common commute times in Eureka are 5 to 9 minutes (1,658 commuters, 30.7%) for males and 5 to 9 minutes (1,677 commuters, 31.8%) for females.
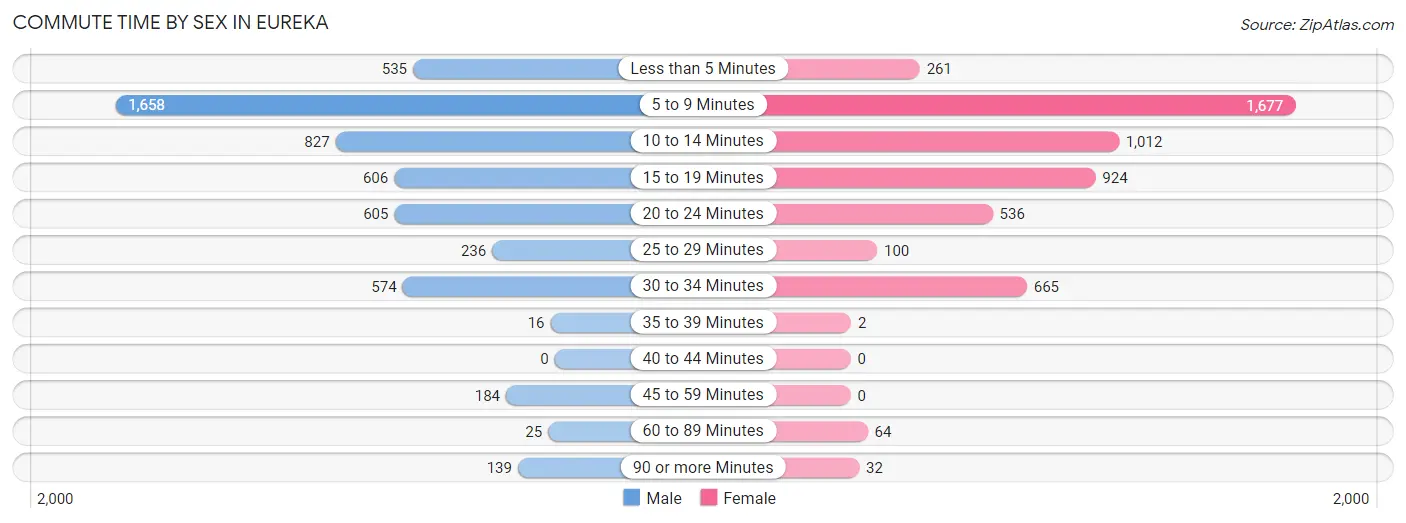
| Commute Time | Male | Female |
| Less than 5 Minutes | 535 (9.9%) | 261 (5.0%) |
| 5 to 9 Minutes | 1,658 (30.7%) | 1,677 (31.8%) |
| 10 to 14 Minutes | 827 (15.3%) | 1,012 (19.2%) |
| 15 to 19 Minutes | 606 (11.2%) | 924 (17.5%) |
| 20 to 24 Minutes | 605 (11.2%) | 536 (10.2%) |
| 25 to 29 Minutes | 236 (4.4%) | 100 (1.9%) |
| 30 to 34 Minutes | 574 (10.6%) | 665 (12.6%) |
| 35 to 39 Minutes | 16 (0.3%) | 2 (0.0%) |
| 40 to 44 Minutes | 0 (0.0%) | 0 (0.0%) |
| 45 to 59 Minutes | 184 (3.4%) | 0 (0.0%) |
| 60 to 89 Minutes | 25 (0.5%) | 64 (1.2%) |
| 90 or more Minutes | 139 (2.6%) | 32 (0.6%) |
Time of Departure to Work by Sex in Eureka
The most frequent times of departure to work in Eureka are 8:00 AM to 8:29 AM (764, 14.1%) for males and 7:30 AM to 7:59 AM (1,456, 27.6%) for females.
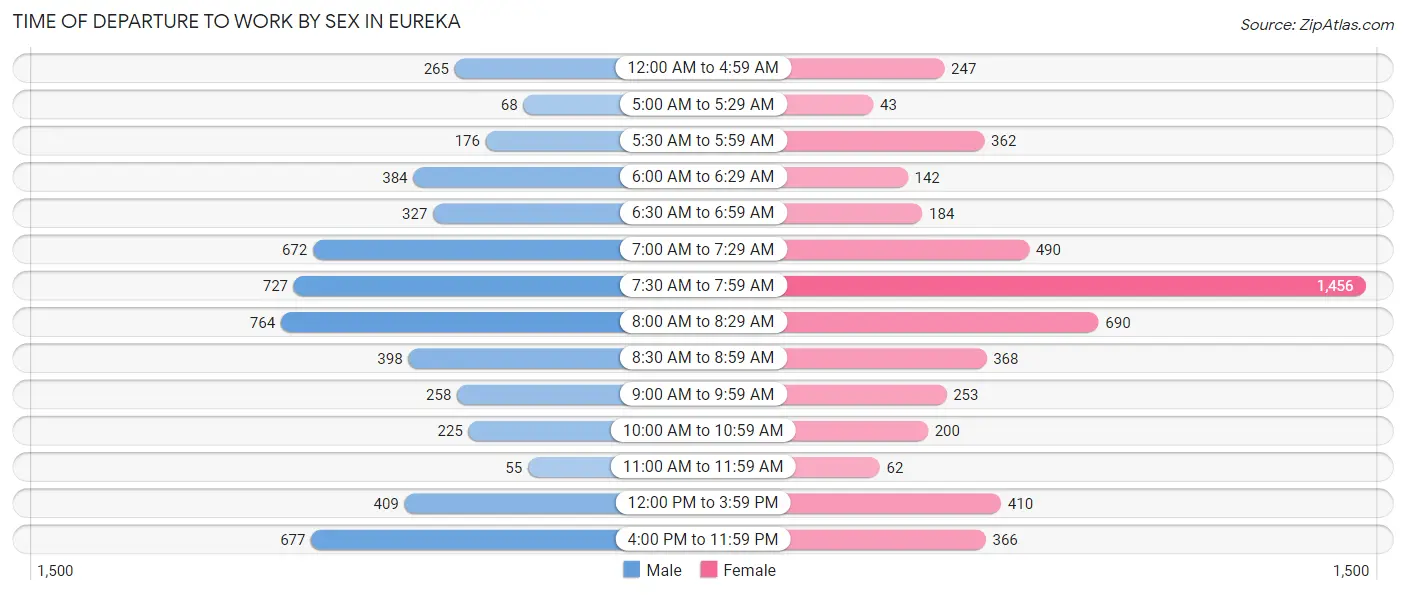
| Time of Departure | Male | Female |
| 12:00 AM to 4:59 AM | 265 (4.9%) | 247 (4.7%) |
| 5:00 AM to 5:29 AM | 68 (1.3%) | 43 (0.8%) |
| 5:30 AM to 5:59 AM | 176 (3.3%) | 362 (6.9%) |
| 6:00 AM to 6:29 AM | 384 (7.1%) | 142 (2.7%) |
| 6:30 AM to 6:59 AM | 327 (6.0%) | 184 (3.5%) |
| 7:00 AM to 7:29 AM | 672 (12.4%) | 490 (9.3%) |
| 7:30 AM to 7:59 AM | 727 (13.5%) | 1,456 (27.6%) |
| 8:00 AM to 8:29 AM | 764 (14.1%) | 690 (13.1%) |
| 8:30 AM to 8:59 AM | 398 (7.4%) | 368 (7.0%) |
| 9:00 AM to 9:59 AM | 258 (4.8%) | 253 (4.8%) |
| 10:00 AM to 10:59 AM | 225 (4.2%) | 200 (3.8%) |
| 11:00 AM to 11:59 AM | 55 (1.0%) | 62 (1.2%) |
| 12:00 PM to 3:59 PM | 409 (7.6%) | 410 (7.8%) |
| 4:00 PM to 11:59 PM | 677 (12.5%) | 366 (6.9%) |
| Total | 5,405 (100.0%) | 5,273 (100.0%) |
Housing Occupancy in Eureka
Occupancy by Ownership in Eureka
Of the total 10,905 dwellings in Eureka, owner-occupied units account for 5,293 (48.5%), while renter-occupied units make up 5,612 (51.5%).
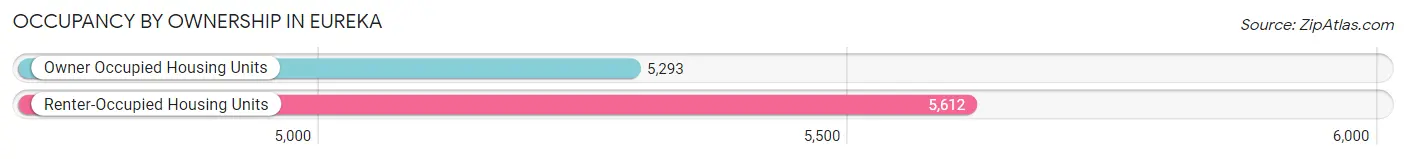
| Occupancy | # Housing Units | % Housing Units |
| Owner Occupied Housing Units | 5,293 | 48.5% |
| Renter-Occupied Housing Units | 5,612 | 51.5% |
| Total Occupied Housing Units | 10,905 | 100.0% |
Occupancy by Household Size in Eureka
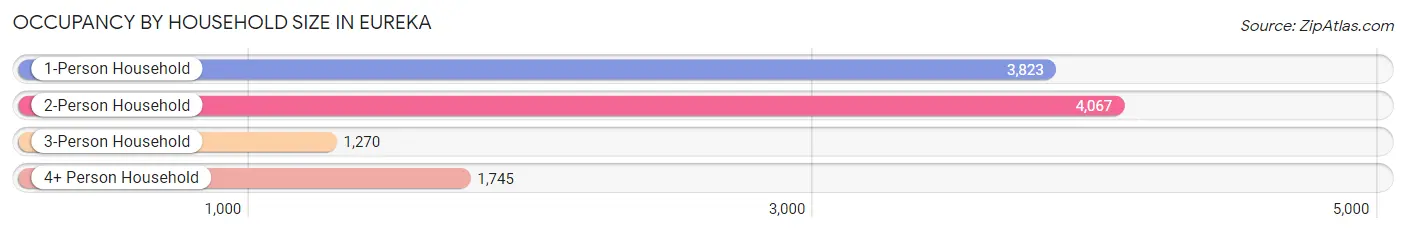
| Household Size | # Housing Units | % Housing Units |
| 1-Person Household | 3,823 | 35.1% |
| 2-Person Household | 4,067 | 37.3% |
| 3-Person Household | 1,270 | 11.7% |
| 4+ Person Household | 1,745 | 16.0% |
| Total Housing Units | 10,905 | 100.0% |
Occupancy by Ownership by Household Size in Eureka
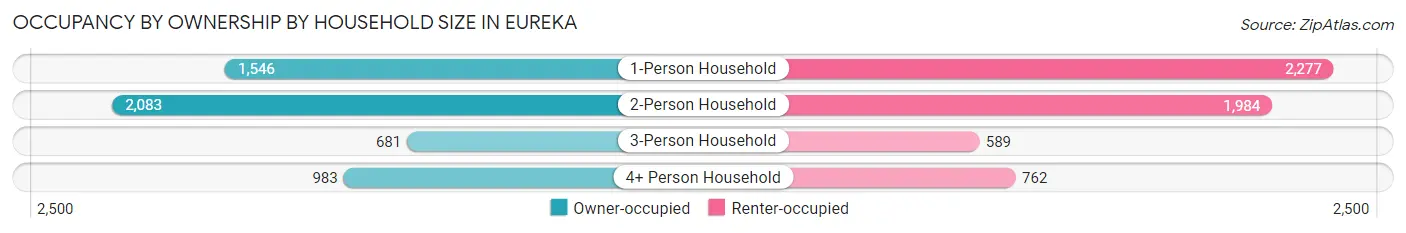
| Household Size | Owner-occupied | Renter-occupied |
| 1-Person Household | 1,546 (40.4%) | 2,277 (59.6%) |
| 2-Person Household | 2,083 (51.2%) | 1,984 (48.8%) |
| 3-Person Household | 681 (53.6%) | 589 (46.4%) |
| 4+ Person Household | 983 (56.3%) | 762 (43.7%) |
| Total Housing Units | 5,293 (48.5%) | 5,612 (51.5%) |
Occupancy by Educational Attainment in Eureka
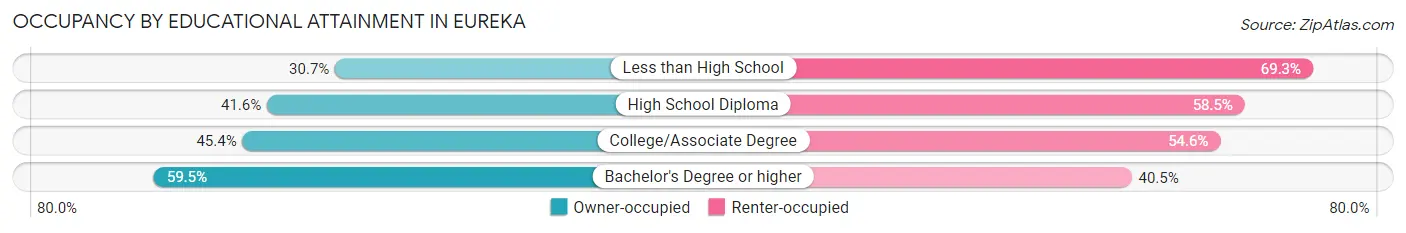
| Household Size | Owner-occupied | Renter-occupied |
| Less than High School | 273 (30.7%) | 615 (69.3%) |
| High School Diploma | 770 (41.5%) | 1,083 (58.5%) |
| College/Associate Degree | 1,964 (45.4%) | 2,358 (54.6%) |
| Bachelor's Degree or higher | 2,286 (59.5%) | 1,556 (40.5%) |
Occupancy by Age of Householder in Eureka
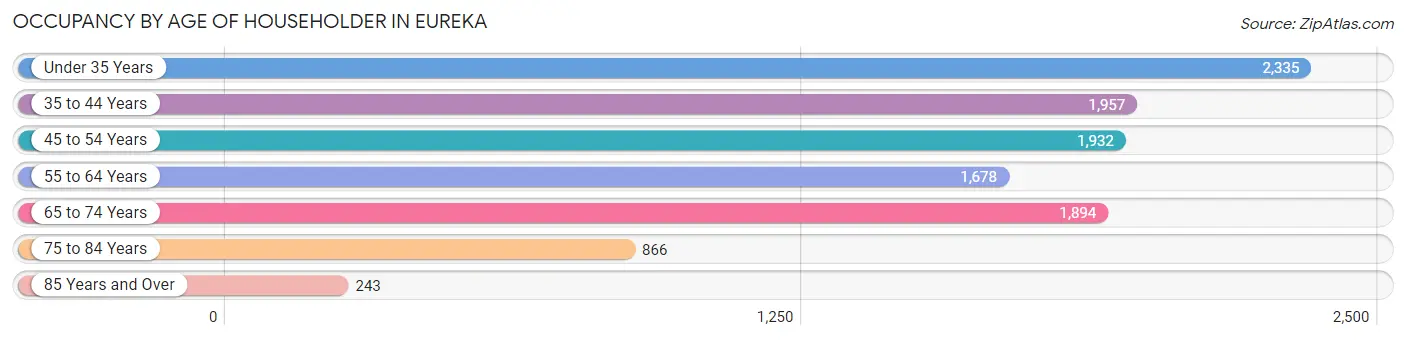
| Age Bracket | # Households | % Households |
| Under 35 Years | 2,335 | 21.4% |
| 35 to 44 Years | 1,957 | 17.9% |
| 45 to 54 Years | 1,932 | 17.7% |
| 55 to 64 Years | 1,678 | 15.4% |
| 65 to 74 Years | 1,894 | 17.4% |
| 75 to 84 Years | 866 | 7.9% |
| 85 Years and Over | 243 | 2.2% |
| Total | 10,905 | 100.0% |
Housing Finances in Eureka
Median Income by Occupancy in Eureka
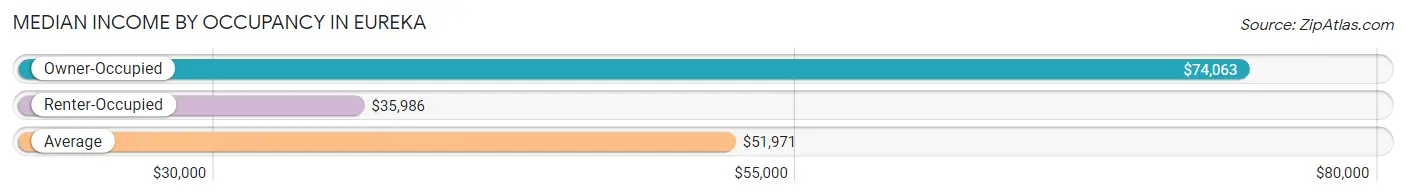
| Occupancy Type | # Households | Median Income |
| Owner-Occupied | 5,293 (48.5%) | $74,063 |
| Renter-Occupied | 5,612 (51.5%) | $35,986 |
| Average | 10,905 (100.0%) | $51,971 |
Occupancy by Householder Income Bracket in Eureka
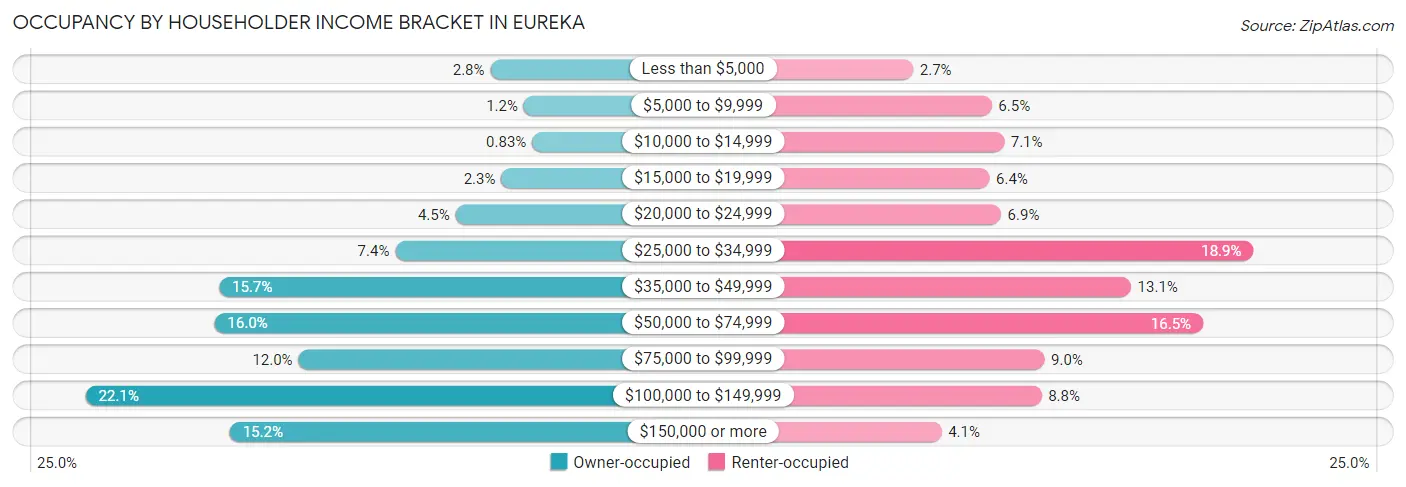
| Income Bracket | Owner-occupied | Renter-occupied |
| Less than $5,000 | 149 (2.8%) | 153 (2.7%) |
| $5,000 to $9,999 | 65 (1.2%) | 363 (6.5%) |
| $10,000 to $14,999 | 44 (0.8%) | 396 (7.1%) |
| $15,000 to $19,999 | 122 (2.3%) | 357 (6.4%) |
| $20,000 to $24,999 | 237 (4.5%) | 388 (6.9%) |
| $25,000 to $34,999 | 389 (7.3%) | 1,063 (18.9%) |
| $35,000 to $49,999 | 833 (15.7%) | 735 (13.1%) |
| $50,000 to $74,999 | 845 (16.0%) | 928 (16.5%) |
| $75,000 to $99,999 | 633 (12.0%) | 504 (9.0%) |
| $100,000 to $149,999 | 1,170 (22.1%) | 496 (8.8%) |
| $150,000 or more | 806 (15.2%) | 229 (4.1%) |
| Total | 5,293 (100.0%) | 5,612 (100.0%) |
Monthly Housing Cost Tiers in Eureka
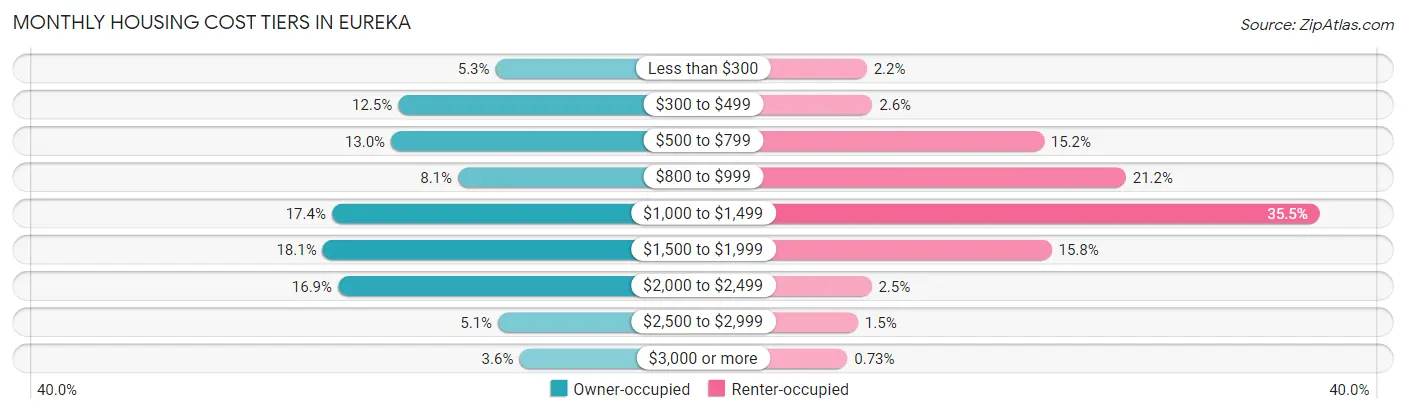
| Monthly Cost | Owner-occupied | Renter-occupied |
| Less than $300 | 282 (5.3%) | 121 (2.2%) |
| $300 to $499 | 661 (12.5%) | 144 (2.6%) |
| $500 to $799 | 689 (13.0%) | 853 (15.2%) |
| $800 to $999 | 428 (8.1%) | 1,192 (21.2%) |
| $1,000 to $1,499 | 920 (17.4%) | 1,993 (35.5%) |
| $1,500 to $1,999 | 956 (18.1%) | 885 (15.8%) |
| $2,000 to $2,499 | 896 (16.9%) | 141 (2.5%) |
| $2,500 to $2,999 | 272 (5.1%) | 85 (1.5%) |
| $3,000 or more | 189 (3.6%) | 41 (0.7%) |
| Total | 5,293 (100.0%) | 5,612 (100.0%) |
Physical Housing Characteristics in Eureka
Housing Structures in Eureka
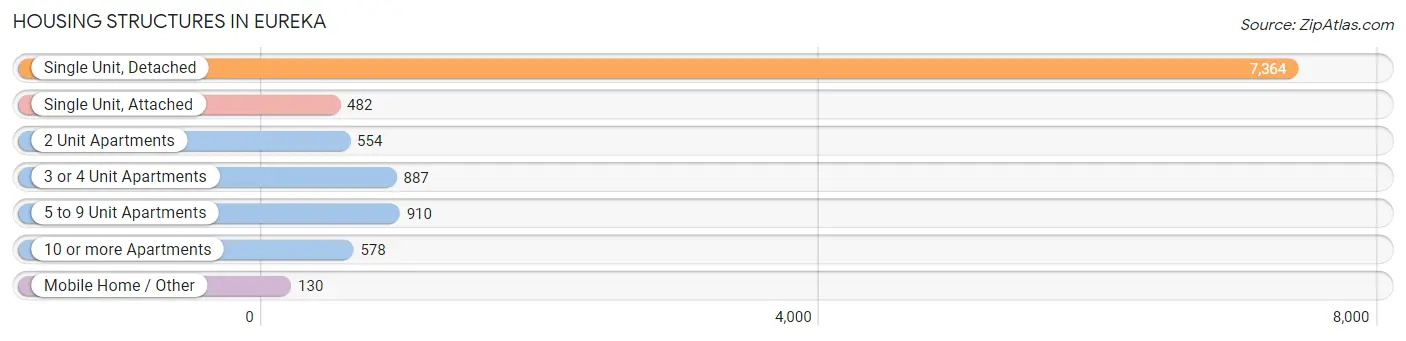
| Structure Type | # Housing Units | % Housing Units |
| Single Unit, Detached | 7,364 | 67.5% |
| Single Unit, Attached | 482 | 4.4% |
| 2 Unit Apartments | 554 | 5.1% |
| 3 or 4 Unit Apartments | 887 | 8.1% |
| 5 to 9 Unit Apartments | 910 | 8.3% |
| 10 or more Apartments | 578 | 5.3% |
| Mobile Home / Other | 130 | 1.2% |
| Total | 10,905 | 100.0% |
Housing Structures by Occupancy in Eureka
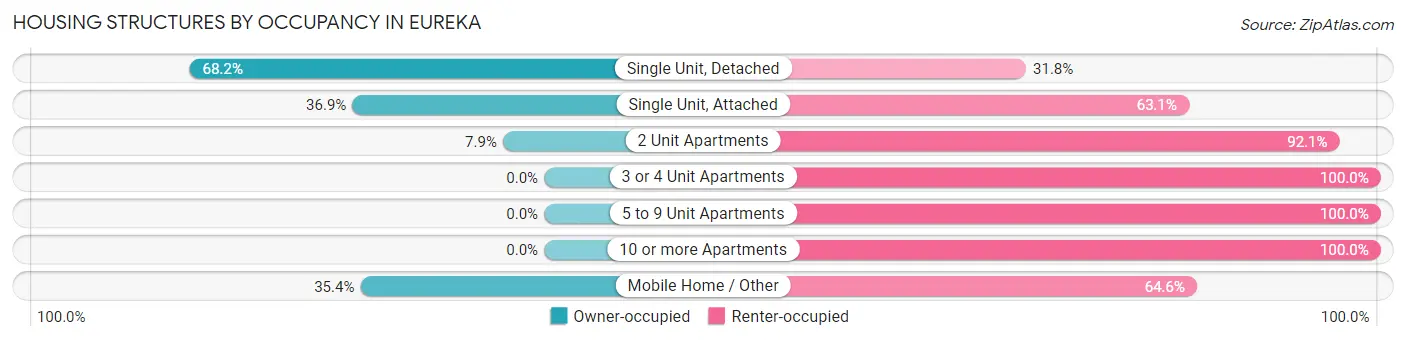
| Structure Type | Owner-occupied | Renter-occupied |
| Single Unit, Detached | 5,025 (68.2%) | 2,339 (31.8%) |
| Single Unit, Attached | 178 (36.9%) | 304 (63.1%) |
| 2 Unit Apartments | 44 (7.9%) | 510 (92.1%) |
| 3 or 4 Unit Apartments | 0 (0.0%) | 887 (100.0%) |
| 5 to 9 Unit Apartments | 0 (0.0%) | 910 (100.0%) |
| 10 or more Apartments | 0 (0.0%) | 578 (100.0%) |
| Mobile Home / Other | 46 (35.4%) | 84 (64.6%) |
| Total | 5,293 (48.5%) | 5,612 (51.5%) |
Housing Structures by Number of Rooms in Eureka
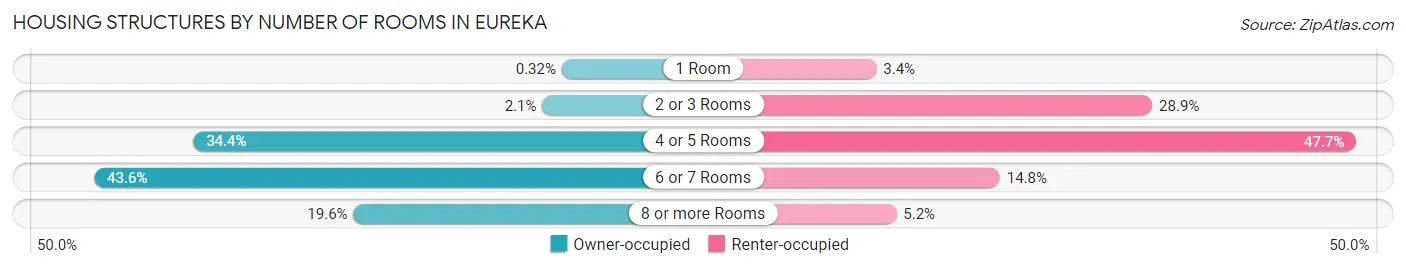
| Number of Rooms | Owner-occupied | Renter-occupied |
| 1 Room | 17 (0.3%) | 189 (3.4%) |
| 2 or 3 Rooms | 112 (2.1%) | 1,621 (28.9%) |
| 4 or 5 Rooms | 1,821 (34.4%) | 2,679 (47.7%) |
| 6 or 7 Rooms | 2,306 (43.6%) | 830 (14.8%) |
| 8 or more Rooms | 1,037 (19.6%) | 293 (5.2%) |
| Total | 5,293 (100.0%) | 5,612 (100.0%) |
Housing Structure by Heating Type in Eureka
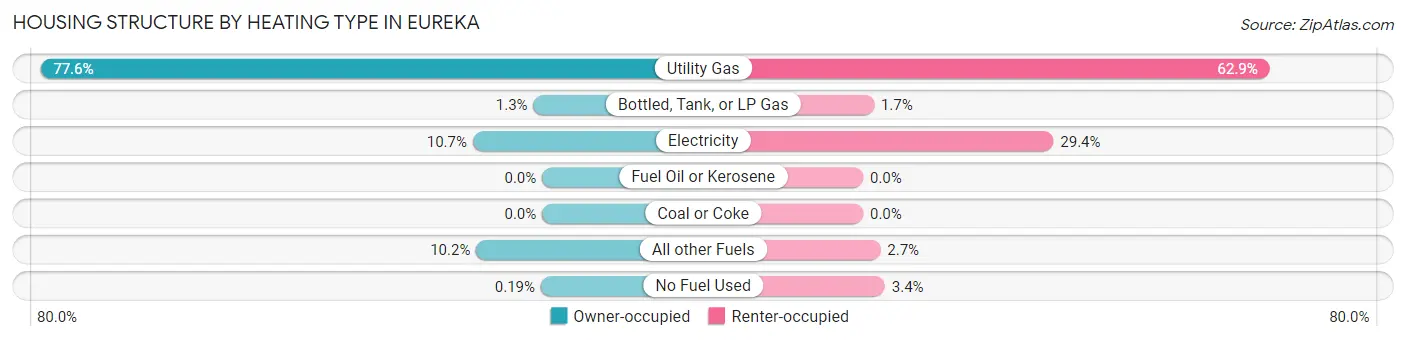
| Heating Type | Owner-occupied | Renter-occupied |
| Utility Gas | 4,106 (77.6%) | 3,527 (62.8%) |
| Bottled, Tank, or LP Gas | 71 (1.3%) | 95 (1.7%) |
| Electricity | 567 (10.7%) | 1,651 (29.4%) |
| Fuel Oil or Kerosene | 0 (0.0%) | 0 (0.0%) |
| Coal or Coke | 0 (0.0%) | 0 (0.0%) |
| All other Fuels | 539 (10.2%) | 150 (2.7%) |
| No Fuel Used | 10 (0.2%) | 189 (3.4%) |
| Total | 5,293 (100.0%) | 5,612 (100.0%) |
Household Vehicle Usage in Eureka
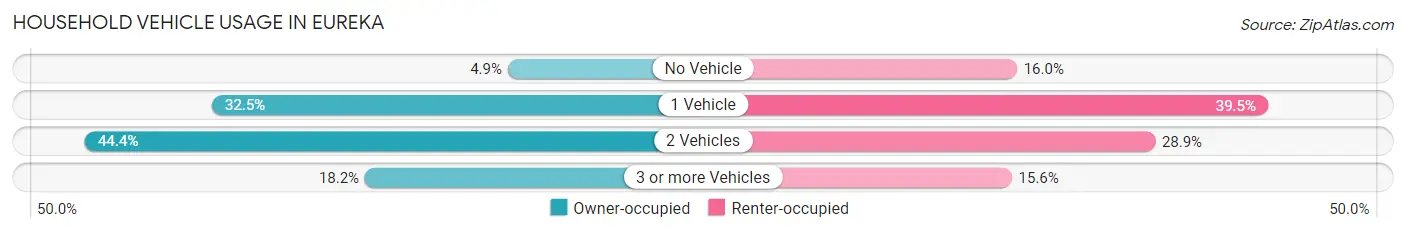
| Vehicles per Household | Owner-occupied | Renter-occupied |
| No Vehicle | 259 (4.9%) | 900 (16.0%) |
| 1 Vehicle | 1,721 (32.5%) | 2,215 (39.5%) |
| 2 Vehicles | 2,348 (44.4%) | 1,624 (28.9%) |
| 3 or more Vehicles | 965 (18.2%) | 873 (15.6%) |
| Total | 5,293 (100.0%) | 5,612 (100.0%) |
Real Estate & Mortgages in Eureka
Real Estate and Mortgage Overview in Eureka
| Characteristic | Without Mortgage | With Mortgage |
| Housing Units | 1,791 | 3,502 |
| Median Property Value | $328,200 | $357,000 |
| Median Household Income | $49,684 | $580 |
| Monthly Housing Costs | $486 | $189 |
| Real Estate Taxes | $1,800 | $46 |
Property Value by Mortgage Status in Eureka
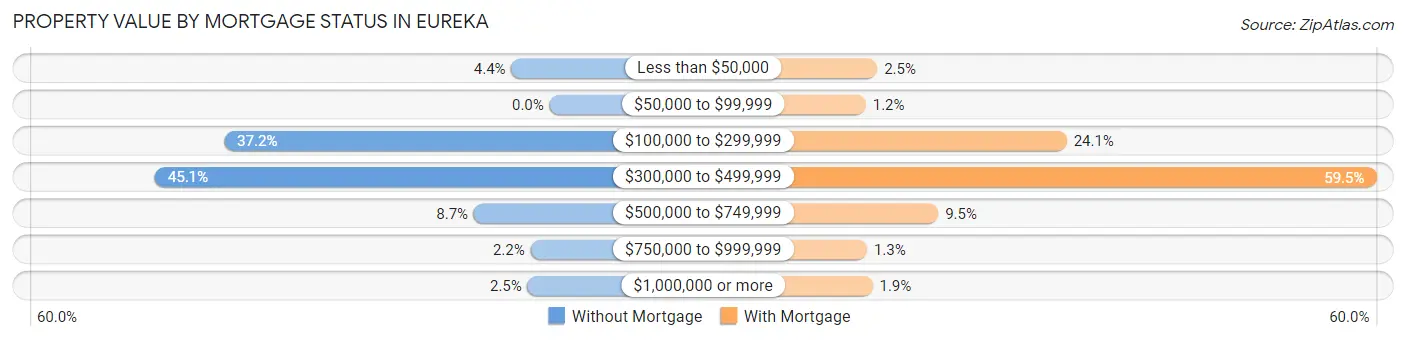
| Property Value | Without Mortgage | With Mortgage |
| Less than $50,000 | 78 (4.4%) | 87 (2.5%) |
| $50,000 to $99,999 | 0 (0.0%) | 41 (1.2%) |
| $100,000 to $299,999 | 666 (37.2%) | 845 (24.1%) |
| $300,000 to $499,999 | 808 (45.1%) | 2,084 (59.5%) |
| $500,000 to $749,999 | 155 (8.6%) | 331 (9.5%) |
| $750,000 to $999,999 | 39 (2.2%) | 46 (1.3%) |
| $1,000,000 or more | 45 (2.5%) | 68 (1.9%) |
| Total | 1,791 (100.0%) | 3,502 (100.0%) |
Household Income by Mortgage Status in Eureka
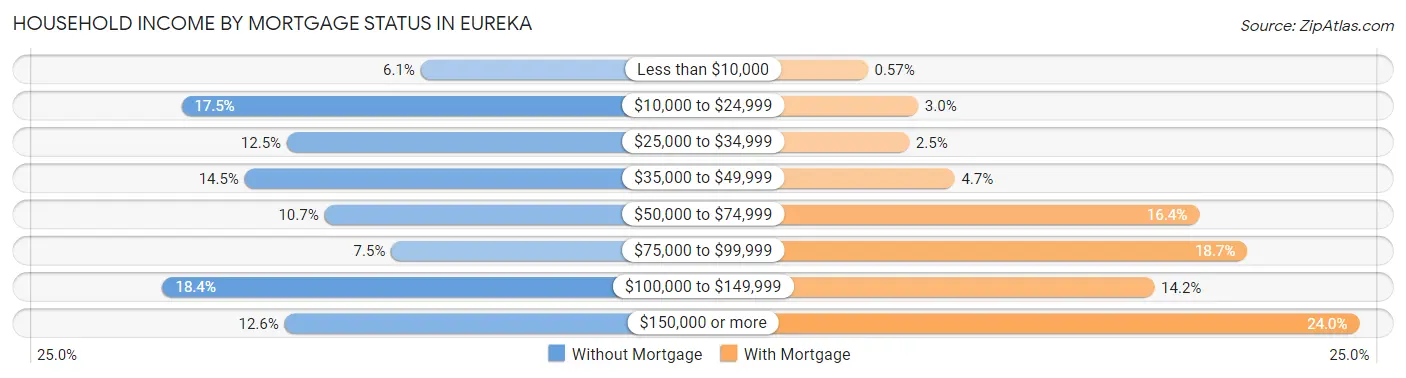
| Household Income | Without Mortgage | With Mortgage |
| Less than $10,000 | 110 (6.1%) | 20 (0.6%) |
| $10,000 to $24,999 | 314 (17.5%) | 104 (3.0%) |
| $25,000 to $34,999 | 224 (12.5%) | 89 (2.5%) |
| $35,000 to $49,999 | 260 (14.5%) | 165 (4.7%) |
| $50,000 to $74,999 | 192 (10.7%) | 573 (16.4%) |
| $75,000 to $99,999 | 135 (7.5%) | 653 (18.6%) |
| $100,000 to $149,999 | 330 (18.4%) | 498 (14.2%) |
| $150,000 or more | 226 (12.6%) | 840 (24.0%) |
| Total | 1,791 (100.0%) | 3,502 (100.0%) |
Property Value to Household Income Ratio in Eureka
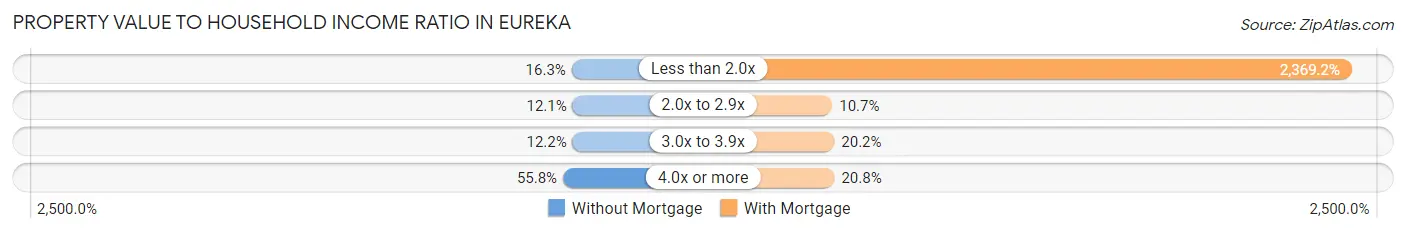
| Value-to-Income Ratio | Without Mortgage | With Mortgage |
| Less than 2.0x | 292 (16.3%) | 82,969 (2,369.2%) |
| 2.0x to 2.9x | 217 (12.1%) | 373 (10.6%) |
| 3.0x to 3.9x | 219 (12.2%) | 706 (20.2%) |
| 4.0x or more | 1,000 (55.8%) | 727 (20.8%) |
| Total | 1,791 (100.0%) | 3,502 (100.0%) |
Real Estate Taxes by Mortgage Status in Eureka
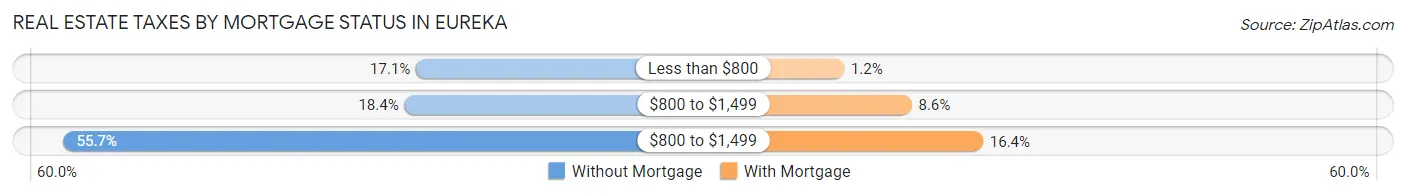
| Property Taxes | Without Mortgage | With Mortgage |
| Less than $800 | 306 (17.1%) | 42 (1.2%) |
| $800 to $1,499 | 329 (18.4%) | 301 (8.6%) |
| $800 to $1,499 | 998 (55.7%) | 575 (16.4%) |
| Total | 1,791 (100.0%) | 3,502 (100.0%) |
Health & Disability in Eureka
Health Insurance Coverage by Age in Eureka
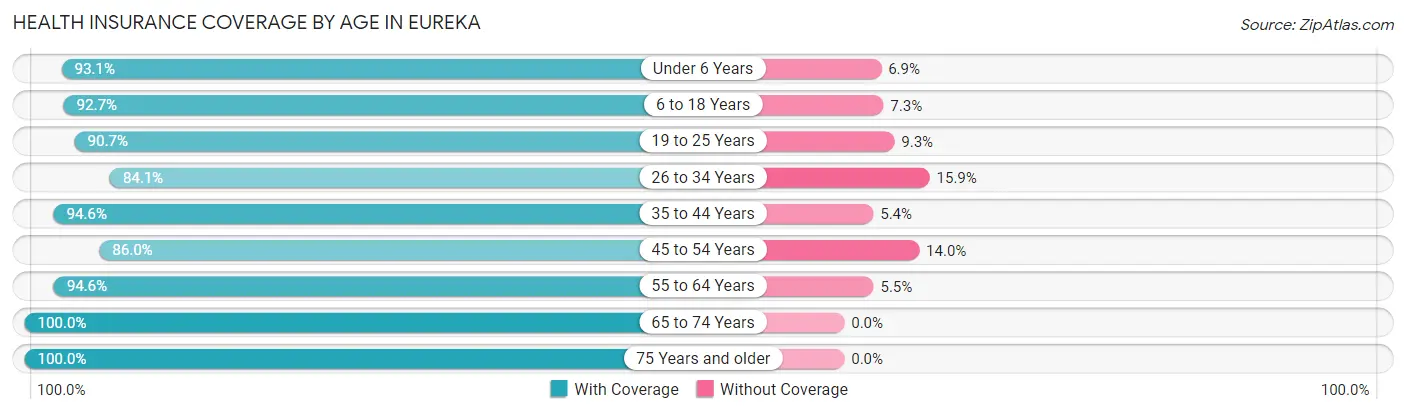
| Age Bracket | With Coverage | Without Coverage |
| Under 6 Years | 1,298 (93.1%) | 96 (6.9%) |
| 6 to 18 Years | 3,255 (92.7%) | 256 (7.3%) |
| 19 to 25 Years | 2,342 (90.7%) | 241 (9.3%) |
| 26 to 34 Years | 2,848 (84.1%) | 539 (15.9%) |
| 35 to 44 Years | 3,896 (94.6%) | 223 (5.4%) |
| 45 to 54 Years | 3,050 (86.0%) | 495 (14.0%) |
| 55 to 64 Years | 2,899 (94.6%) | 167 (5.4%) |
| 65 to 74 Years | 2,921 (100.0%) | 0 (0.0%) |
| 75 Years and older | 1,565 (100.0%) | 0 (0.0%) |
| Total | 24,074 (92.3%) | 2,017 (7.7%) |
Health Insurance Coverage by Citizenship Status in Eureka
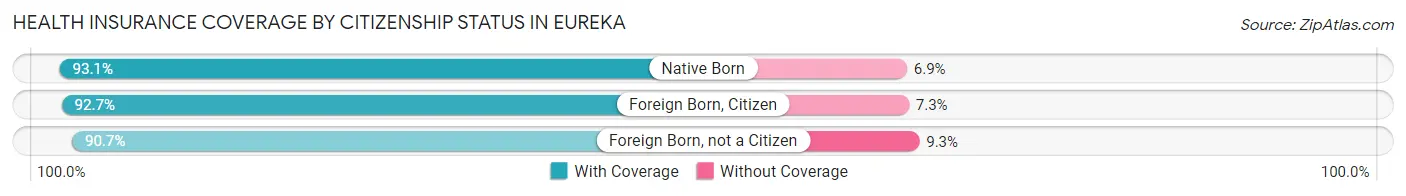
| Citizenship Status | With Coverage | Without Coverage |
| Native Born | 1,298 (93.1%) | 96 (6.9%) |
| Foreign Born, Citizen | 3,255 (92.7%) | 256 (7.3%) |
| Foreign Born, not a Citizen | 2,342 (90.7%) | 241 (9.3%) |
Health Insurance Coverage by Household Income in Eureka
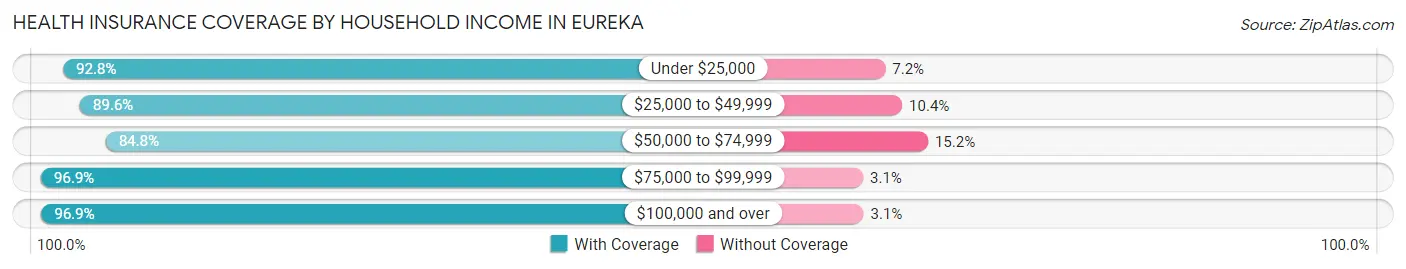
| Household Income | With Coverage | Without Coverage |
| Under $25,000 | 3,313 (92.8%) | 258 (7.2%) |
| $25,000 to $49,999 | 5,201 (89.6%) | 602 (10.4%) |
| $50,000 to $74,999 | 3,853 (84.8%) | 691 (15.2%) |
| $75,000 to $99,999 | 2,855 (96.9%) | 90 (3.1%) |
| $100,000 and over | 7,906 (96.9%) | 256 (3.1%) |
Public vs Private Health Insurance Coverage by Age in Eureka
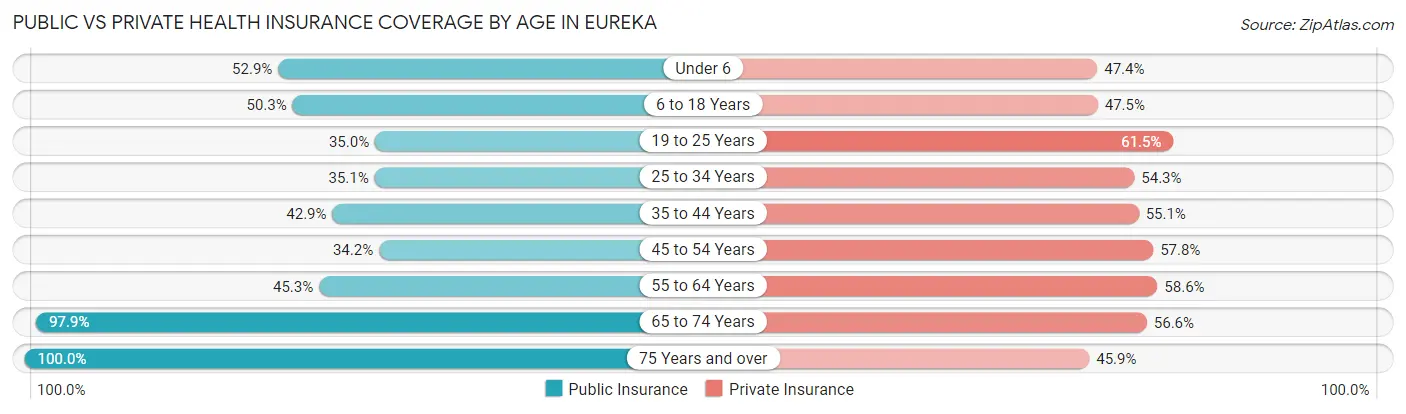
| Age Bracket | Public Insurance | Private Insurance |
| Under 6 | 738 (52.9%) | 661 (47.4%) |
| 6 to 18 Years | 1,765 (50.3%) | 1,668 (47.5%) |
| 19 to 25 Years | 903 (35.0%) | 1,589 (61.5%) |
| 25 to 34 Years | 1,187 (35.0%) | 1,839 (54.3%) |
| 35 to 44 Years | 1,766 (42.9%) | 2,270 (55.1%) |
| 45 to 54 Years | 1,213 (34.2%) | 2,049 (57.8%) |
| 55 to 64 Years | 1,390 (45.3%) | 1,796 (58.6%) |
| 65 to 74 Years | 2,859 (97.9%) | 1,654 (56.6%) |
| 75 Years and over | 1,565 (100.0%) | 719 (45.9%) |
| Total | 13,386 (51.3%) | 14,245 (54.6%) |
Disability Status by Sex by Age in Eureka
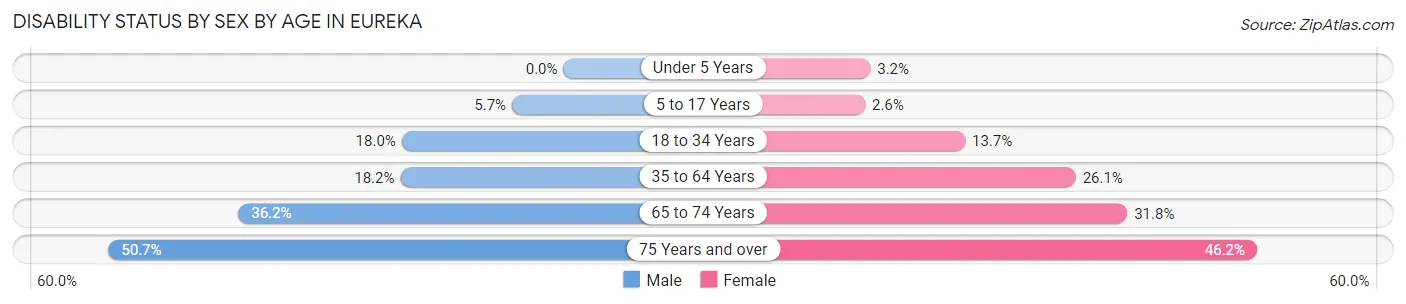
| Age Bracket | Male | Female |
| Under 5 Years | 0 (0.0%) | 23 (3.2%) |
| 5 to 17 Years | 119 (5.7%) | 33 (2.6%) |
| 18 to 34 Years | 534 (18.0%) | 465 (13.7%) |
| 35 to 64 Years | 999 (18.2%) | 1,362 (26.1%) |
| 65 to 74 Years | 488 (36.2%) | 500 (31.8%) |
| 75 Years and over | 304 (50.7%) | 446 (46.2%) |
Disability Class by Sex by Age in Eureka
Disability Class: Hearing Difficulty
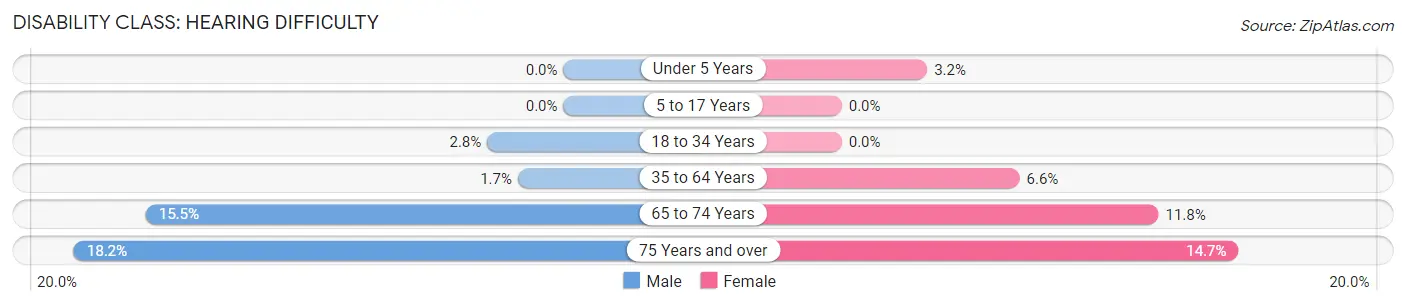
| Age Bracket | Male | Female |
| Under 5 Years | 0 (0.0%) | 23 (3.2%) |
| 5 to 17 Years | 0 (0.0%) | 0 (0.0%) |
| 18 to 34 Years | 84 (2.8%) | 0 (0.0%) |
| 35 to 64 Years | 93 (1.7%) | 345 (6.6%) |
| 65 to 74 Years | 209 (15.5%) | 185 (11.8%) |
| 75 Years and over | 109 (18.2%) | 142 (14.7%) |
Disability Class: Vision Difficulty
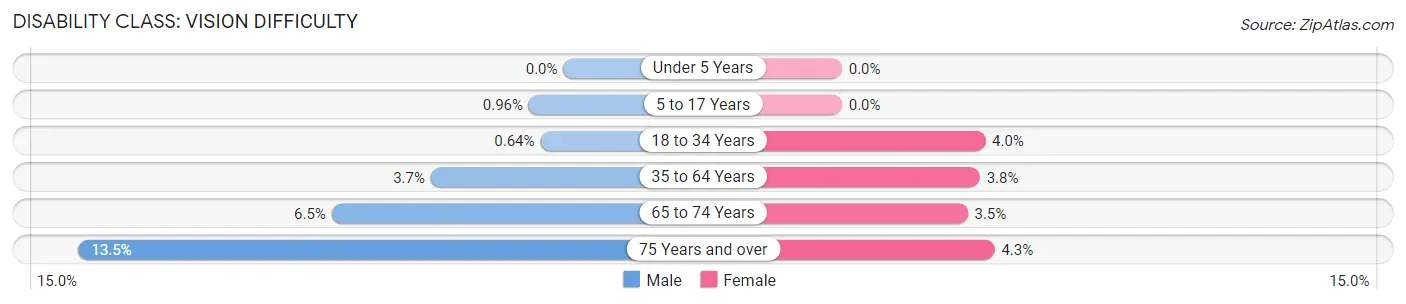
| Age Bracket | Male | Female |
| Under 5 Years | 0 (0.0%) | 0 (0.0%) |
| 5 to 17 Years | 20 (1.0%) | 0 (0.0%) |
| 18 to 34 Years | 19 (0.6%) | 135 (4.0%) |
| 35 to 64 Years | 203 (3.7%) | 201 (3.8%) |
| 65 to 74 Years | 87 (6.5%) | 55 (3.5%) |
| 75 Years and over | 81 (13.5%) | 41 (4.3%) |
Disability Class: Cognitive Difficulty
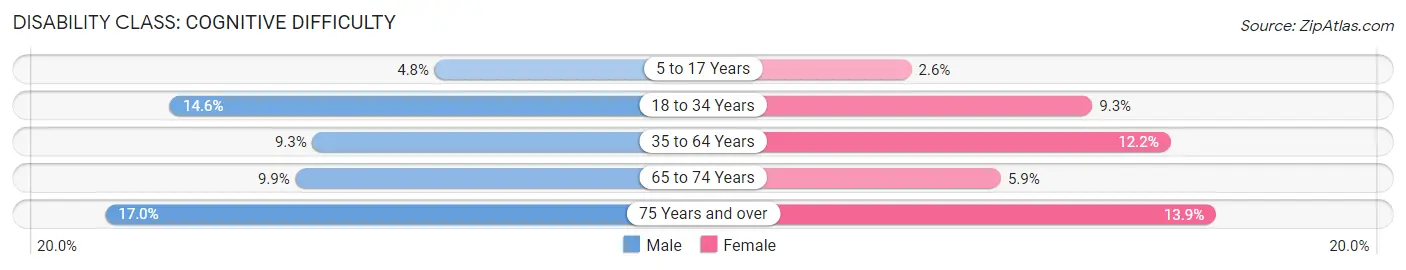
| Age Bracket | Male | Female |
| 5 to 17 Years | 99 (4.8%) | 33 (2.6%) |
| 18 to 34 Years | 433 (14.6%) | 315 (9.3%) |
| 35 to 64 Years | 512 (9.3%) | 638 (12.2%) |
| 65 to 74 Years | 134 (9.9%) | 93 (5.9%) |
| 75 Years and over | 102 (17.0%) | 134 (13.9%) |
Disability Class: Ambulatory Difficulty
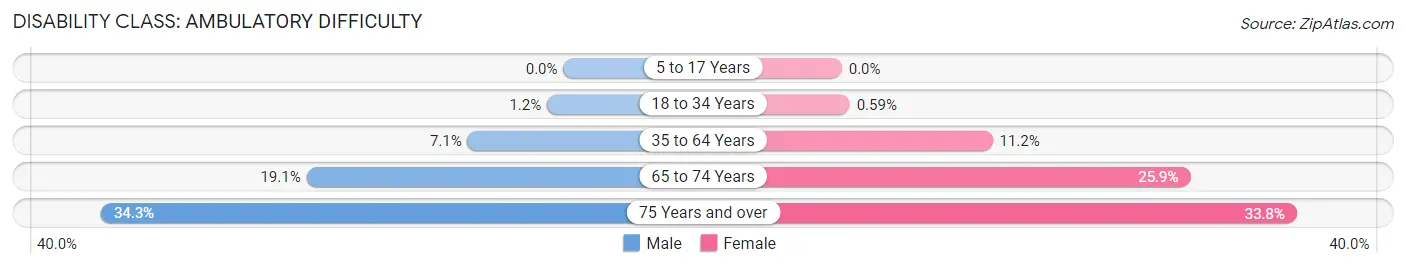
| Age Bracket | Male | Female |
| 5 to 17 Years | 0 (0.0%) | 0 (0.0%) |
| 18 to 34 Years | 36 (1.2%) | 20 (0.6%) |
| 35 to 64 Years | 391 (7.1%) | 585 (11.2%) |
| 65 to 74 Years | 257 (19.1%) | 407 (25.9%) |
| 75 Years and over | 206 (34.3%) | 326 (33.8%) |
Disability Class: Self-Care Difficulty
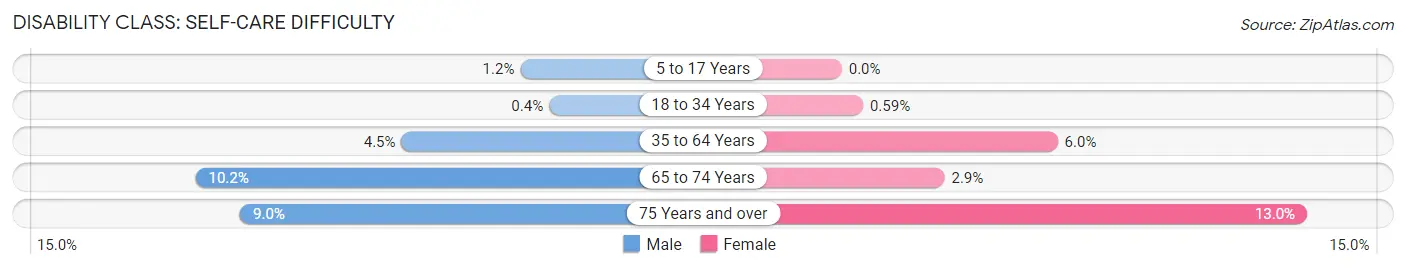
| Age Bracket | Male | Female |
| 5 to 17 Years | 25 (1.2%) | 0 (0.0%) |
| 18 to 34 Years | 12 (0.4%) | 20 (0.6%) |
| 35 to 64 Years | 248 (4.5%) | 314 (6.0%) |
| 65 to 74 Years | 138 (10.2%) | 45 (2.9%) |
| 75 Years and over | 54 (9.0%) | 125 (13.0%) |
Technology Access in Eureka
Computing Device Access in Eureka
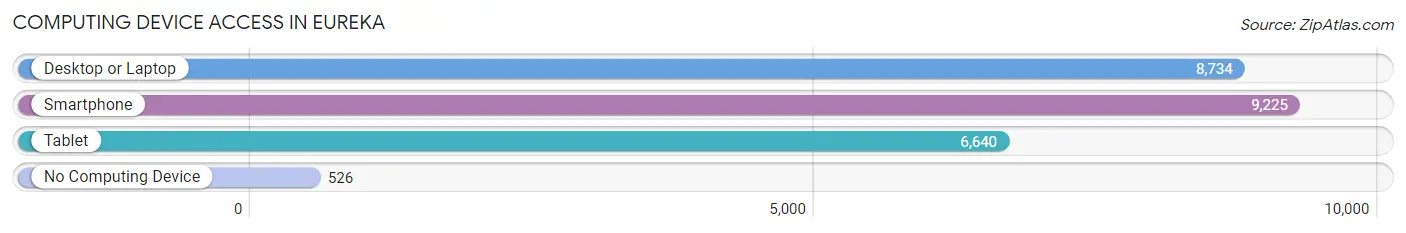
| Device Type | # Households | % Households |
| Desktop or Laptop | 8,734 | 80.1% |
| Smartphone | 9,225 | 84.6% |
| Tablet | 6,640 | 60.9% |
| No Computing Device | 526 | 4.8% |
| Total | 10,905 | 100.0% |
Internet Access in Eureka
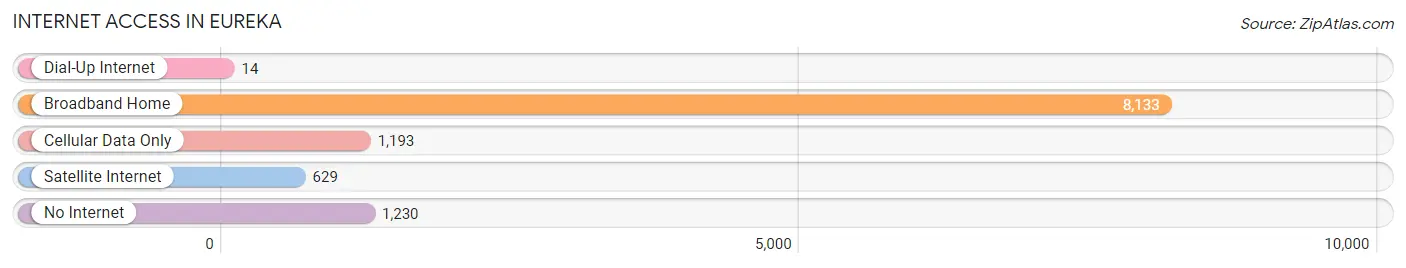
| Internet Type | # Households | % Households |
| Dial-Up Internet | 14 | 0.1% |
| Broadband Home | 8,133 | 74.6% |
| Cellular Data Only | 1,193 | 10.9% |
| Satellite Internet | 629 | 5.8% |
| No Internet | 1,230 | 11.3% |
| Total | 10,905 | 100.0% |
Eureka Summary
Eureka, California is a city located in Humboldt County, California, United States. It is the county seat of Humboldt County and the principal city of the Eureka-Arcata-Fortuna Combined Statistical Area. The population was 26,128 at the 2000 census.
History
Eureka was founded in 1850 as a seaport town and was incorporated in 1856. It was named after the Greek word for “discovery”. The city was originally a center for the logging industry, but it has since become a center for the fishing and tourism industries.
Geography
Eureka is located at 40°48'N 124°7'W (40.8, -124.1167). According to the United States Census Bureau, the city has a total area of 16.2 square miles (41.8 km2), of which, 15.9 square miles (41.2 km2) of it is land and 0.3 square miles (0.7 km2) of it (1.86%) is water.
Economy
Eureka’s economy is largely based on the fishing and tourism industries. The city is home to several seafood processing plants, as well as a number of restaurants and hotels. The city also has a thriving arts and culture scene, with several galleries, museums, and theaters.
Demographics
As of the census of 2000, there were 26,128 people, 10,845 households, and 6,092 families residing in the city. The population density was 1,637.2 people per square mile (631.2/km2). There were 11,541 housing units at an average density of 722.3 per square mile (279.2/km2). The racial makeup of the city was 79.2% White, 1.2% African American, 4.2% Native American, 4.2% Asian, 0.3% Pacific Islander, 6.3% from other races, and 4.7% from two or more races. Hispanic or Latino of any race were 11.2% of the population.
There were 10,845 households, out of which 28.2% had children under the age of 18 living with them, 40.2% were married couples living together, 13.3% had a female householder with no husband present, and 41.7% were non-families. 33.2% of all households were made up of individuals, and 11.3% had someone living alone who was 65 years of age or older. The average household size was 2.35 and the average family size was 2.99.
In the city, the population was spread out, with 24.2% under the age of 18, 9.2% from 18 to 24, 28.2% from 25 to 44, 22.7% from 45 to 64, and 15.7% who were 65 years of age or older. The median age was 37 years. For every 100 females, there were 93.2 males. For every 100 females age 18 and over, there were 90.2 males.
The median income for a household in the city was $30,837, and the median income for a family was $37,813. Males had a median income of $31,919 versus $25,836 for females. The per capita income for the city was $17,890. About 13.2% of families and 17.2% of the population were below the poverty line, including 24.2% of those under age 18 and 8.2% of those age 65 or over.
Common Questions
What is Per Capita Income in Eureka?
Per Capita income in Eureka is $33,270.
What is the Median Family Income in Eureka?
Median Family Income in Eureka is $72,199.
What is the Median Household income in Eureka?
Median Household Income in Eureka is $51,971.
What is Income or Wage Gap in Eureka?
Income or Wage Gap in Eureka is 14.7%.
Women in Eureka earn 85.3 cents for every dollar earned by a man.
What is Family Income Deficit in Eureka?
Family Income Deficit in Eureka is $12,330.
Families that are below poverty line in Eureka earn $12,330 less on average than the poverty threshold level.
What is Inequality or Gini Index in Eureka?
Inequality or Gini Index in Eureka is 0.48.
What is the Total Population of Eureka?
Total Population of Eureka is 26,519.
What is the Total Male Population of Eureka?
Total Male Population of Eureka is 13,310.
What is the Total Female Population of Eureka?
Total Female Population of Eureka is 13,209.
What is the Ratio of Males per 100 Females in Eureka?
There are 100.76 Males per 100 Females in Eureka.
What is the Ratio of Females per 100 Males in Eureka?
There are 99.24 Females per 100 Males in Eureka.
What is the Median Population Age in Eureka?
Median Population Age in Eureka is 39.8 Years.
What is the Average Family Size in Eureka
Average Family Size in Eureka is 3.0 People.
What is the Average Household Size in Eureka
Average Household Size in Eureka is 2.3 People.
How Large is the Labor Force in Eureka?
There are 13,747 People in the Labor Forcein in Eureka.
What is the Percentage of People in the Labor Force in Eureka?
61.5% of People are in the Labor Force in Eureka.
What is the Unemployment Rate in Eureka?
Unemployment Rate in Eureka is 10.1%.