Cities with the Highest Percentage of Eastern European Population in Nebraska
RELATED REPORTS & OPTIONS
Eastern European
Nebraska
Compare Cities
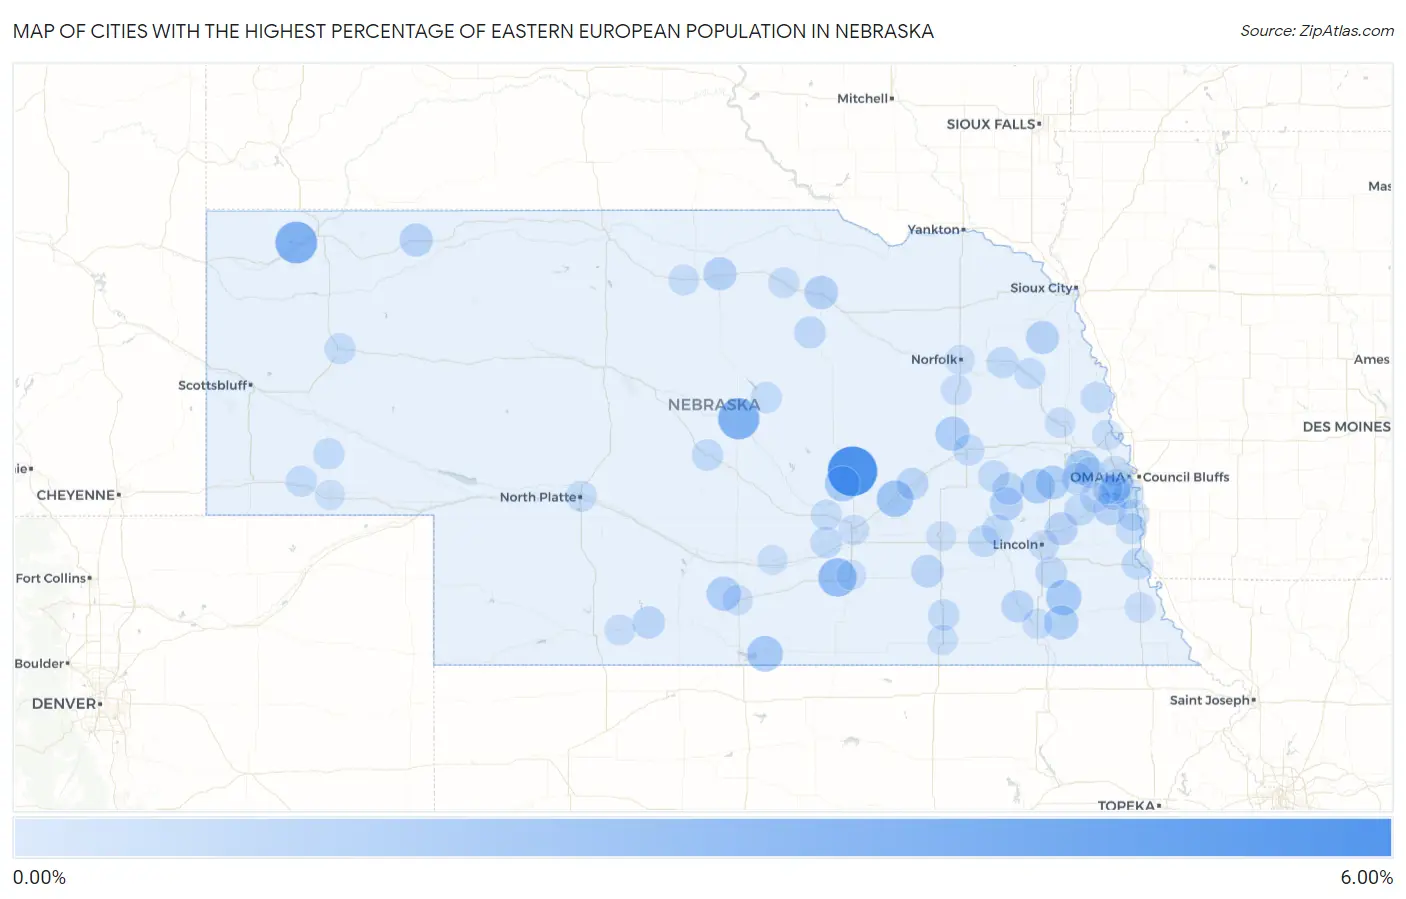
Map of Cities with the Highest Percentage of Eastern European Population in Nebraska
0.00%
6.00%
Cities with the Highest Percentage of Eastern European Population in Nebraska
| City | Eastern European | vs State | vs National | |
| 1. | Cushing | 5.49% | 0.15%(+5.34)#1 | 0.30%(+5.19)#125 |
| 2. | Whitney | 3.23% | 0.15%(+3.07)#2 | 0.30%(+2.92)#336 |
| 3. | Sargent | 3.09% | 0.15%(+2.93)#3 | 0.30%(+2.78)#359 |
| 4. | Juniata | 2.28% | 0.15%(+2.13)#4 | 0.30%(+1.98)#571 |
| 5. | Central City | 1.75% | 0.15%(+1.59)#5 | 0.30%(+1.44)#840 |
| 6. | Naponee | 1.48% | 0.15%(+1.33)#6 | 0.30%(+1.18)#1,036 |
| 7. | Adams | 1.41% | 0.15%(+1.26)#7 | 0.30%(+1.10)#1,092 |
| 8. | St Paul | 1.37% | 0.15%(+1.22)#8 | 0.30%(+1.07)#1,139 |
| 9. | Valley | 1.29% | 0.15%(+1.13)#9 | 0.30%(+0.983)#1,239 |
| 10. | Weston | 1.18% | 0.15%(+1.03)#10 | 0.30%(+0.877)#1,379 |
| 11. | Platte Center | 1.12% | 0.15%(+0.965)#11 | 0.30%(+0.814)#1,471 |
| 12. | Loomis | 1.08% | 0.15%(+0.926)#12 | 0.30%(+0.774)#1,545 |
| 13. | Filley | 1.05% | 0.15%(+0.900)#13 | 0.30%(+0.749)#1,588 |
| 14. | Wahoo | 0.97% | 0.15%(+0.820)#14 | 0.30%(+0.669)#1,742 |
| 15. | O Neill | 0.92% | 0.15%(+0.768)#15 | 0.30%(+0.617)#1,858 |
| 16. | Bassett | 0.83% | 0.15%(+0.678)#16 | 0.30%(+0.527)#2,078 |
| 17. | Gordon | 0.82% | 0.15%(+0.673)#17 | 0.30%(+0.521)#2,105 |
| 18. | Thurston | 0.82% | 0.15%(+0.667)#18 | 0.30%(+0.516)#2,124 |
| 19. | Dwight | 0.79% | 0.15%(+0.638)#19 | 0.30%(+0.487)#2,201 |
| 20. | Cedar Creek | 0.73% | 0.15%(+0.576)#20 | 0.30%(+0.424)#2,406 |
| 21. | Waverly | 0.72% | 0.15%(+0.570)#21 | 0.30%(+0.419)#2,424 |
| 22. | Grafton | 0.68% | 0.15%(+0.523)#22 | 0.30%(+0.372)#2,581 |
| 23. | Papillion | 0.65% | 0.15%(+0.501)#23 | 0.30%(+0.350)#2,656 |
| 24. | Cambridge | 0.60% | 0.15%(+0.446)#24 | 0.30%(+0.295)#2,888 |
| 25. | De Witt | 0.59% | 0.15%(+0.433)#25 | 0.30%(+0.282)#2,929 |
| 26. | Brainard | 0.55% | 0.15%(+0.394)#26 | 0.30%(+0.243)#3,117 |
| 27. | Clarks | 0.54% | 0.15%(+0.385)#27 | 0.30%(+0.234)#3,157 |
| 28. | Yutan | 0.48% | 0.15%(+0.330)#28 | 0.30%(+0.179)#3,439 |
| 29. | Chambers | 0.48% | 0.15%(+0.325)#29 | 0.30%(+0.174)#3,478 |
| 30. | Hickman | 0.44% | 0.15%(+0.292)#30 | 0.30%(+0.141)#3,655 |
| 31. | Ralston | 0.42% | 0.15%(+0.265)#31 | 0.30%(+0.114)#3,821 |
| 32. | Ashland | 0.42% | 0.15%(+0.263)#32 | 0.30%(+0.112)#3,836 |
| 33. | Goehner | 0.41% | 0.15%(+0.261)#33 | 0.30%(+0.109)#3,851 |
| 34. | David City | 0.40% | 0.15%(+0.248)#34 | 0.30%(+0.096)#3,952 |
| 35. | Broken Bow | 0.40% | 0.15%(+0.246)#35 | 0.30%(+0.095)#3,964 |
| 36. | Nebraska City | 0.39% | 0.15%(+0.233)#36 | 0.30%(+0.082)#4,059 |
| 37. | Bruning | 0.36% | 0.15%(+0.207)#37 | 0.30%(+0.056)#4,272 |
| 38. | Wood River | 0.36% | 0.15%(+0.203)#38 | 0.30%(+0.052)#4,310 |
| 39. | Pilger | 0.33% | 0.15%(+0.181)#39 | 0.30%(+0.030)#4,519 |
| 40. | Burwell | 0.32% | 0.15%(+0.167)#40 | 0.30%(+0.016)#4,652 |
| 41. | Plattsmouth | 0.32% | 0.15%(+0.166)#41 | 0.30%(+0.015)#4,658 |
| 42. | Potter | 0.32% | 0.15%(+0.164)#42 | 0.30%(+0.013)#4,679 |
| 43. | Columbus | 0.30% | 0.15%(+0.147)#43 | 0.30%(-0.004)#4,850 |
| 44. | Beemer | 0.29% | 0.15%(+0.137)#44 | 0.30%(-0.015)#4,958 |
| 45. | Dalton | 0.28% | 0.15%(+0.131)#45 | 0.30%(-0.020)#5,030 |
| 46. | Seward | 0.27% | 0.15%(+0.121)#46 | 0.30%(-0.030)#5,163 |
| 47. | Tekamah | 0.27% | 0.15%(+0.118)#47 | 0.30%(-0.033)#5,215 |
| 48. | Alliance | 0.25% | 0.15%(+0.094)#48 | 0.30%(-0.057)#5,515 |
| 49. | North Platte | 0.22% | 0.15%(+0.071)#49 | 0.30%(-0.081)#5,778 |
| 50. | Murray | 0.22% | 0.15%(+0.065)#50 | 0.30%(-0.086)#5,834 |
| 51. | Waterloo | 0.21% | 0.15%(+0.062)#51 | 0.30%(-0.089)#5,872 |
| 52. | Bellevue | 0.21% | 0.15%(+0.062)#52 | 0.30%(-0.089)#5,874 |
| 53. | Atkinson | 0.21% | 0.15%(+0.058)#53 | 0.30%(-0.093)#5,931 |
| 54. | Indianola | 0.19% | 0.15%(+0.041)#54 | 0.30%(-0.110)#6,160 |
| 55. | Ainsworth | 0.19% | 0.15%(+0.039)#55 | 0.30%(-0.112)#6,186 |
| 56. | Omaha | 0.19% | 0.15%(+0.036)#56 | 0.30%(-0.116)#6,242 |
| 57. | Cairo | 0.18% | 0.15%(+0.032)#57 | 0.30%(-0.119)#6,287 |
| 58. | Auburn | 0.15% | 0.15%(-0.007)#58 | 0.30%(-0.158)#6,847 |
| 59. | Madison | 0.14% | 0.15%(-0.009)#59 | 0.30%(-0.161)#6,888 |
| 60. | Blair | 0.14% | 0.15%(-0.012)#60 | 0.30%(-0.163)#6,919 |
| 61. | Hebron | 0.13% | 0.15%(-0.025)#61 | 0.30%(-0.176)#7,104 |
| 62. | La Vista | 0.13% | 0.15%(-0.027)#62 | 0.30%(-0.178)#7,125 |
| 63. | Grand Island | 0.12% | 0.15%(-0.033)#63 | 0.30%(-0.184)#7,199 |
| 64. | Chalco | 0.11% | 0.15%(-0.038)#64 | 0.30%(-0.189)#7,266 |
| 65. | Hooper | 0.10% | 0.15%(-0.050)#65 | 0.30%(-0.202)#7,428 |
| 66. | Lincoln | 0.094% | 0.15%(-0.058)#66 | 0.30%(-0.209)#7,520 |
| 67. | Holdrege | 0.091% | 0.15%(-0.061)#67 | 0.30%(-0.213)#7,568 |
| 68. | Beatrice | 0.090% | 0.15%(-0.063)#68 | 0.30%(-0.214)#7,588 |
| 69. | Gretna | 0.089% | 0.15%(-0.064)#69 | 0.30%(-0.215)#7,606 |
| 70. | Norfolk | 0.054% | 0.15%(-0.098)#70 | 0.30%(-0.250)#8,036 |
| 71. | Kearney | 0.021% | 0.15%(-0.132)#71 | 0.30%(-0.283)#8,352 |
| 72. | Hastings | 0.020% | 0.15%(-0.133)#72 | 0.30%(-0.284)#8,357 |
| 73. | Sidney | 0.016% | 0.15%(-0.137)#73 | 0.30%(-0.288)#8,379 |
| 74. | York | 0.012% | 0.15%(-0.140)#74 | 0.30%(-0.291)#8,384 |
Common Questions
What are the Top 10 Cities with the Highest Percentage of Eastern European Population in Nebraska?
Top 10 Cities with the Highest Percentage of Eastern European Population in Nebraska are:
What city has the Highest Percentage of Eastern European Population in Nebraska?
Cushing has the Highest Percentage of Eastern European Population in Nebraska with 5.49%.
What is the Percentage of Eastern European Population in the State of Nebraska?
Percentage of Eastern European Population in Nebraska is 0.15%.
What is the Percentage of Eastern European Population in the United States?
Percentage of Eastern European Population in the United States is 0.30%.