Saranap, CA Map & Demographics
Saranap Map
Saranap Overview
$92,395
PER CAPITA INCOME
$200,455
AVG FAMILY INCOME
$139,729
AVG HOUSEHOLD INCOME
3.1%
WAGE / INCOME GAP [ % ]
96.9¢/ $1
WAGE / INCOME GAP [ $ ]
0.50
INEQUALITY / GINI INDEX
6,136
TOTAL POPULATION
3,019
MALE POPULATION
3,117
FEMALE POPULATION
96.86
MALES / 100 FEMALES
103.25
FEMALES / 100 MALES
41.8
MEDIAN AGE
3.1
AVG FAMILY SIZE
2.4
AVG HOUSEHOLD SIZE
3,440
LABOR FORCE [ PEOPLE ]
70.0%
PERCENT IN LABOR FORCE
3.5%
UNEMPLOYMENT RATE
Income in Saranap
Income Overview in Saranap
Per Capita Income in Saranap is $92,395, while median incomes of families and households are $200,455 and $139,729 respectively.
| Characteristic | Number | Measure |
| Per Capita Income | 6,136 | $92,395 |
| Median Family Income | 1,558 | $200,455 |
| Mean Family Income | 1,558 | $285,258 |
| Median Household Income | 2,481 | $139,729 |
| Mean Household Income | 2,481 | $225,518 |
| Income Deficit | 1,558 | $0 |
| Wage / Income Gap (%) | 6,136 | 3.12% |
| Wage / Income Gap ($) | 6,136 | 96.88¢ per $1 |
| Gini / Inequality Index | 6,136 | 0.50 |
Earnings by Sex in Saranap
Average Earnings in Saranap are $85,593, $85,298 for men and $88,049 for women, a difference of 3.1%.
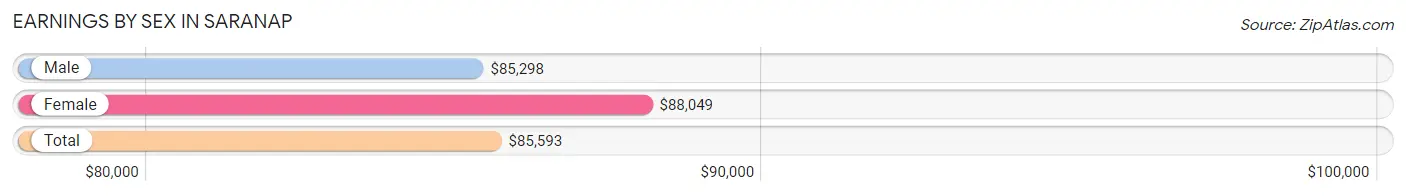
| Sex | Number | Average Earnings |
| Male | 1,841 (53.3%) | $85,298 |
| Female | 1,612 (46.7%) | $88,049 |
| Total | 3,453 (100.0%) | $85,593 |
Earnings by Sex by Income Bracket in Saranap
The most common earnings brackets in Saranap are $100,000+ for men (780 | 42.4%) and $100,000+ for women (692 | 42.9%).
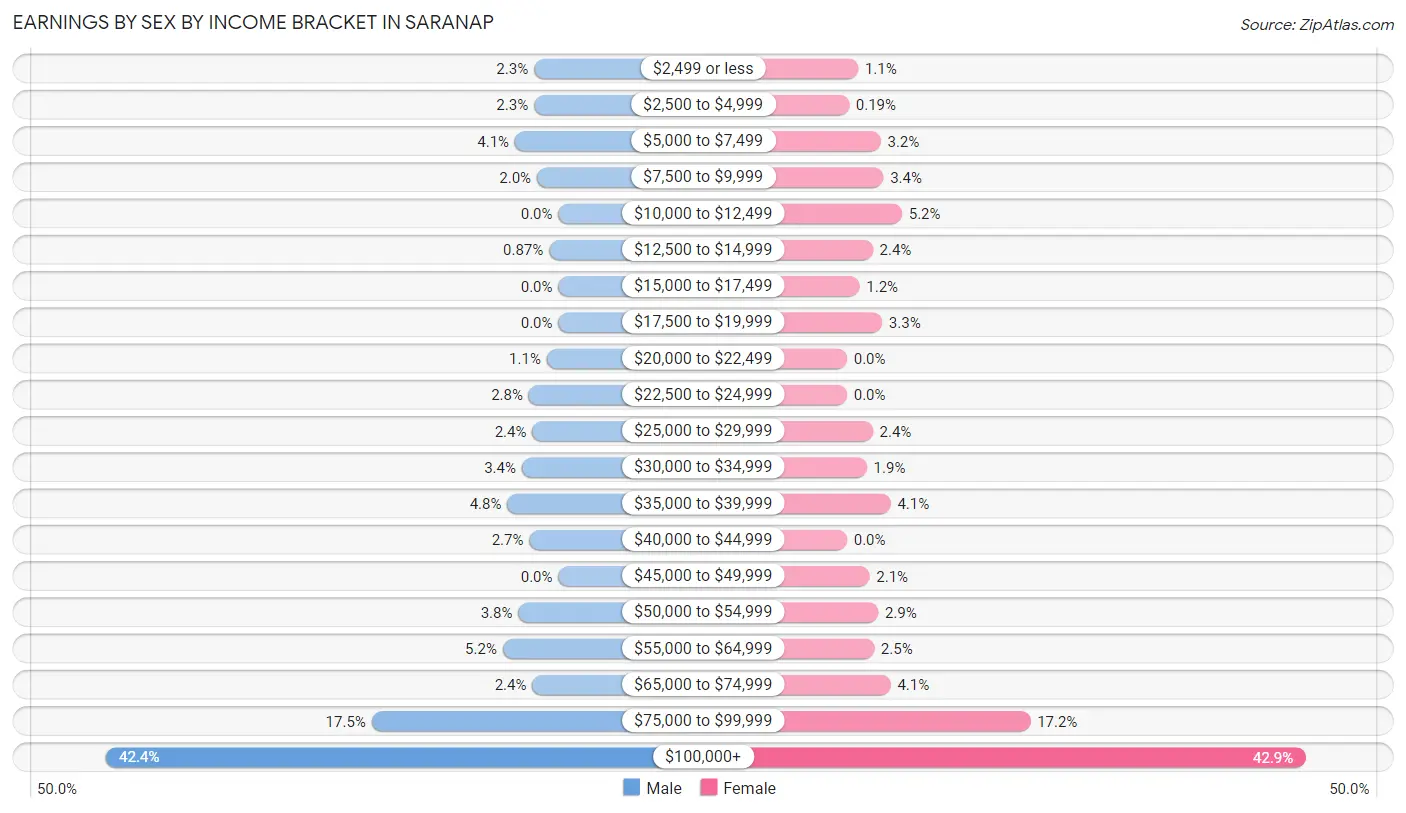
| Income | Male | Female |
| $2,499 or less | 42 (2.3%) | 17 (1.1%) |
| $2,500 to $4,999 | 42 (2.3%) | 3 (0.2%) |
| $5,000 to $7,499 | 75 (4.1%) | 51 (3.2%) |
| $7,500 to $9,999 | 37 (2.0%) | 55 (3.4%) |
| $10,000 to $12,499 | 0 (0.0%) | 83 (5.1%) |
| $12,500 to $14,999 | 16 (0.9%) | 39 (2.4%) |
| $15,000 to $17,499 | 0 (0.0%) | 19 (1.2%) |
| $17,500 to $19,999 | 0 (0.0%) | 53 (3.3%) |
| $20,000 to $22,499 | 20 (1.1%) | 0 (0.0%) |
| $22,500 to $24,999 | 51 (2.8%) | 0 (0.0%) |
| $25,000 to $29,999 | 45 (2.4%) | 39 (2.4%) |
| $30,000 to $34,999 | 63 (3.4%) | 30 (1.9%) |
| $35,000 to $39,999 | 88 (4.8%) | 66 (4.1%) |
| $40,000 to $44,999 | 50 (2.7%) | 0 (0.0%) |
| $45,000 to $49,999 | 0 (0.0%) | 34 (2.1%) |
| $50,000 to $54,999 | 69 (3.7%) | 47 (2.9%) |
| $55,000 to $64,999 | 96 (5.2%) | 41 (2.5%) |
| $65,000 to $74,999 | 45 (2.4%) | 66 (4.1%) |
| $75,000 to $99,999 | 322 (17.5%) | 277 (17.2%) |
| $100,000+ | 780 (42.4%) | 692 (42.9%) |
| Total | 1,841 (100.0%) | 1,612 (100.0%) |
Earnings by Sex by Educational Attainment in Saranap
Average earnings in Saranap are $87,024 for men and $103,750 for women, a difference of 16.1%. Men with an educational attainment of graduate degree enjoy the highest average annual earnings of $144,511, while those with college or associate's degree education earn the least with $58,295. Women with an educational attainment of graduate degree earn the most with the average annual earnings of $139,684, while those with high school diploma education have the smallest earnings of $18,333.
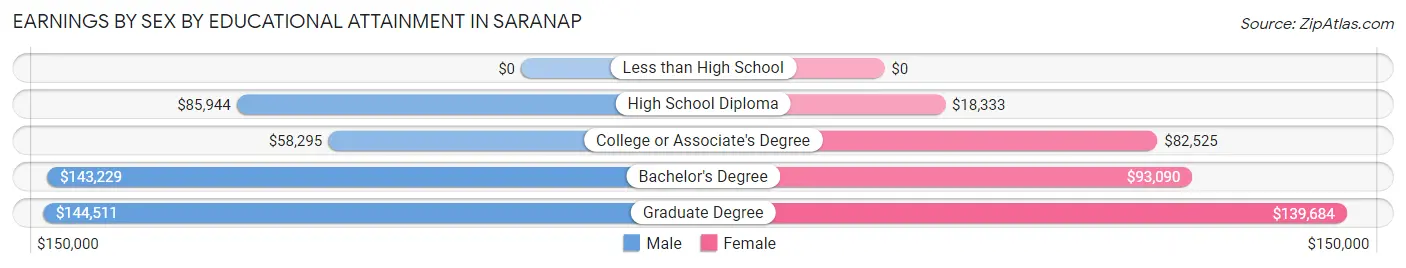
| Educational Attainment | Male Income | Female Income |
| Less than High School | - | - |
| High School Diploma | $85,944 | $18,333 |
| College or Associate's Degree | $58,295 | $82,525 |
| Bachelor's Degree | $143,229 | $93,090 |
| Graduate Degree | $144,511 | $139,684 |
| Total | $87,024 | $103,750 |
Family Income in Saranap
Family Income Brackets in Saranap
According to the Saranap family income data, there are 781 families falling into the $200,000+ income range, which is the most common income bracket and makes up 50.1% of all families.
| Income Bracket | # Families | % Families |
| Less than $10,000 | 0 | 0.0% |
| $10,000 to $14,999 | 0 | 0.0% |
| $15,000 to $24,999 | 12 | 0.8% |
| $25,000 to $34,999 | 0 | 0.0% |
| $35,000 to $49,999 | 65 | 4.2% |
| $50,000 to $74,999 | 137 | 8.8% |
| $75,000 to $99,999 | 150 | 9.6% |
| $100,000 to $149,999 | 224 | 14.4% |
| $150,000 to $199,999 | 189 | 12.1% |
| $200,000+ | 781 | 50.1% |
Family Income by Famaliy Size in Saranap
5-person families (99 | 6.4%) account for the highest median family income in Saranap with $250,001 per family, while 3-person families (352 | 22.6%) have the highest median income of $79,912 per family member.
| Income Bracket | # Families | Median Income |
| 2-Person Families | 659 (42.3%) | $137,715 |
| 3-Person Families | 352 (22.6%) | $239,737 |
| 4-Person Families | 389 (25.0%) | $224,583 |
| 5-Person Families | 99 (6.4%) | $250,001 |
| 6-Person Families | 57 (3.7%) | $219,450 |
| 7+ Person Families | 2 (0.1%) | $0 |
| Total | 1,558 (100.0%) | $200,455 |
Family Income by Number of Earners in Saranap
The median family income in Saranap is $200,455, with families comprising 2 earners (628) having the highest median family income of $250,001, while families with no earners (226) have the lowest median family income of $84,333, accounting for 40.3% and 14.5% of families, respectively.
| Number of Earners | # Families | Median Income |
| No Earners | 226 (14.5%) | $84,333 |
| 1 Earner | 463 (29.7%) | $139,053 |
| 2 Earners | 628 (40.3%) | $250,001 |
| 3+ Earners | 241 (15.5%) | $250,001 |
| Total | 1,558 (100.0%) | $200,455 |
Household Income in Saranap
Household Income Brackets in Saranap
With 898 households falling in the category, the $200,000+ income range is the most frequent in Saranap, accounting for 36.2% of all households. In contrast, only 30 households (1.2%) fall into the $10,000 to $14,999 income bracket, making it the least populous group.
| Income Bracket | # Households | % Households |
| Less than $10,000 | 92 | 3.7% |
| $10,000 to $14,999 | 30 | 1.2% |
| $15,000 to $24,999 | 30 | 1.2% |
| $25,000 to $34,999 | 37 | 1.5% |
| $35,000 to $49,999 | 117 | 4.7% |
| $50,000 to $74,999 | 290 | 11.7% |
| $75,000 to $99,999 | 270 | 10.9% |
| $100,000 to $149,999 | 496 | 20.0% |
| $150,000 to $199,999 | 221 | 8.9% |
| $200,000+ | 898 | 36.2% |
Household Income by Householder Age in Saranap
The median household income in Saranap is $139,729, with the highest median household income of $193,136 found in the 45 to 64 years age bracket for the primary householder. A total of 1,071 households (43.2%) fall into this category. Meanwhile, the 65+ years age bracket for the primary householder has the lowest median household income of $81,161, with 606 households (24.4%) in this group.
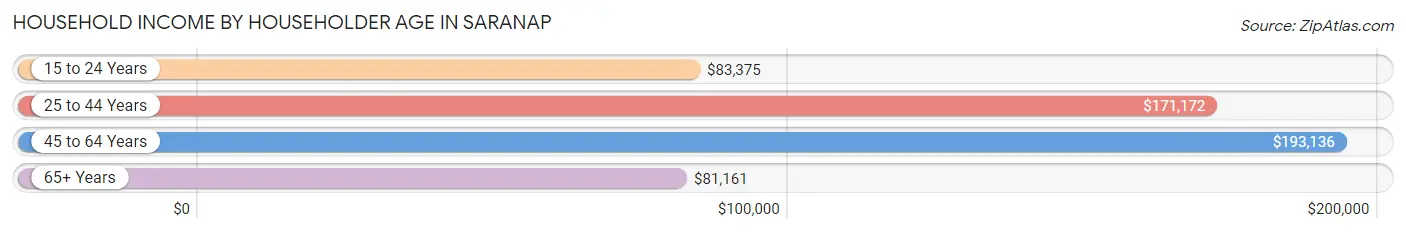
| Income Bracket | # Households | Median Income |
| 15 to 24 Years | 109 (4.4%) | $83,375 |
| 25 to 44 Years | 695 (28.0%) | $171,172 |
| 45 to 64 Years | 1,071 (43.2%) | $193,136 |
| 65+ Years | 606 (24.4%) | $81,161 |
| Total | 2,481 (100.0%) | $139,729 |
Poverty in Saranap
Income Below Poverty by Sex and Age in Saranap
With 5.0% poverty level for males and 1.8% for females among the residents of Saranap, 25 to 34 year old males and 55 to 64 year old females are the most vulnerable to poverty, with 72 males (17.2%) and 53 females (15.6%) in their respective age groups living below the poverty level.
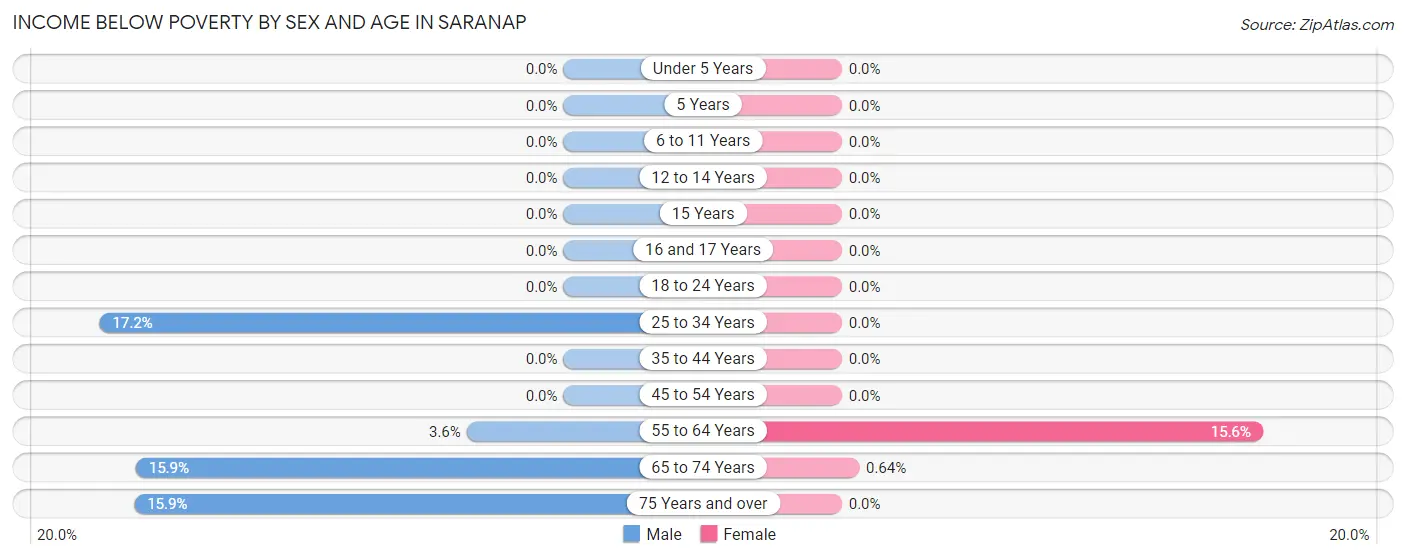
| Age Bracket | Male | Female |
| Under 5 Years | 0 (0.0%) | 0 (0.0%) |
| 5 Years | 0 (0.0%) | 0 (0.0%) |
| 6 to 11 Years | 0 (0.0%) | 0 (0.0%) |
| 12 to 14 Years | 0 (0.0%) | 0 (0.0%) |
| 15 Years | 0 (0.0%) | 0 (0.0%) |
| 16 and 17 Years | 0 (0.0%) | 0 (0.0%) |
| 18 to 24 Years | 0 (0.0%) | 0 (0.0%) |
| 25 to 34 Years | 72 (17.2%) | 0 (0.0%) |
| 35 to 44 Years | 0 (0.0%) | 0 (0.0%) |
| 45 to 54 Years | 0 (0.0%) | 0 (0.0%) |
| 55 to 64 Years | 7 (3.6%) | 53 (15.6%) |
| 65 to 74 Years | 43 (15.9%) | 2 (0.6%) |
| 75 Years and over | 29 (15.9%) | 0 (0.0%) |
| Total | 151 (5.0%) | 55 (1.8%) |
Income Above Poverty by Sex and Age in Saranap
According to the poverty statistics in Saranap, males aged under 5 years and females aged under 5 years are the age groups that are most secure financially, with 100.0% of males and 100.0% of females in these age groups living above the poverty line.
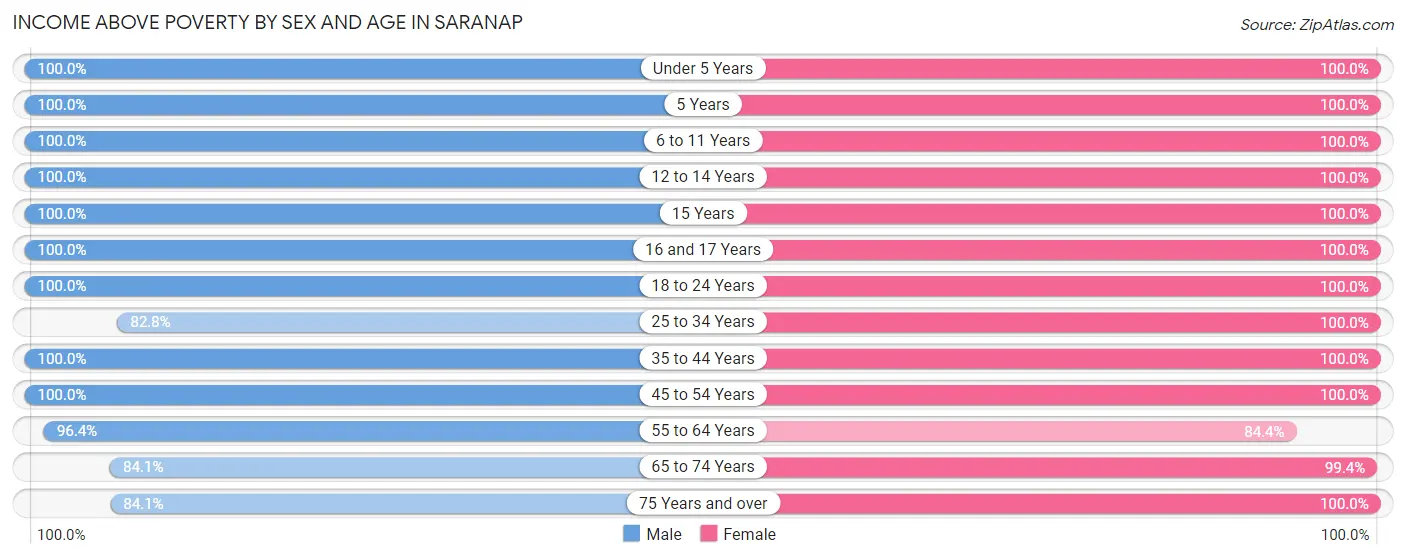
| Age Bracket | Male | Female |
| Under 5 Years | 212 (100.0%) | 227 (100.0%) |
| 5 Years | 27 (100.0%) | 88 (100.0%) |
| 6 to 11 Years | 104 (100.0%) | 317 (100.0%) |
| 12 to 14 Years | 89 (100.0%) | 40 (100.0%) |
| 15 Years | 62 (100.0%) | 56 (100.0%) |
| 16 and 17 Years | 133 (100.0%) | 61 (100.0%) |
| 18 to 24 Years | 242 (100.0%) | 228 (100.0%) |
| 25 to 34 Years | 346 (82.8%) | 122 (100.0%) |
| 35 to 44 Years | 389 (100.0%) | 439 (100.0%) |
| 45 to 54 Years | 691 (100.0%) | 636 (100.0%) |
| 55 to 64 Years | 188 (96.4%) | 286 (84.4%) |
| 65 to 74 Years | 228 (84.1%) | 312 (99.4%) |
| 75 Years and over | 153 (84.1%) | 234 (100.0%) |
| Total | 2,864 (95.0%) | 3,046 (98.2%) |
Income Below Poverty Among Married-Couple Families in Saranap
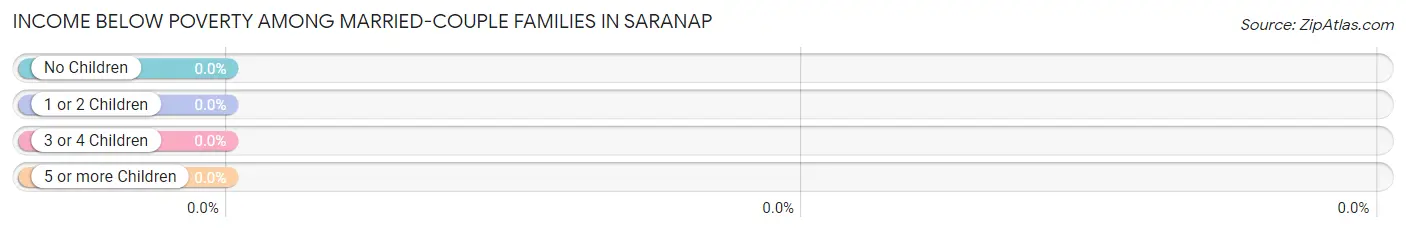
| Children | Above Poverty | Below Poverty |
| No Children | 486 (100.0%) | 0 (0.0%) |
| 1 or 2 Children | 635 (100.0%) | 0 (0.0%) |
| 3 or 4 Children | 50 (100.0%) | 0 (0.0%) |
| 5 or more Children | 0 (0.0%) | 0 (0.0%) |
| Total | 1,171 (100.0%) | 0 (0.0%) |
Income Below Poverty Among Single-Parent Households in Saranap
| Children | Single Father | Single Mother |
| No Children | 0 (0.0%) | 0 (0.0%) |
| 1 or 2 Children | 0 (0.0%) | 0 (0.0%) |
| 3 or 4 Children | 0 (0.0%) | 0 (0.0%) |
| 5 or more Children | 0 (0.0%) | 0 (0.0%) |
| Total | 0 (0.0%) | 0 (0.0%) |
Income Below Poverty Among Married-Couple vs Single-Parent Households in Saranap
| Children | Married-Couple Families | Single-Parent Households |
| No Children | 0 (0.0%) | 0 (0.0%) |
| 1 or 2 Children | 0 (0.0%) | 0 (0.0%) |
| 3 or 4 Children | 0 (0.0%) | 0 (0.0%) |
| 5 or more Children | 0 (0.0%) | 0 (0.0%) |
| Total | 0 (0.0%) | 0 (0.0%) |
Race in Saranap
The most populous races in Saranap are White / Caucasian (3,811 | 62.1%), Asian (948 | 15.4%), and Hispanic or Latino (936 | 15.2%).
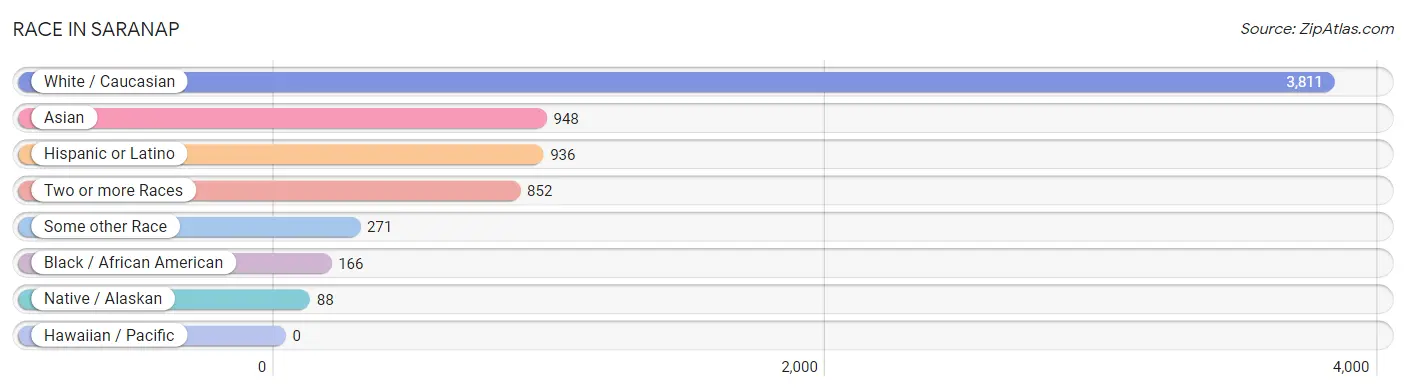
| Race | # Population | % Population |
| Asian | 948 | 15.4% |
| Black / African American | 166 | 2.7% |
| Hawaiian / Pacific | 0 | 0.0% |
| Hispanic or Latino | 936 | 15.2% |
| Native / Alaskan | 88 | 1.4% |
| White / Caucasian | 3,811 | 62.1% |
| Two or more Races | 852 | 13.9% |
| Some other Race | 271 | 4.4% |
| Total | 6,136 | 100.0% |
Ancestry in Saranap
The most populous ancestries reported in Saranap are English (931 | 15.2%), Irish (917 | 14.9%), German (834 | 13.6%), Mexican (603 | 9.8%), and Italian (563 | 9.2%), together accounting for 62.7% of all Saranap residents.
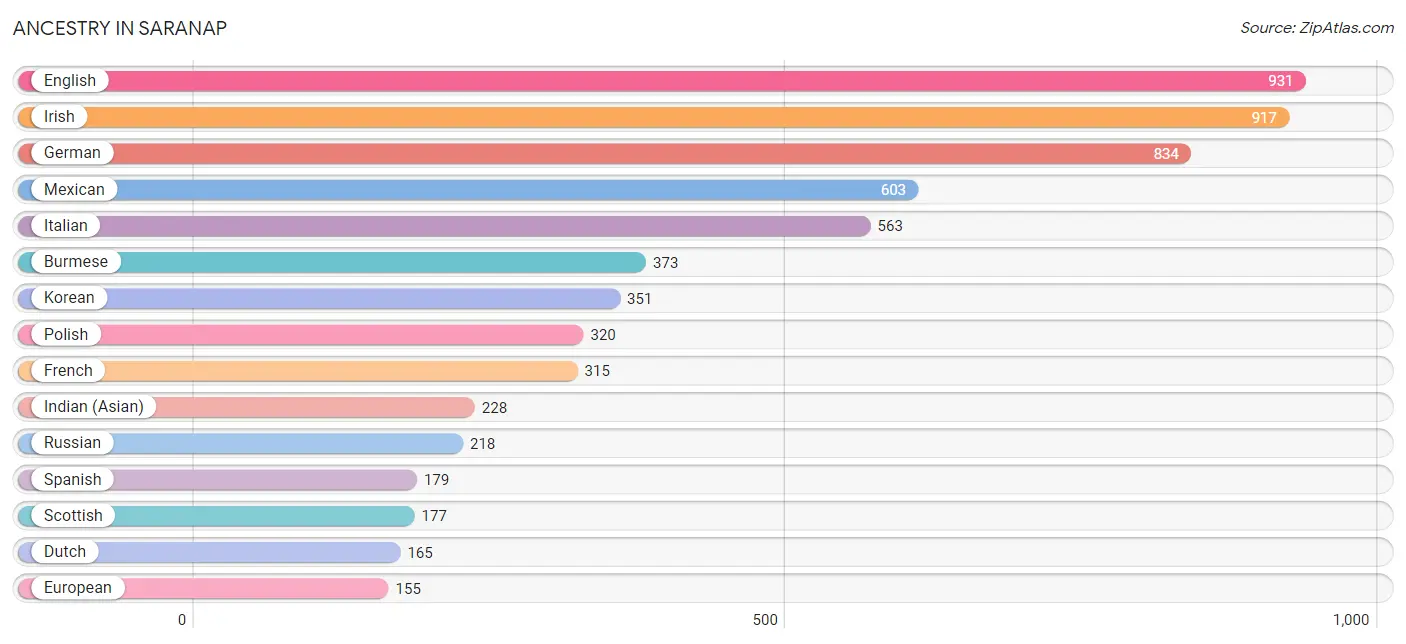
| Ancestry | # Population | % Population |
| African | 53 | 0.9% |
| American | 88 | 1.4% |
| Arab | 143 | 2.3% |
| Australian | 17 | 0.3% |
| Austrian | 59 | 1.0% |
| Belgian | 129 | 2.1% |
| Bhutanese | 108 | 1.8% |
| British | 45 | 0.7% |
| Burmese | 373 | 6.1% |
| Central American | 105 | 1.7% |
| Central American Indian | 88 | 1.4% |
| Cherokee | 23 | 0.4% |
| Croatian | 7 | 0.1% |
| Czech | 27 | 0.4% |
| Danish | 43 | 0.7% |
| Dutch | 165 | 2.7% |
| Eastern European | 81 | 1.3% |
| English | 931 | 15.2% |
| European | 155 | 2.5% |
| French | 315 | 5.1% |
| German | 834 | 13.6% |
| Greek | 82 | 1.3% |
| Guatemalan | 22 | 0.4% |
| Indian (Asian) | 228 | 3.7% |
| Irish | 917 | 14.9% |
| Italian | 563 | 9.2% |
| Korean | 351 | 5.7% |
| Laotian | 12 | 0.2% |
| Lebanese | 129 | 2.1% |
| Lithuanian | 15 | 0.2% |
| Mexican | 603 | 9.8% |
| Mexican American Indian | 44 | 0.7% |
| Nicaraguan | 55 | 0.9% |
| Norwegian | 95 | 1.5% |
| Polish | 320 | 5.2% |
| Portuguese | 33 | 0.5% |
| Puerto Rican | 35 | 0.6% |
| Russian | 218 | 3.5% |
| Salvadoran | 28 | 0.5% |
| Scandinavian | 15 | 0.2% |
| Scotch-Irish | 10 | 0.2% |
| Scottish | 177 | 2.9% |
| Slovene | 14 | 0.2% |
| Spaniard | 11 | 0.2% |
| Spanish | 179 | 2.9% |
| Sri Lankan | 30 | 0.5% |
| Subsaharan African | 53 | 0.9% |
| Swedish | 101 | 1.7% |
| Swiss | 43 | 0.7% |
| Thai | 70 | 1.1% |
| Ukrainian | 17 | 0.3% |
| Vietnamese | 44 | 0.7% |
| Welsh | 104 | 1.7% | View All 53 Rows |
Immigrants in Saranap
The most numerous immigrant groups reported in Saranap came from Asia (465 | 7.6%), Philippines (203 | 3.3%), South Eastern Asia (203 | 3.3%), Central America (175 | 2.9%), and Latin America (175 | 2.9%), together accounting for 19.9% of all Saranap residents.
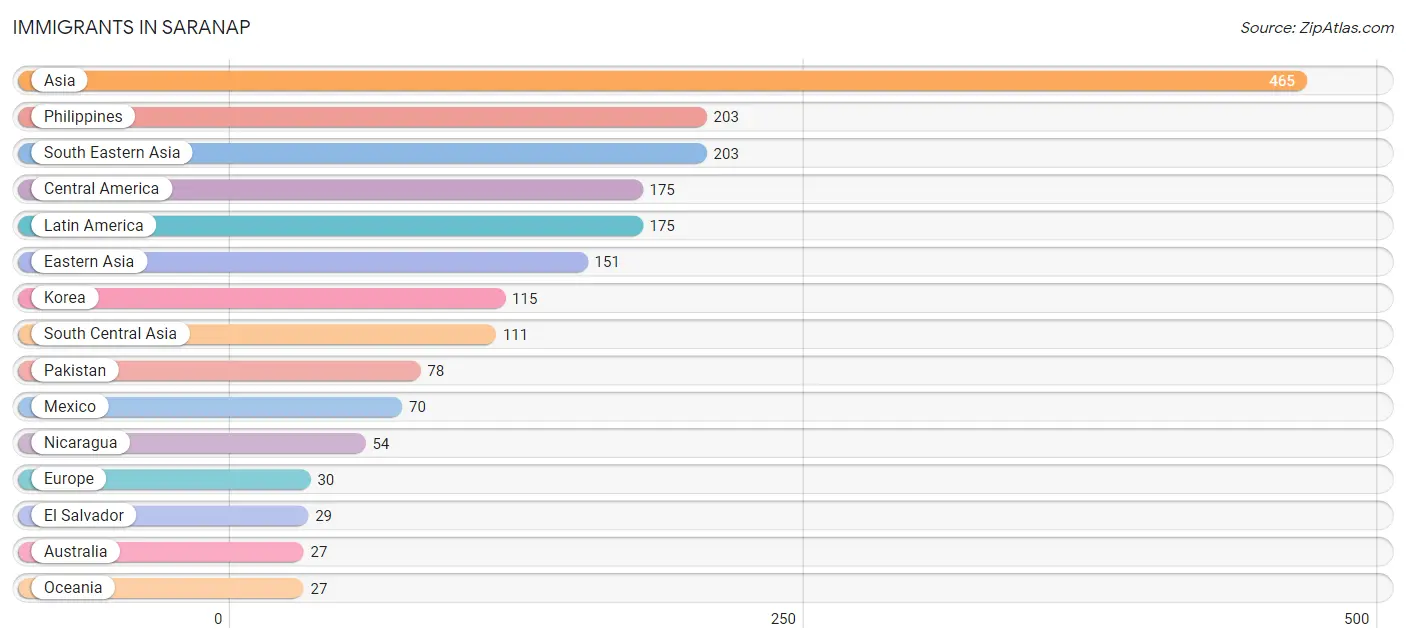
| Immigration Origin | # Population | % Population |
| Asia | 465 | 7.6% |
| Australia | 27 | 0.4% |
| Central America | 175 | 2.9% |
| China | 22 | 0.4% |
| Eastern Asia | 151 | 2.5% |
| Eastern Europe | 18 | 0.3% |
| El Salvador | 29 | 0.5% |
| England | 12 | 0.2% |
| Europe | 30 | 0.5% |
| Guatemala | 22 | 0.4% |
| India | 19 | 0.3% |
| Iran | 14 | 0.2% |
| Japan | 14 | 0.2% |
| Korea | 115 | 1.9% |
| Latin America | 175 | 2.9% |
| Mexico | 70 | 1.1% |
| Nicaragua | 54 | 0.9% |
| Northern Europe | 12 | 0.2% |
| Oceania | 27 | 0.4% |
| Pakistan | 78 | 1.3% |
| Philippines | 203 | 3.3% |
| Russia | 18 | 0.3% |
| South Central Asia | 111 | 1.8% |
| South Eastern Asia | 203 | 3.3% |
| Taiwan | 14 | 0.2% | View All 25 Rows |
Sex and Age in Saranap
Sex and Age in Saranap
The most populous age groups in Saranap are 45 to 49 Years (417 | 13.8%) for men and 45 to 49 Years (399 | 12.8%) for women.
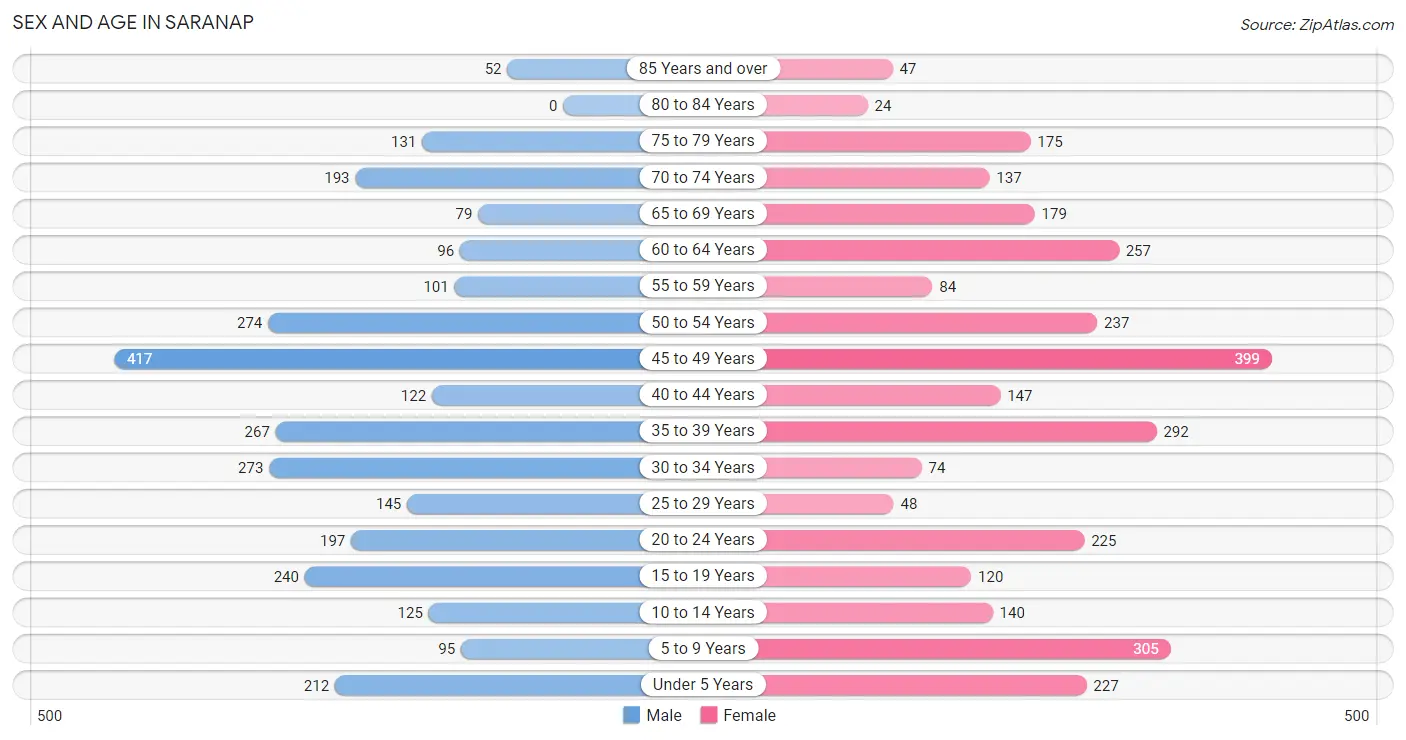
| Age Bracket | Male | Female |
| Under 5 Years | 212 (7.0%) | 227 (7.3%) |
| 5 to 9 Years | 95 (3.2%) | 305 (9.8%) |
| 10 to 14 Years | 125 (4.1%) | 140 (4.5%) |
| 15 to 19 Years | 240 (8.0%) | 120 (3.8%) |
| 20 to 24 Years | 197 (6.5%) | 225 (7.2%) |
| 25 to 29 Years | 145 (4.8%) | 48 (1.5%) |
| 30 to 34 Years | 273 (9.0%) | 74 (2.4%) |
| 35 to 39 Years | 267 (8.8%) | 292 (9.4%) |
| 40 to 44 Years | 122 (4.0%) | 147 (4.7%) |
| 45 to 49 Years | 417 (13.8%) | 399 (12.8%) |
| 50 to 54 Years | 274 (9.1%) | 237 (7.6%) |
| 55 to 59 Years | 101 (3.4%) | 84 (2.7%) |
| 60 to 64 Years | 96 (3.2%) | 257 (8.3%) |
| 65 to 69 Years | 79 (2.6%) | 179 (5.7%) |
| 70 to 74 Years | 193 (6.4%) | 137 (4.4%) |
| 75 to 79 Years | 131 (4.3%) | 175 (5.6%) |
| 80 to 84 Years | 0 (0.0%) | 24 (0.8%) |
| 85 Years and over | 52 (1.7%) | 47 (1.5%) |
| Total | 3,019 (100.0%) | 3,117 (100.0%) |
Families and Households in Saranap
Median Family Size in Saranap
The median family size in Saranap is 3.12 persons per family, with married-couple families (1,171 | 75.2%) accounting for the largest median family size of 3.22 persons per family. On the other hand, single female/mother families (342 | 22.0%) represent the smallest median family size with 2.84 persons per family.
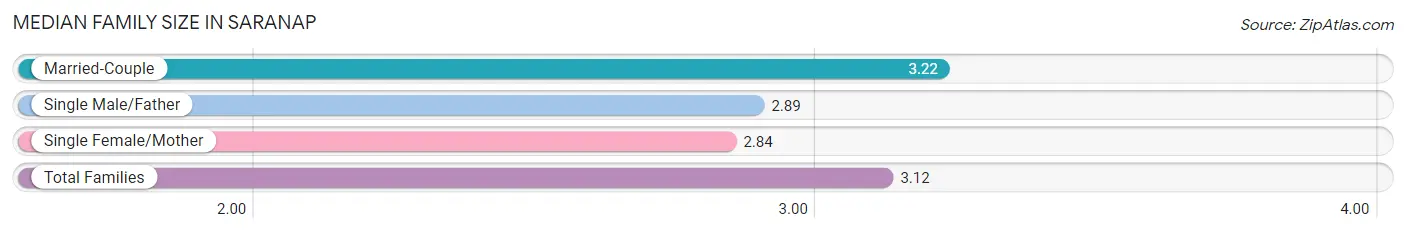
| Family Type | # Families | Family Size |
| Married-Couple | 1,171 (75.2%) | 3.22 |
| Single Male/Father | 45 (2.9%) | 2.89 |
| Single Female/Mother | 342 (22.0%) | 2.84 |
| Total Families | 1,558 (100.0%) | 3.12 |
Median Household Size in Saranap
The median household size in Saranap is 2.44 persons per household, with married-couple households (1,171 | 47.2%) accounting for the largest median household size of 3.22 persons per household. non-family households (923 | 37.2%) represent the smallest median household size with 1.20 persons per household.
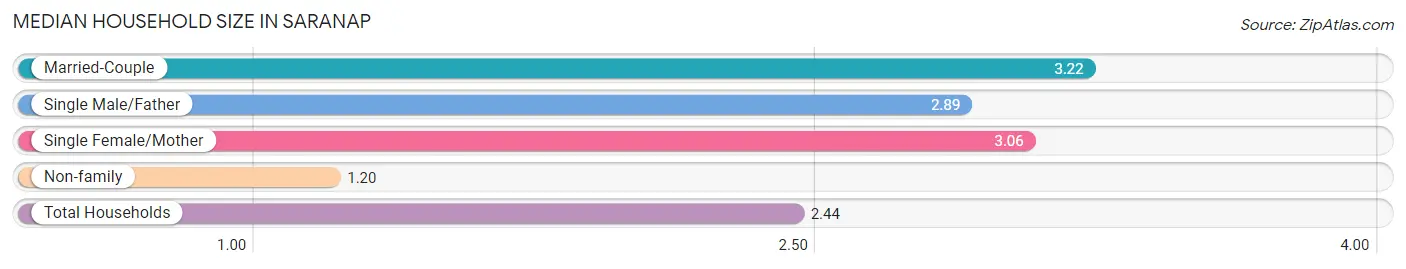
| Household Type | # Households | Household Size |
| Married-Couple | 1,171 (47.2%) | 3.22 |
| Single Male/Father | 45 (1.8%) | 2.89 |
| Single Female/Mother | 342 (13.8%) | 3.06 |
| Non-family | 923 (37.2%) | 1.20 |
| Total Households | 2,481 (100.0%) | 2.44 |
Household Size by Marriage Status in Saranap
Out of a total of 2,481 households in Saranap, 1,558 (62.8%) are family households, while 923 (37.2%) are nonfamily households. The most numerous type of family households are 2-person households, comprising 645, and the most common type of nonfamily households are 1-person households, comprising 726.
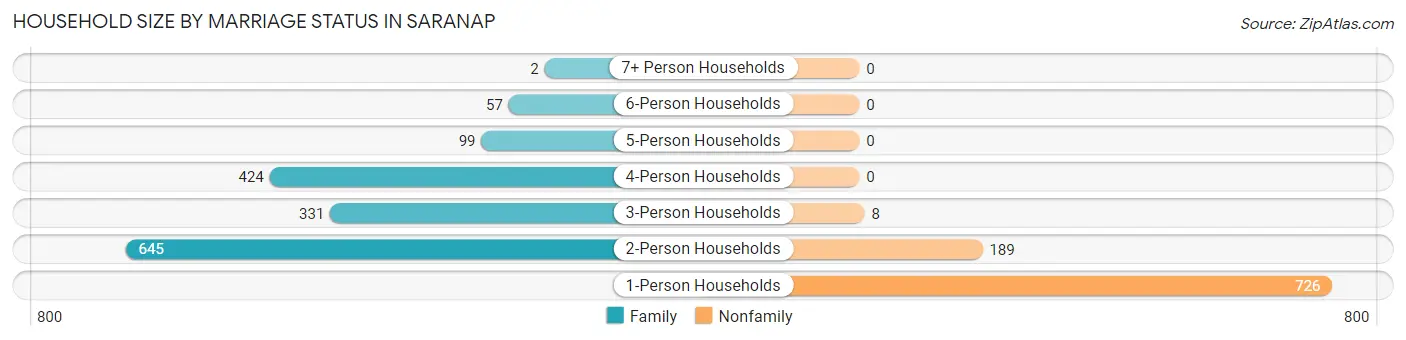
| Household Size | Family Households | Nonfamily Households |
| 1-Person Households | - | 726 (29.3%) |
| 2-Person Households | 645 (26.0%) | 189 (7.6%) |
| 3-Person Households | 331 (13.3%) | 8 (0.3%) |
| 4-Person Households | 424 (17.1%) | 0 (0.0%) |
| 5-Person Households | 99 (4.0%) | 0 (0.0%) |
| 6-Person Households | 57 (2.3%) | 0 (0.0%) |
| 7+ Person Households | 2 (0.1%) | 0 (0.0%) |
| Total | 1,558 (62.8%) | 923 (37.2%) |
Female Fertility in Saranap
Fertility by Age in Saranap
Average fertility rate in Saranap is 123.0 births per 1,000 women. Women in the age bracket of 35 to 50 years have the highest fertility rate with 143.0 births per 1,000 women. Women in the age bracket of 35 to 50 years acount for 77.8% of all women with births.
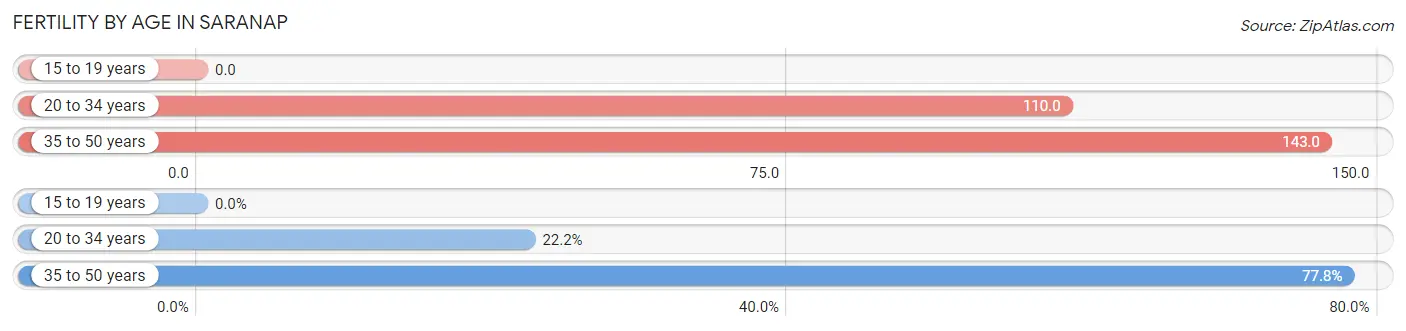
| Age Bracket | Women with Births | Births / 1,000 Women |
| 15 to 19 years | 0 (0.0%) | 0.0 |
| 20 to 34 years | 38 (22.2%) | 110.0 |
| 35 to 50 years | 133 (77.8%) | 143.0 |
| Total | 171 (100.0%) | 123.0 |
Fertility by Age by Marriage Status in Saranap
79.5% of women with births (171) in Saranap are married. The highest percentage of unmarried women with births falls into 35 to 50 years age bracket with 26.3% of them unmarried at the time of birth, while the lowest percentage of unmarried women with births belong to 20 to 34 years age bracket with 0.0% of them unmarried.
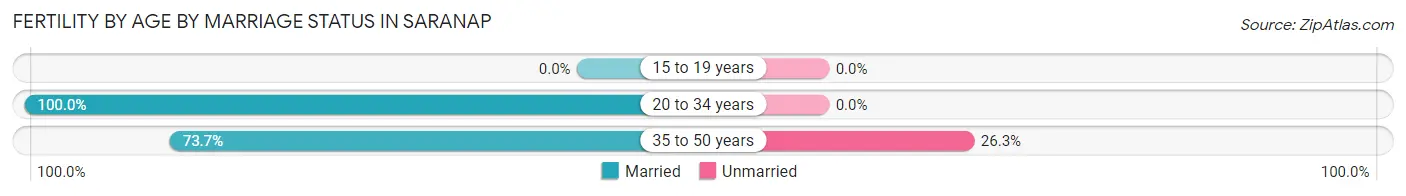
| Age Bracket | Married | Unmarried |
| 15 to 19 years | 0 (0.0%) | 0 (0.0%) |
| 20 to 34 years | 38 (100.0%) | 0 (0.0%) |
| 35 to 50 years | 98 (73.7%) | 35 (26.3%) |
| Total | 136 (79.5%) | 35 (20.5%) |
Fertility by Education in Saranap
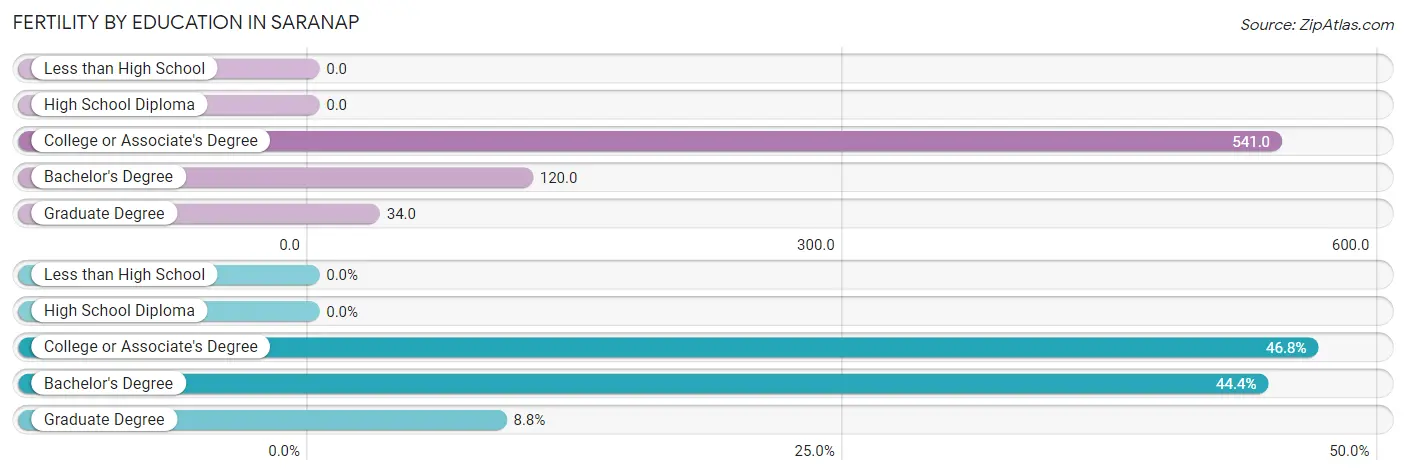
| Educational Attainment | Women with Births | Births / 1,000 Women |
| Less than High School | 0 (0.0%) | 0.0 |
| High School Diploma | 0 (0.0%) | 0.0 |
| College or Associate's Degree | 80 (46.8%) | 541.0 |
| Bachelor's Degree | 76 (44.4%) | 120.0 |
| Graduate Degree | 15 (8.8%) | 34.0 |
| Total | 171 (100.0%) | 123.0 |
Fertility by Education by Marriage Status in Saranap
20.5% of women with births in Saranap are unmarried. Women with the educational attainment of bachelor's degree are most likely to be married with 100.0% of them married at childbirth, while women with the educational attainment of college or associate's degree are least likely to be married with 43.8% of them unmarried at childbirth.
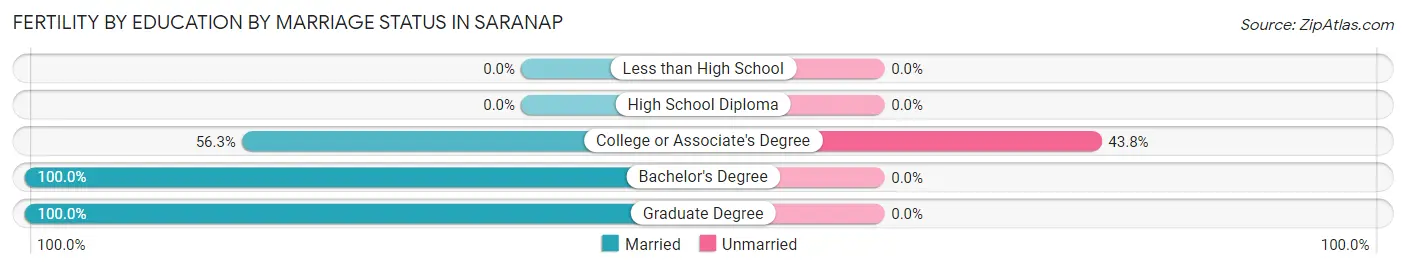
| Educational Attainment | Married | Unmarried |
| Less than High School | 0 (0.0%) | 0 (0.0%) |
| High School Diploma | 0 (0.0%) | 0 (0.0%) |
| College or Associate's Degree | 45 (56.2%) | 35 (43.8%) |
| Bachelor's Degree | 76 (100.0%) | 0 (0.0%) |
| Graduate Degree | 15 (100.0%) | 0 (0.0%) |
| Total | 136 (79.5%) | 35 (20.5%) |
Employment Characteristics in Saranap
Employment by Class of Employer in Saranap
Among the 3,232 employed individuals in Saranap, private company employees (1,893 | 58.6%), not-for-profit organizations (470 | 14.5%), and self-employed (not incorporated) (314 | 9.7%) make up the most common classes of employment.
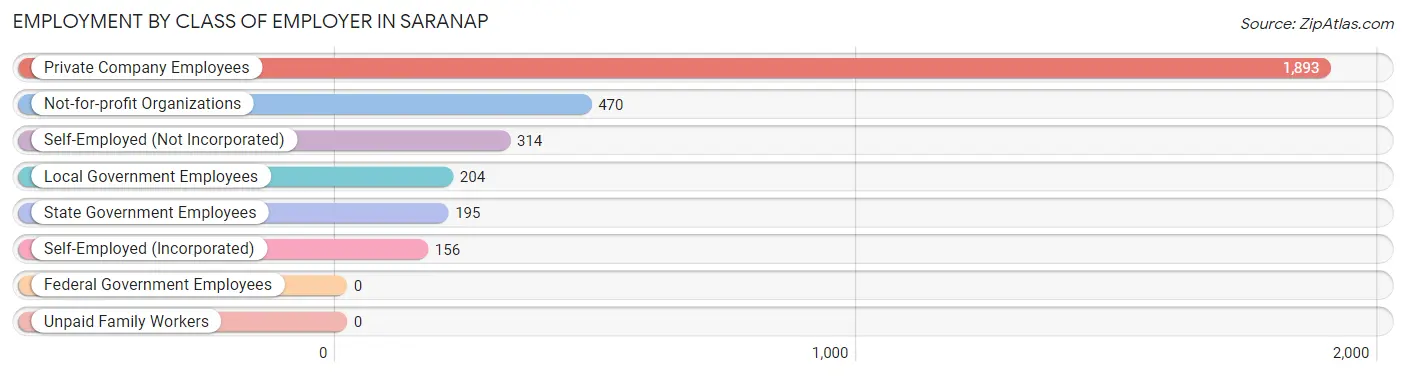
| Employer Class | # Employees | % Employees |
| Private Company Employees | 1,893 | 58.6% |
| Self-Employed (Incorporated) | 156 | 4.8% |
| Self-Employed (Not Incorporated) | 314 | 9.7% |
| Not-for-profit Organizations | 470 | 14.5% |
| Local Government Employees | 204 | 6.3% |
| State Government Employees | 195 | 6.0% |
| Federal Government Employees | 0 | 0.0% |
| Unpaid Family Workers | 0 | 0.0% |
| Total | 3,232 | 100.0% |
Employment Status by Age in Saranap
According to the labor force statistics for Saranap, out of the total population over 16 years of age (4,914), 70.0% or 3,440 individuals are in the labor force, with 3.5% or 120 of them unemployed. The age group with the highest labor force participation rate is 25 to 29 years, with 100.0% or 193 individuals in the labor force. Within the labor force, the 16 to 19 years age range has the highest percentage of unemployed individuals, with 17.6% or 13 of them being unemployed.
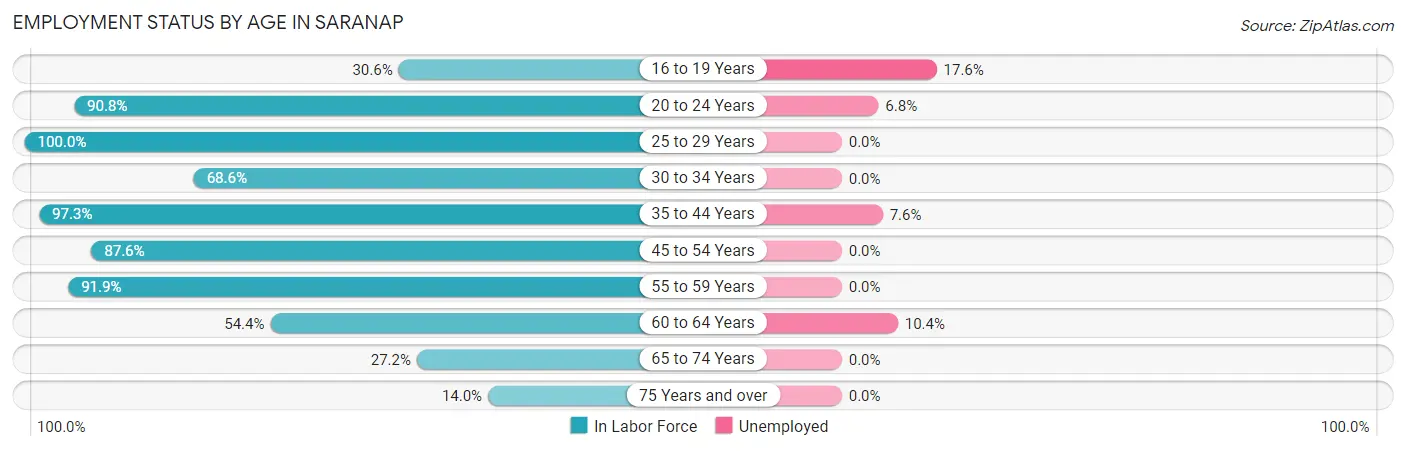
| Age Bracket | In Labor Force | Unemployed |
| 16 to 19 Years | 74 (30.6%) | 13 (17.6%) |
| 20 to 24 Years | 383 (90.8%) | 26 (6.8%) |
| 25 to 29 Years | 193 (100.0%) | 0 (0.0%) |
| 30 to 34 Years | 238 (68.6%) | 0 (0.0%) |
| 35 to 44 Years | 806 (97.3%) | 61 (7.6%) |
| 45 to 54 Years | 1,162 (87.6%) | 0 (0.0%) |
| 55 to 59 Years | 170 (91.9%) | 0 (0.0%) |
| 60 to 64 Years | 192 (54.4%) | 20 (10.4%) |
| 65 to 74 Years | 160 (27.2%) | 0 (0.0%) |
| 75 Years and over | 60 (14.0%) | 0 (0.0%) |
| Total | 3,440 (70.0%) | 120 (3.5%) |
Employment Status by Educational Attainment in Saranap
According to labor force statistics for Saranap, 85.4% of individuals (2,761) out of the total population between 25 and 64 years of age (3,233) are in the labor force, with 2.9% or 80 of them being unemployed. The group with the highest labor force participation rate are those with the educational attainment of college / associate degree, with 94.6% or 687 individuals in the labor force. Within the labor force, individuals with college / associate degree education have the highest percentage of unemployment, with 3.5% or 24 of them being unemployed.
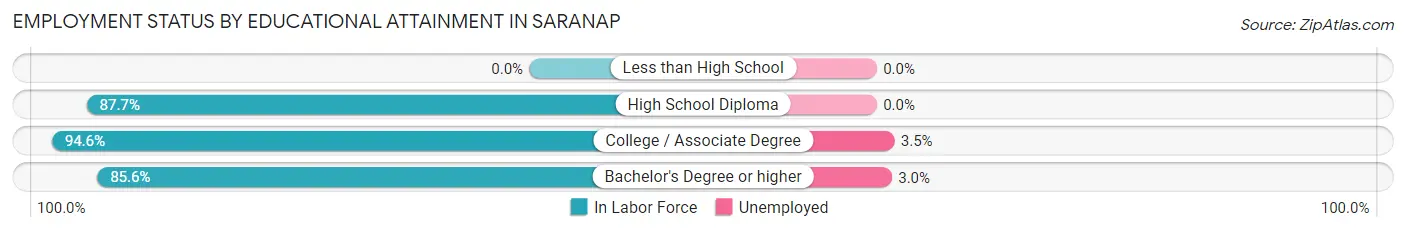
| Educational Attainment | In Labor Force | Unemployed |
| Less than High School | 0 (0.0%) | 0 (0.0%) |
| High School Diploma | 179 (87.7%) | 0 (0.0%) |
| College / Associate Degree | 687 (94.6%) | 25 (3.5%) |
| Bachelor's Degree or higher | 1,896 (85.6%) | 66 (3.0%) |
| Total | 2,761 (85.4%) | 94 (2.9%) |
Employment Occupations by Sex in Saranap
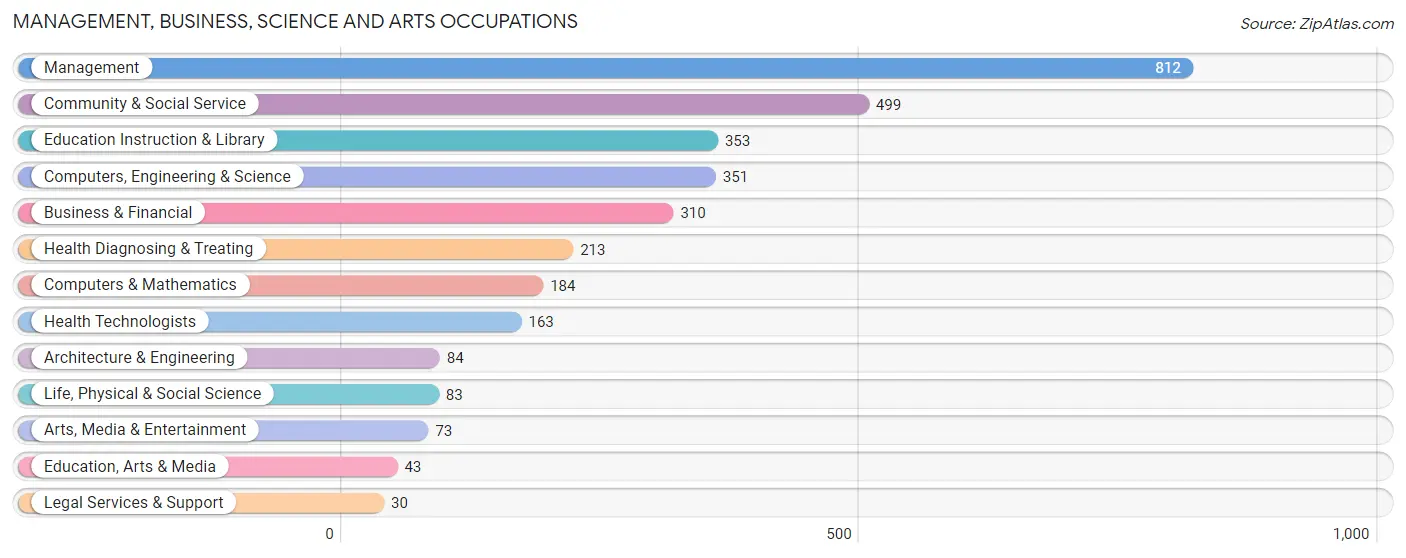
Management, Business, Science and Arts Occupations
The most common Management, Business, Science and Arts occupations in Saranap are Management (812 | 24.5%), Community & Social Service (499 | 15.0%), Education Instruction & Library (353 | 10.6%), Computers, Engineering & Science (351 | 10.6%), and Business & Financial (310 | 9.3%).
Management, Business, Science and Arts Occupations by Sex
Within the Management, Business, Science and Arts occupations in Saranap, the most male-oriented occupations are Computers & Mathematics (100.0%), Life, Physical & Social Science (100.0%), and Legal Services & Support (100.0%), while the most female-oriented occupations are Health Diagnosing & Treating (85.9%), Health Technologists (81.6%), and Education Instruction & Library (75.1%).
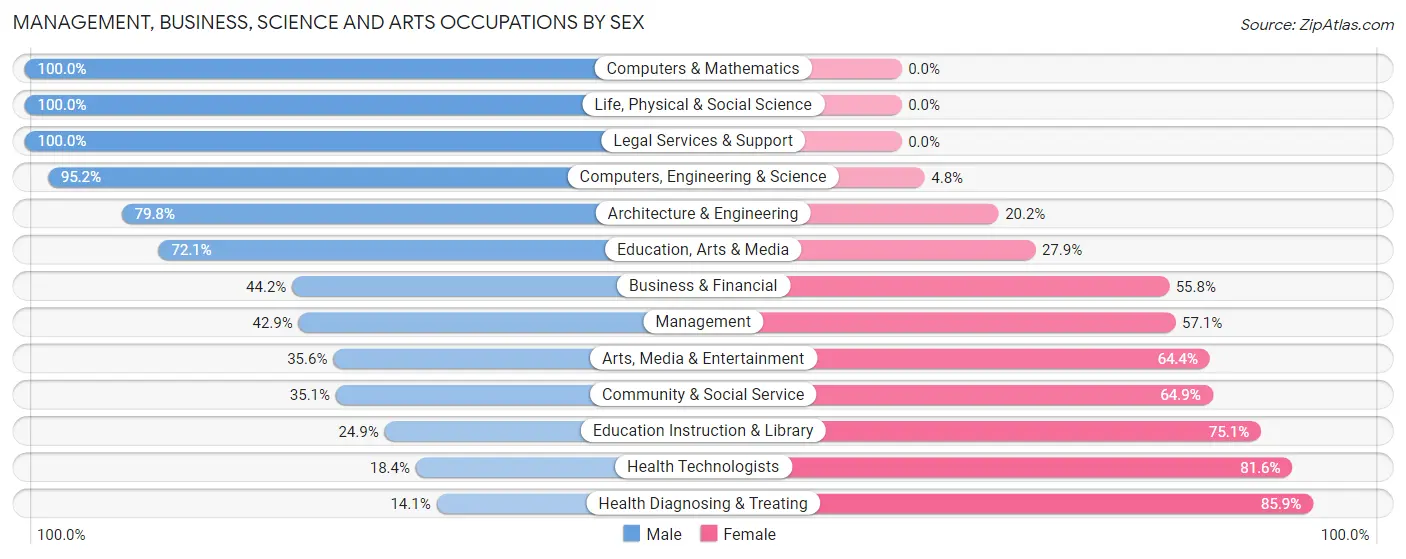
| Occupation | Male | Female |
| Management | 348 (42.9%) | 464 (57.1%) |
| Business & Financial | 137 (44.2%) | 173 (55.8%) |
| Computers, Engineering & Science | 334 (95.2%) | 17 (4.8%) |
| Computers & Mathematics | 184 (100.0%) | 0 (0.0%) |
| Architecture & Engineering | 67 (79.8%) | 17 (20.2%) |
| Life, Physical & Social Science | 83 (100.0%) | 0 (0.0%) |
| Community & Social Service | 175 (35.1%) | 324 (64.9%) |
| Education, Arts & Media | 31 (72.1%) | 12 (27.9%) |
| Legal Services & Support | 30 (100.0%) | 0 (0.0%) |
| Education Instruction & Library | 88 (24.9%) | 265 (75.1%) |
| Arts, Media & Entertainment | 26 (35.6%) | 47 (64.4%) |
| Health Diagnosing & Treating | 30 (14.1%) | 183 (85.9%) |
| Health Technologists | 30 (18.4%) | 133 (81.6%) |
| Total (Category) | 1,024 (46.9%) | 1,161 (53.1%) |
| Total (Overall) | 1,776 (53.5%) | 1,542 (46.5%) |
Services Occupations
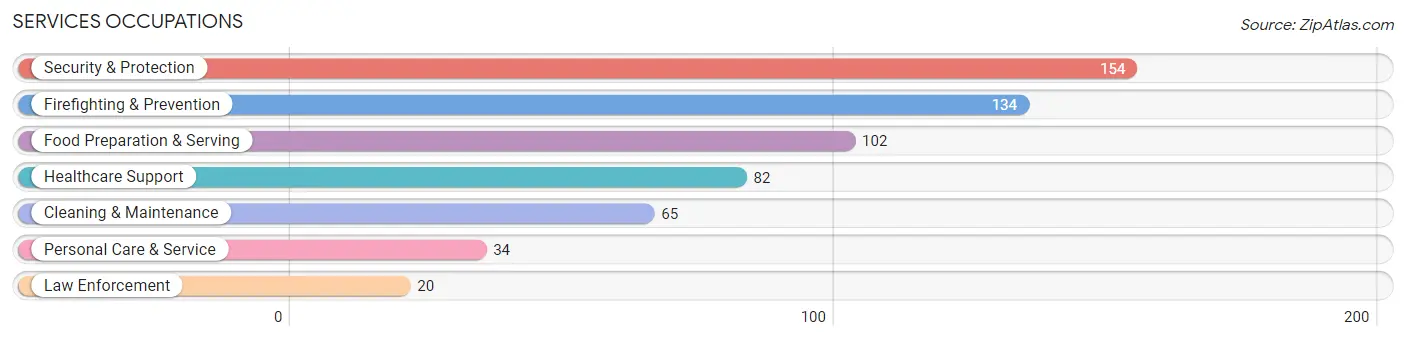
The most common Services occupations in Saranap are Security & Protection (154 | 4.6%), Firefighting & Prevention (134 | 4.0%), Food Preparation & Serving (102 | 3.1%), Healthcare Support (82 | 2.5%), and Cleaning & Maintenance (65 | 2.0%).
Services Occupations by Sex
Within the Services occupations in Saranap, the most male-oriented occupations are Security & Protection (100.0%), Firefighting & Prevention (100.0%), and Law Enforcement (100.0%), while the most female-oriented occupations are Healthcare Support (100.0%), Personal Care & Service (100.0%), and Cleaning & Maintenance (55.4%).
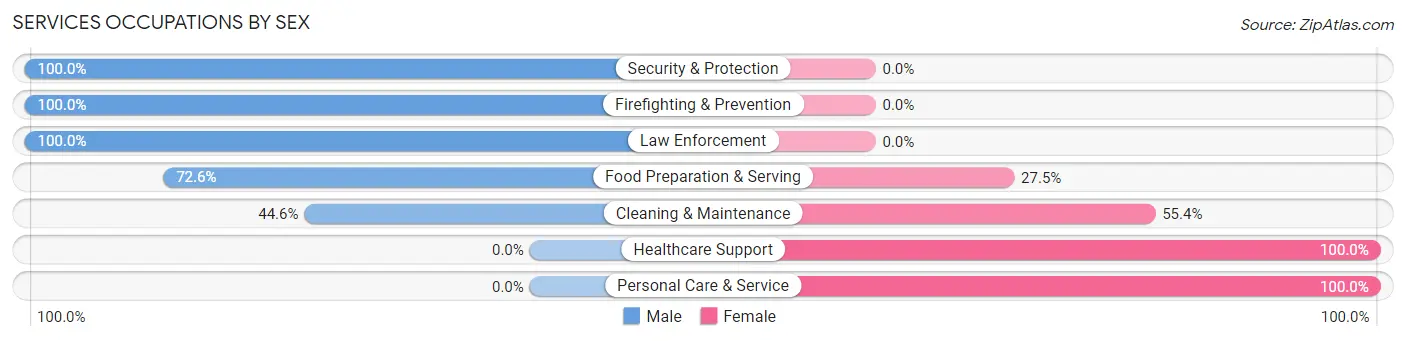
| Occupation | Male | Female |
| Healthcare Support | 0 (0.0%) | 82 (100.0%) |
| Security & Protection | 154 (100.0%) | 0 (0.0%) |
| Firefighting & Prevention | 134 (100.0%) | 0 (0.0%) |
| Law Enforcement | 20 (100.0%) | 0 (0.0%) |
| Food Preparation & Serving | 74 (72.6%) | 28 (27.5%) |
| Cleaning & Maintenance | 29 (44.6%) | 36 (55.4%) |
| Personal Care & Service | 0 (0.0%) | 34 (100.0%) |
| Total (Category) | 257 (58.8%) | 180 (41.2%) |
| Total (Overall) | 1,776 (53.5%) | 1,542 (46.5%) |
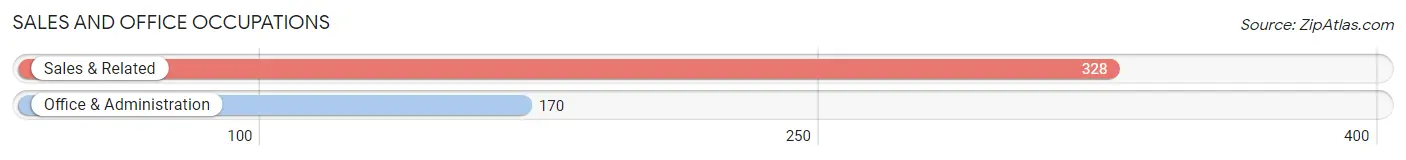
Sales and Office Occupations
The most common Sales and Office occupations in Saranap are Sales & Related (328 | 9.9%), and Office & Administration (170 | 5.1%).
Sales and Office Occupations by Sex
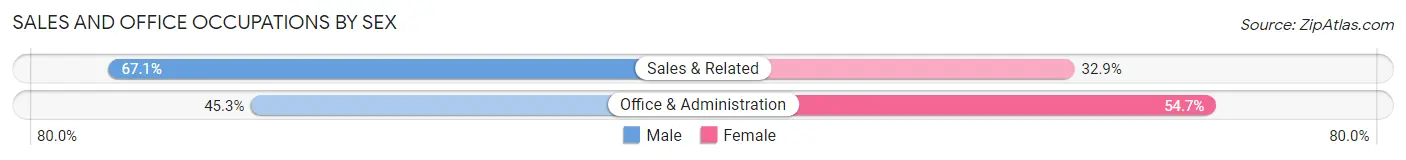
| Occupation | Male | Female |
| Sales & Related | 220 (67.1%) | 108 (32.9%) |
| Office & Administration | 77 (45.3%) | 93 (54.7%) |
| Total (Category) | 297 (59.6%) | 201 (40.4%) |
| Total (Overall) | 1,776 (53.5%) | 1,542 (46.5%) |
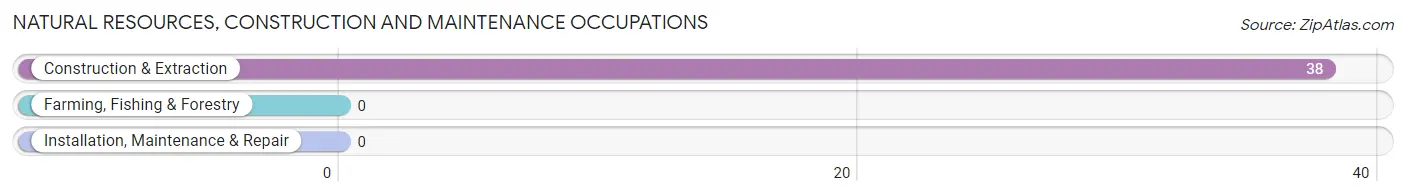
Natural Resources, Construction and Maintenance Occupations
The most common Natural Resources, Construction and Maintenance occupations in Saranap are , and Construction & Extraction (38 | 1.1%).
Natural Resources, Construction and Maintenance Occupations by Sex
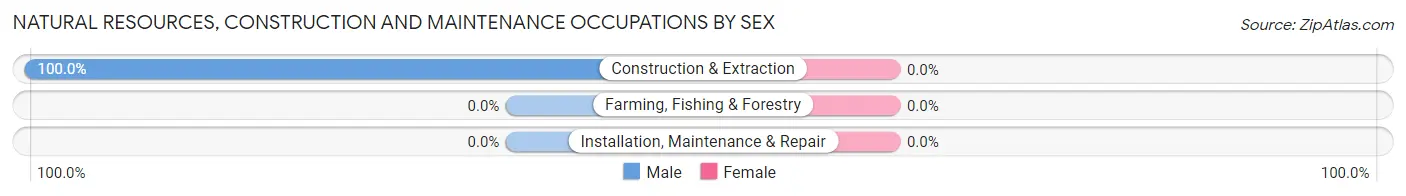
| Occupation | Male | Female |
| Farming, Fishing & Forestry | 0 (0.0%) | 0 (0.0%) |
| Construction & Extraction | 38 (100.0%) | 0 (0.0%) |
| Installation, Maintenance & Repair | 0 (0.0%) | 0 (0.0%) |
| Total (Category) | 38 (100.0%) | 0 (0.0%) |
| Total (Overall) | 1,776 (53.5%) | 1,542 (46.5%) |
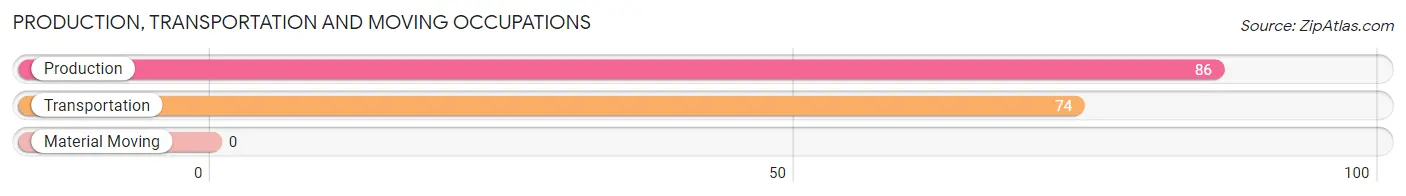
Production, Transportation and Moving Occupations
The most common Production, Transportation and Moving occupations in Saranap are Production (86 | 2.6%), and Transportation (74 | 2.2%).
Production, Transportation and Moving Occupations by Sex
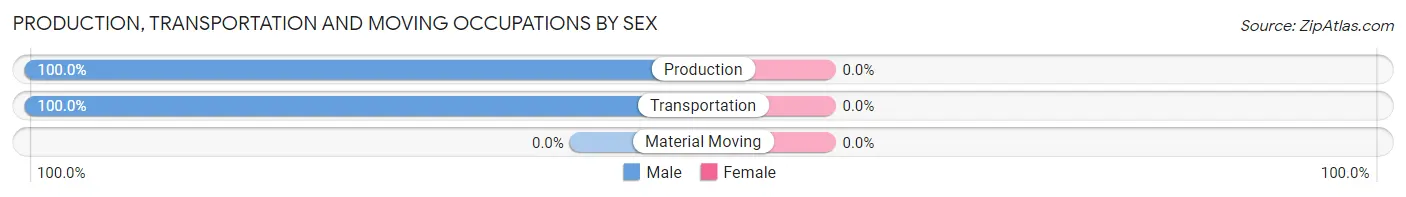
| Occupation | Male | Female |
| Production | 86 (100.0%) | 0 (0.0%) |
| Transportation | 74 (100.0%) | 0 (0.0%) |
| Material Moving | 0 (0.0%) | 0 (0.0%) |
| Total (Category) | 160 (100.0%) | 0 (0.0%) |
| Total (Overall) | 1,776 (53.5%) | 1,542 (46.5%) |
Employment Industries by Sex in Saranap
Employment Industries in Saranap
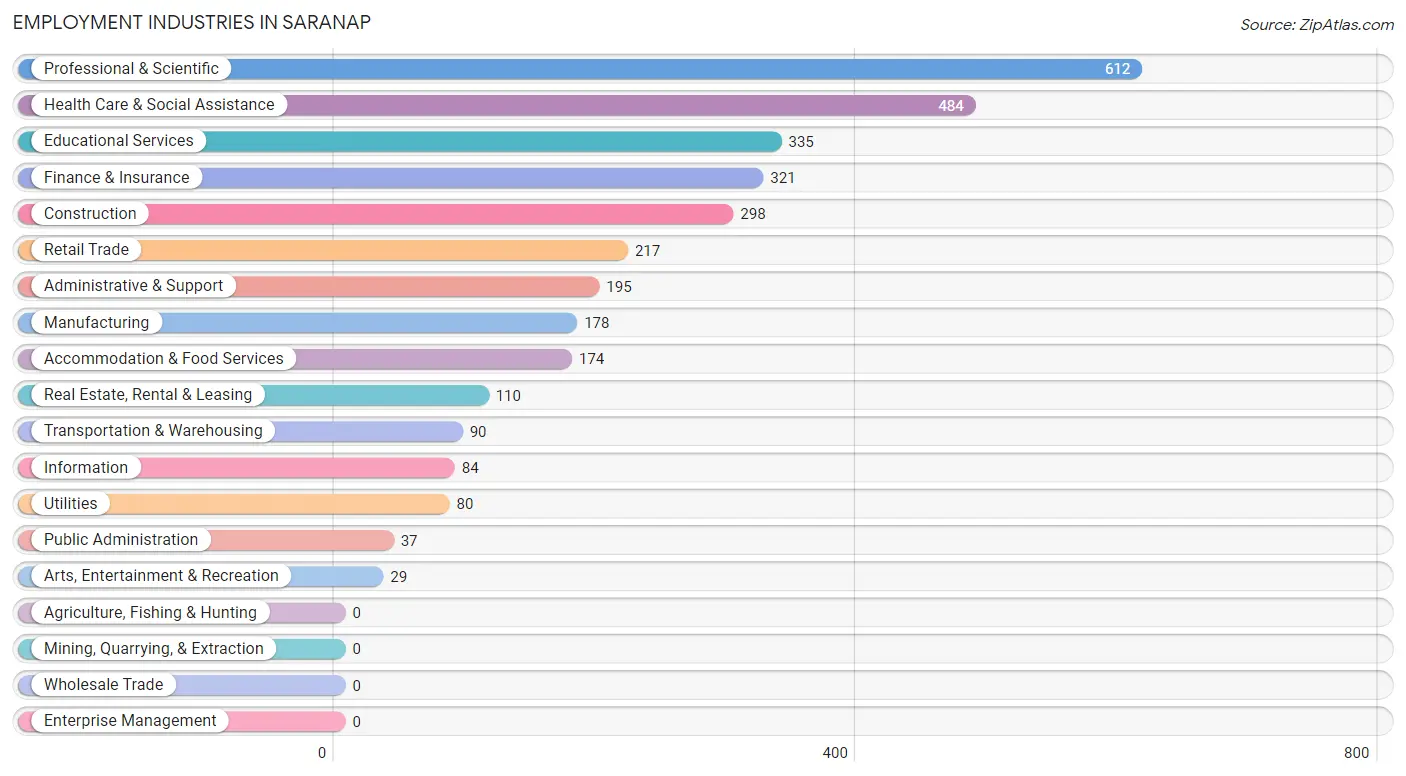
The major employment industries in Saranap include Professional & Scientific (612 | 18.4%), Health Care & Social Assistance (484 | 14.6%), Educational Services (335 | 10.1%), Finance & Insurance (321 | 9.7%), and Construction (298 | 9.0%).
Employment Industries by Sex in Saranap
The Saranap industries that see more men than women are Construction (100.0%), Utilities (100.0%), and Arts, Entertainment & Recreation (100.0%), whereas the industries that tend to have a higher number of women are Health Care & Social Assistance (80.2%), Retail Trade (75.6%), and Educational Services (73.7%).
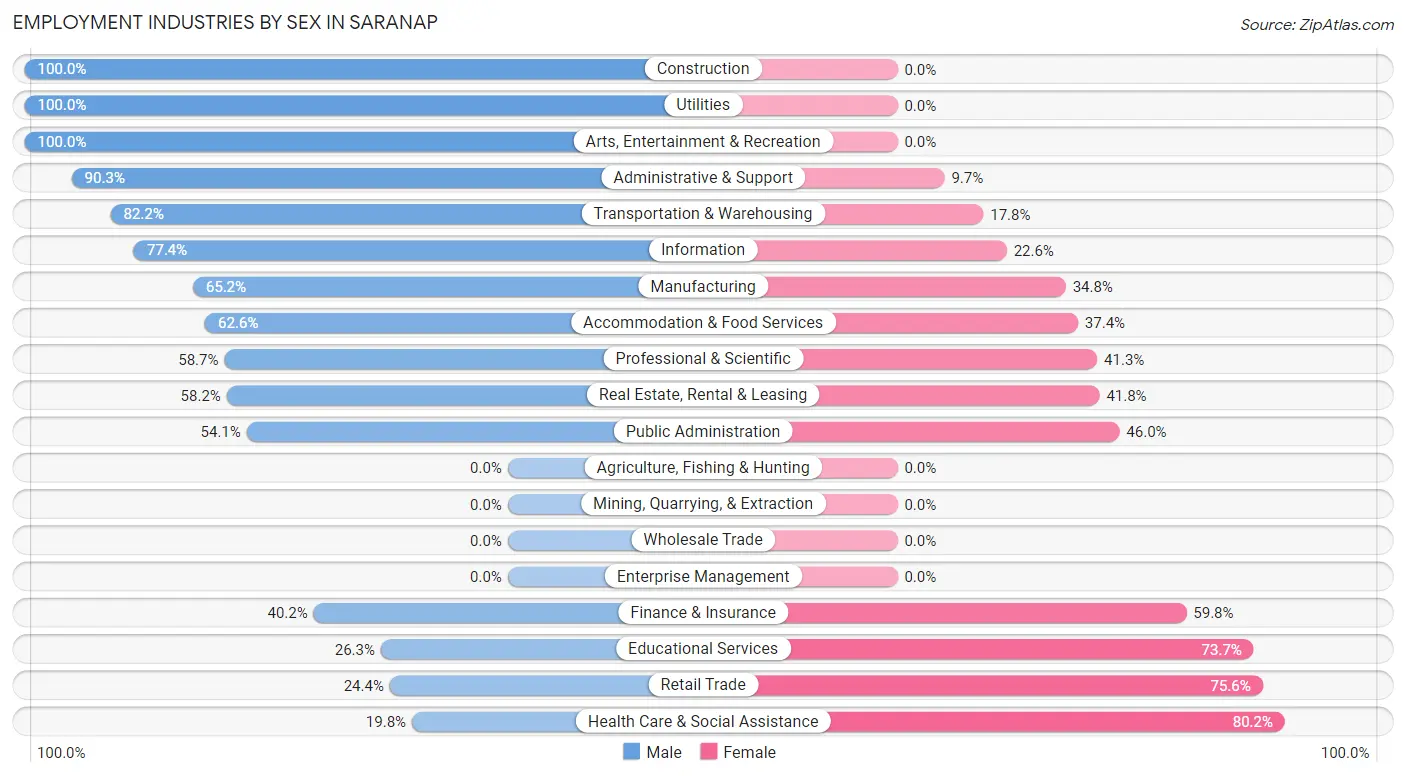
| Industry | Male | Female |
| Agriculture, Fishing & Hunting | 0 (0.0%) | 0 (0.0%) |
| Mining, Quarrying, & Extraction | 0 (0.0%) | 0 (0.0%) |
| Construction | 298 (100.0%) | 0 (0.0%) |
| Manufacturing | 116 (65.2%) | 62 (34.8%) |
| Wholesale Trade | 0 (0.0%) | 0 (0.0%) |
| Retail Trade | 53 (24.4%) | 164 (75.6%) |
| Transportation & Warehousing | 74 (82.2%) | 16 (17.8%) |
| Utilities | 80 (100.0%) | 0 (0.0%) |
| Information | 65 (77.4%) | 19 (22.6%) |
| Finance & Insurance | 129 (40.2%) | 192 (59.8%) |
| Real Estate, Rental & Leasing | 64 (58.2%) | 46 (41.8%) |
| Professional & Scientific | 359 (58.7%) | 253 (41.3%) |
| Enterprise Management | 0 (0.0%) | 0 (0.0%) |
| Administrative & Support | 176 (90.3%) | 19 (9.7%) |
| Educational Services | 88 (26.3%) | 247 (73.7%) |
| Health Care & Social Assistance | 96 (19.8%) | 388 (80.2%) |
| Arts, Entertainment & Recreation | 29 (100.0%) | 0 (0.0%) |
| Accommodation & Food Services | 109 (62.6%) | 65 (37.4%) |
| Public Administration | 20 (54.0%) | 17 (46.0%) |
| Total | 1,776 (53.5%) | 1,542 (46.5%) |
Education in Saranap
School Enrollment in Saranap
The most common levels of schooling among the 1,453 students in Saranap are elementary school (354 | 24.4%), high school (349 | 24.0%), and college / undergraduate (238 | 16.4%).
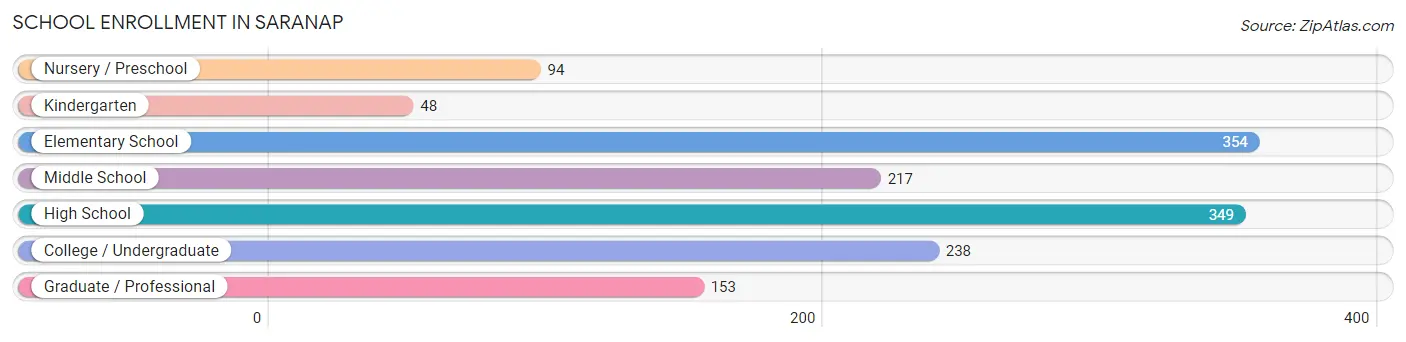
| School Level | # Students | % Students |
| Nursery / Preschool | 94 | 6.5% |
| Kindergarten | 48 | 3.3% |
| Elementary School | 354 | 24.4% |
| Middle School | 217 | 14.9% |
| High School | 349 | 24.0% |
| College / Undergraduate | 238 | 16.4% |
| Graduate / Professional | 153 | 10.5% |
| Total | 1,453 | 100.0% |
School Enrollment by Age by Funding Source in Saranap
Out of a total of 1,453 students who are enrolled in schools in Saranap, 355 (24.4%) attend a private institution, while the remaining 1,098 (75.6%) are enrolled in public schools. The age group of 35 years and over has the highest likelihood of being enrolled in private schools, with 41 (100.0% in the age bracket) enrolled. Conversely, the age group of 18 to 19 year olds has the lowest likelihood of being enrolled in a private school, with 48 (100.0% in the age bracket) attending a public institution.
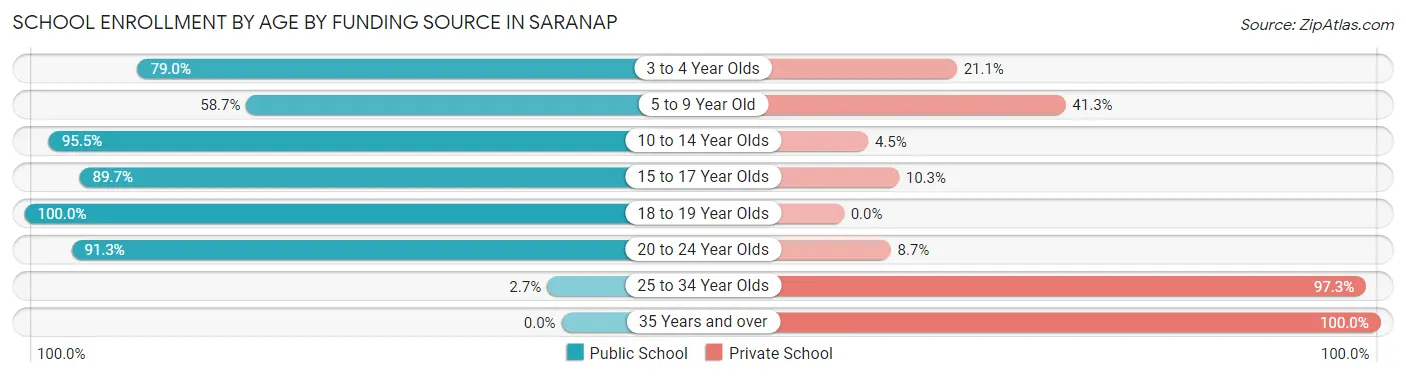
| Age Bracket | Public School | Private School |
| 3 to 4 Year Olds | 60 (78.9%) | 16 (21.0%) |
| 5 to 9 Year Old | 226 (58.7%) | 159 (41.3%) |
| 10 to 14 Year Olds | 253 (95.5%) | 12 (4.5%) |
| 15 to 17 Year Olds | 280 (89.7%) | 32 (10.3%) |
| 18 to 19 Year Olds | 48 (100.0%) | 0 (0.0%) |
| 20 to 24 Year Olds | 230 (91.3%) | 22 (8.7%) |
| 25 to 34 Year Olds | 2 (2.7%) | 72 (97.3%) |
| 35 Years and over | 0 (0.0%) | 41 (100.0%) |
| Total | 1,098 (75.6%) | 355 (24.4%) |
Educational Attainment by Field of Study in Saranap
Business (453 | 14.6%), social sciences (442 | 14.2%), engineering (296 | 9.5%), psychology (281 | 9.0%), and bio, nature & agricultural (253 | 8.1%) are the most common fields of study among 3,107 individuals in Saranap who have obtained a bachelor's degree or higher.
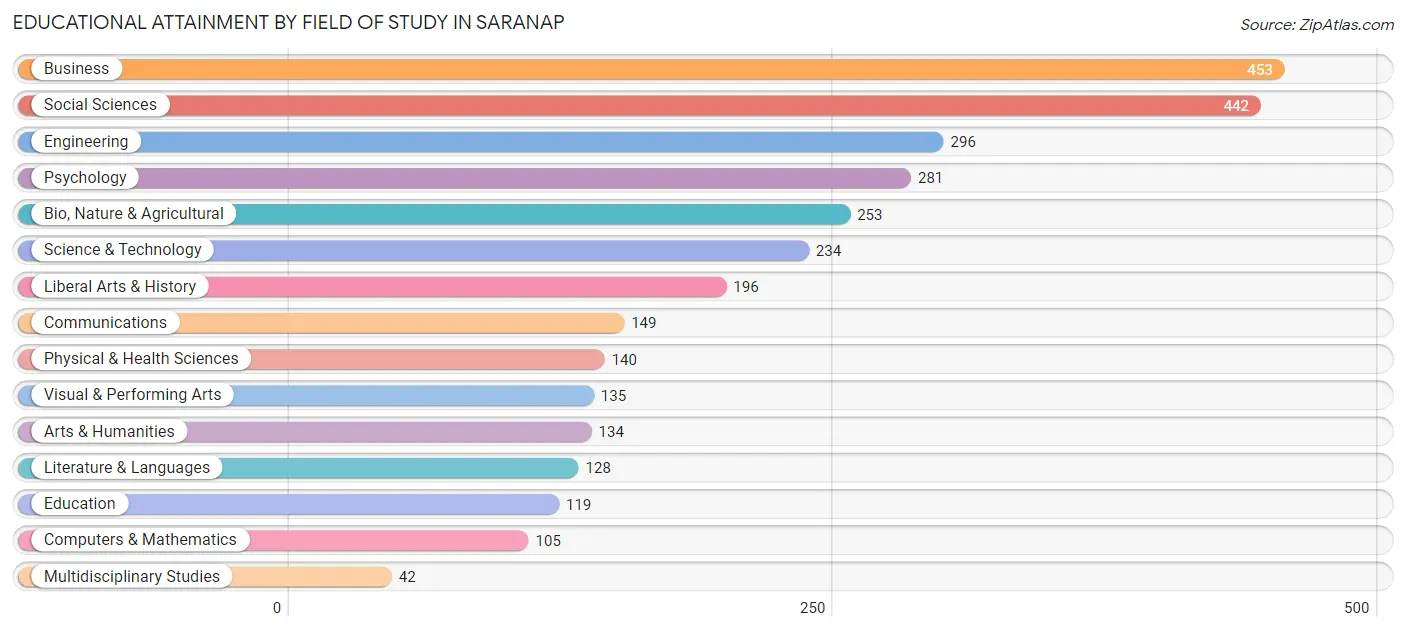
| Field of Study | # Graduates | % Graduates |
| Computers & Mathematics | 105 | 3.4% |
| Bio, Nature & Agricultural | 253 | 8.1% |
| Physical & Health Sciences | 140 | 4.5% |
| Psychology | 281 | 9.0% |
| Social Sciences | 442 | 14.2% |
| Engineering | 296 | 9.5% |
| Multidisciplinary Studies | 42 | 1.3% |
| Science & Technology | 234 | 7.5% |
| Business | 453 | 14.6% |
| Education | 119 | 3.8% |
| Literature & Languages | 128 | 4.1% |
| Liberal Arts & History | 196 | 6.3% |
| Visual & Performing Arts | 135 | 4.3% |
| Communications | 149 | 4.8% |
| Arts & Humanities | 134 | 4.3% |
| Total | 3,107 | 100.0% |
Transportation & Commute in Saranap
Vehicle Availability by Sex in Saranap
The most prevalent vehicle ownership categories in Saranap are males with 2 vehicles (739, accounting for 43.3%) and females with 2 vehicles (679, making up 48.6%).
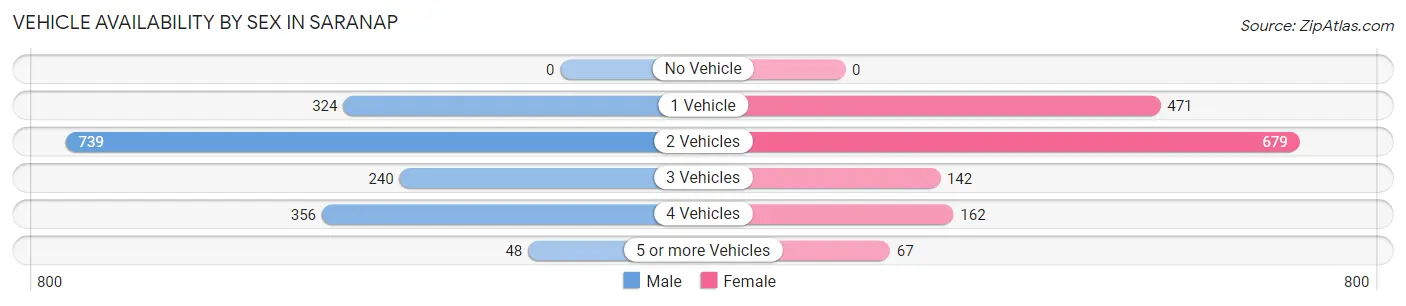
| Vehicles Available | Male | Female |
| No Vehicle | 0 (0.0%) | 0 (0.0%) |
| 1 Vehicle | 324 (19.0%) | 471 (31.0%) |
| 2 Vehicles | 739 (43.3%) | 679 (44.6%) |
| 3 Vehicles | 240 (14.1%) | 142 (9.3%) |
| 4 Vehicles | 356 (20.9%) | 162 (10.6%) |
| 5 or more Vehicles | 48 (2.8%) | 67 (4.4%) |
| Total | 1,707 (100.0%) | 1,521 (100.0%) |
Commute Time in Saranap
The most frequently occuring commute durations in Saranap are 45 to 59 minutes (345 commuters, 14.1%), 15 to 19 minutes (325 commuters, 13.3%), and 20 to 24 minutes (303 commuters, 12.4%).
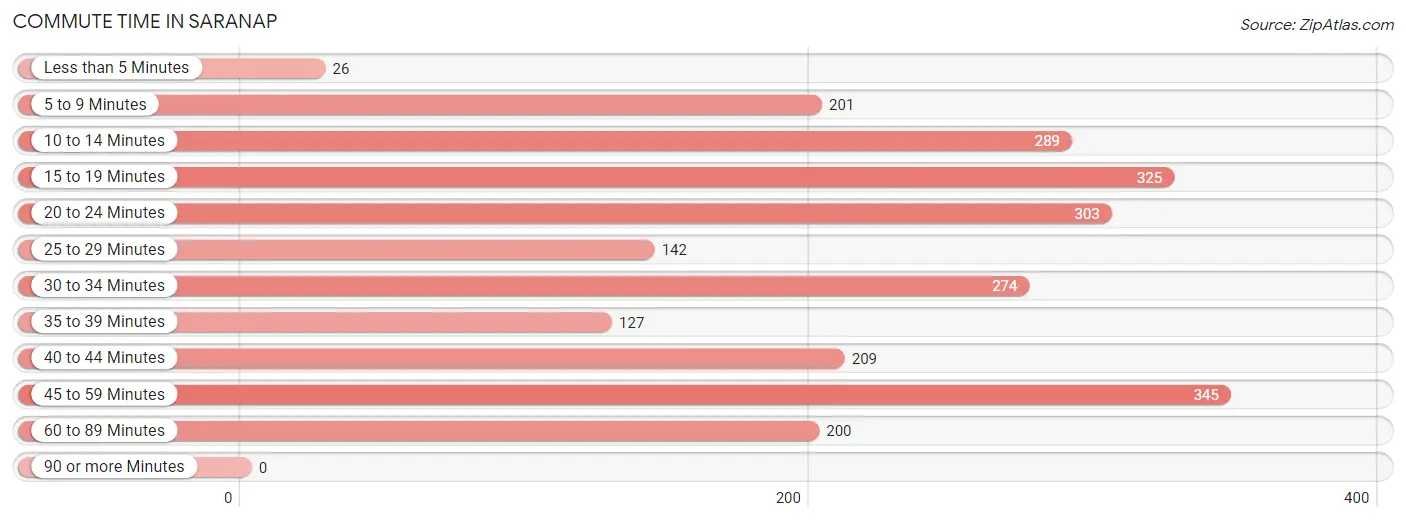
| Commute Time | # Commuters | % Commuters |
| Less than 5 Minutes | 26 | 1.1% |
| 5 to 9 Minutes | 201 | 8.2% |
| 10 to 14 Minutes | 289 | 11.8% |
| 15 to 19 Minutes | 325 | 13.3% |
| 20 to 24 Minutes | 303 | 12.4% |
| 25 to 29 Minutes | 142 | 5.8% |
| 30 to 34 Minutes | 274 | 11.2% |
| 35 to 39 Minutes | 127 | 5.2% |
| 40 to 44 Minutes | 209 | 8.6% |
| 45 to 59 Minutes | 345 | 14.1% |
| 60 to 89 Minutes | 200 | 8.2% |
| 90 or more Minutes | 0 | 0.0% |
Commute Time by Sex in Saranap
The most common commute times in Saranap are 45 to 59 minutes (221 commuters, 17.4%) for males and 10 to 14 minutes (242 commuters, 20.7%) for females.
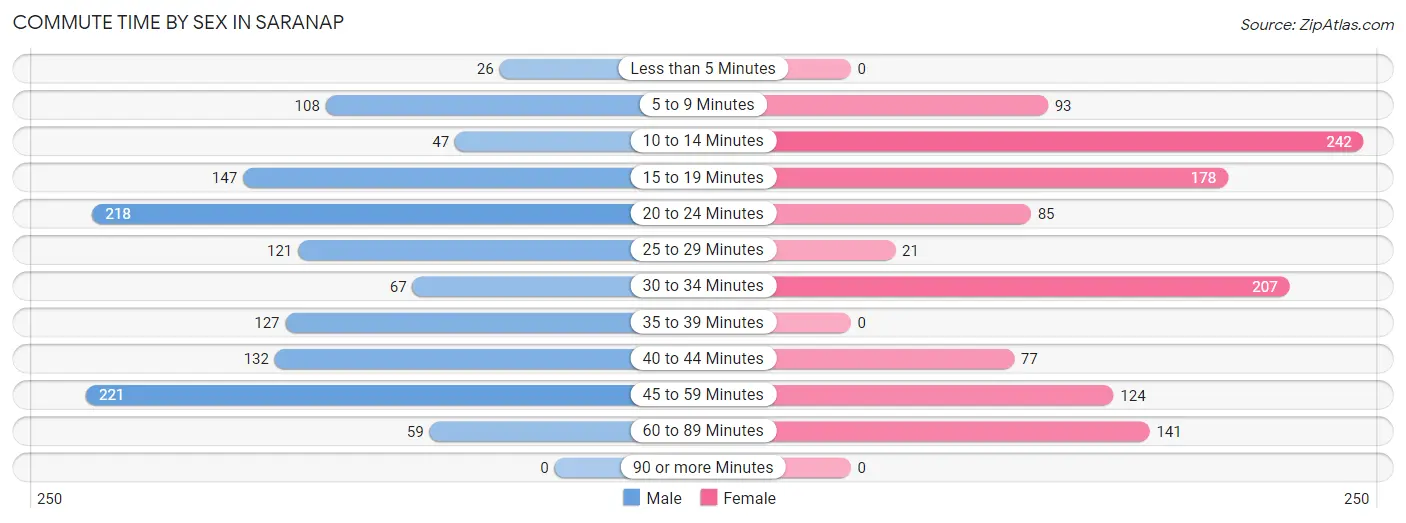
| Commute Time | Male | Female |
| Less than 5 Minutes | 26 (2.0%) | 0 (0.0%) |
| 5 to 9 Minutes | 108 (8.5%) | 93 (8.0%) |
| 10 to 14 Minutes | 47 (3.7%) | 242 (20.7%) |
| 15 to 19 Minutes | 147 (11.6%) | 178 (15.2%) |
| 20 to 24 Minutes | 218 (17.1%) | 85 (7.3%) |
| 25 to 29 Minutes | 121 (9.5%) | 21 (1.8%) |
| 30 to 34 Minutes | 67 (5.3%) | 207 (17.7%) |
| 35 to 39 Minutes | 127 (10.0%) | 0 (0.0%) |
| 40 to 44 Minutes | 132 (10.4%) | 77 (6.6%) |
| 45 to 59 Minutes | 221 (17.4%) | 124 (10.6%) |
| 60 to 89 Minutes | 59 (4.6%) | 141 (12.1%) |
| 90 or more Minutes | 0 (0.0%) | 0 (0.0%) |
Time of Departure to Work by Sex in Saranap
The most frequent times of departure to work in Saranap are 8:00 AM to 8:29 AM (233, 18.3%) for males and 7:30 AM to 7:59 AM (376, 32.2%) for females.
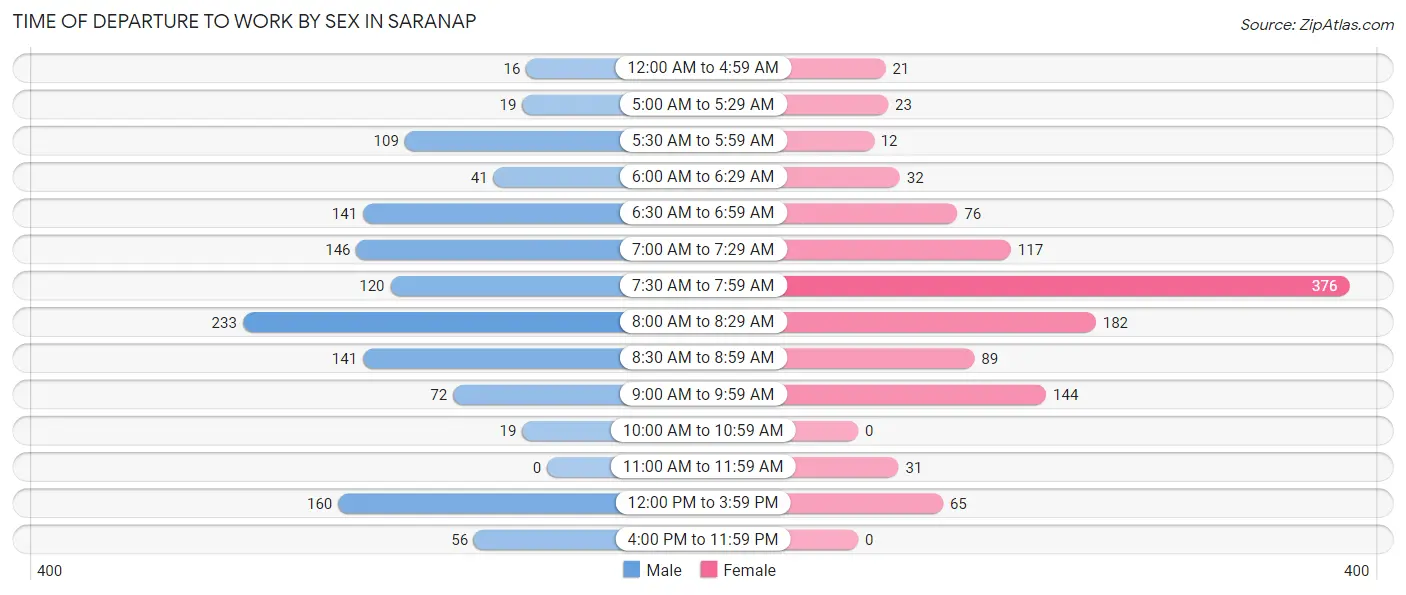
| Time of Departure | Male | Female |
| 12:00 AM to 4:59 AM | 16 (1.3%) | 21 (1.8%) |
| 5:00 AM to 5:29 AM | 19 (1.5%) | 23 (2.0%) |
| 5:30 AM to 5:59 AM | 109 (8.6%) | 12 (1.0%) |
| 6:00 AM to 6:29 AM | 41 (3.2%) | 32 (2.7%) |
| 6:30 AM to 6:59 AM | 141 (11.1%) | 76 (6.5%) |
| 7:00 AM to 7:29 AM | 146 (11.5%) | 117 (10.0%) |
| 7:30 AM to 7:59 AM | 120 (9.4%) | 376 (32.2%) |
| 8:00 AM to 8:29 AM | 233 (18.3%) | 182 (15.6%) |
| 8:30 AM to 8:59 AM | 141 (11.1%) | 89 (7.6%) |
| 9:00 AM to 9:59 AM | 72 (5.7%) | 144 (12.3%) |
| 10:00 AM to 10:59 AM | 19 (1.5%) | 0 (0.0%) |
| 11:00 AM to 11:59 AM | 0 (0.0%) | 31 (2.6%) |
| 12:00 PM to 3:59 PM | 160 (12.6%) | 65 (5.6%) |
| 4:00 PM to 11:59 PM | 56 (4.4%) | 0 (0.0%) |
| Total | 1,273 (100.0%) | 1,168 (100.0%) |
Housing Occupancy in Saranap
Occupancy by Ownership in Saranap
Of the total 2,481 dwellings in Saranap, owner-occupied units account for 1,571 (63.3%), while renter-occupied units make up 910 (36.7%).
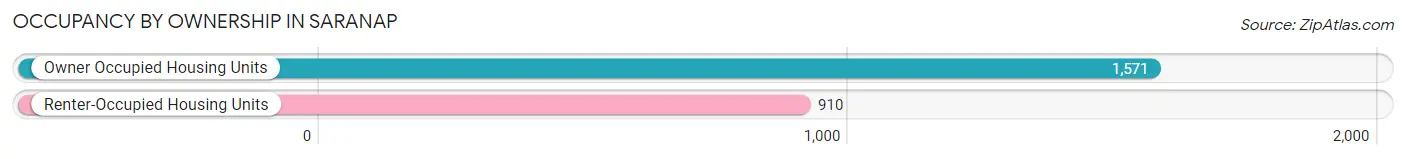
| Occupancy | # Housing Units | % Housing Units |
| Owner Occupied Housing Units | 1,571 | 63.3% |
| Renter-Occupied Housing Units | 910 | 36.7% |
| Total Occupied Housing Units | 2,481 | 100.0% |
Occupancy by Household Size in Saranap
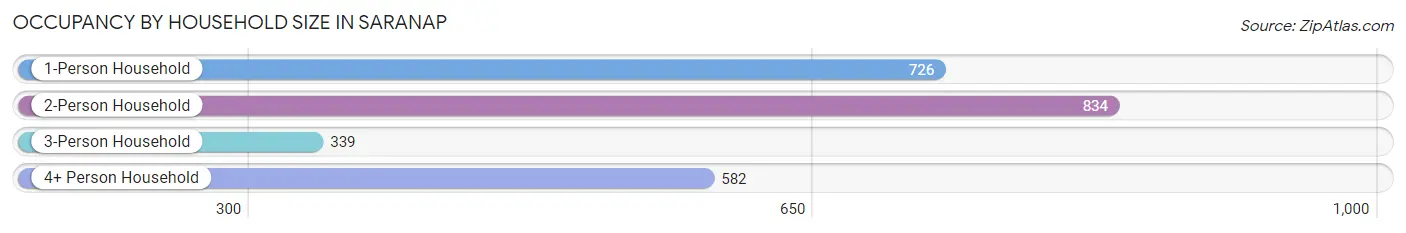
| Household Size | # Housing Units | % Housing Units |
| 1-Person Household | 726 | 29.3% |
| 2-Person Household | 834 | 33.6% |
| 3-Person Household | 339 | 13.7% |
| 4+ Person Household | 582 | 23.5% |
| Total Housing Units | 2,481 | 100.0% |
Occupancy by Ownership by Household Size in Saranap
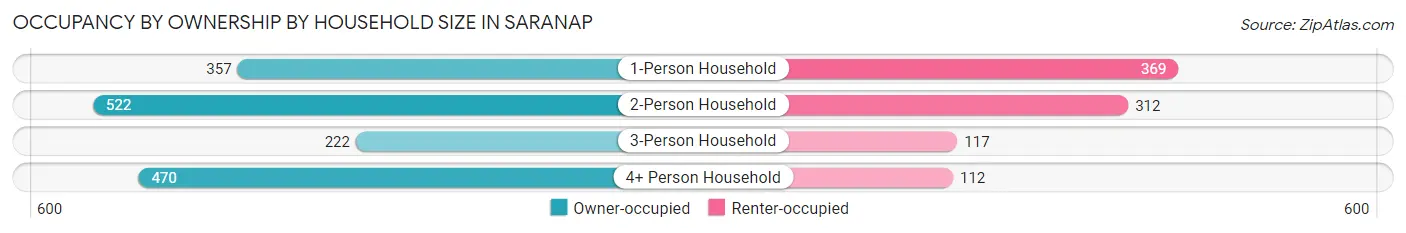
| Household Size | Owner-occupied | Renter-occupied |
| 1-Person Household | 357 (49.2%) | 369 (50.8%) |
| 2-Person Household | 522 (62.6%) | 312 (37.4%) |
| 3-Person Household | 222 (65.5%) | 117 (34.5%) |
| 4+ Person Household | 470 (80.8%) | 112 (19.2%) |
| Total Housing Units | 1,571 (63.3%) | 910 (36.7%) |
Occupancy by Educational Attainment in Saranap
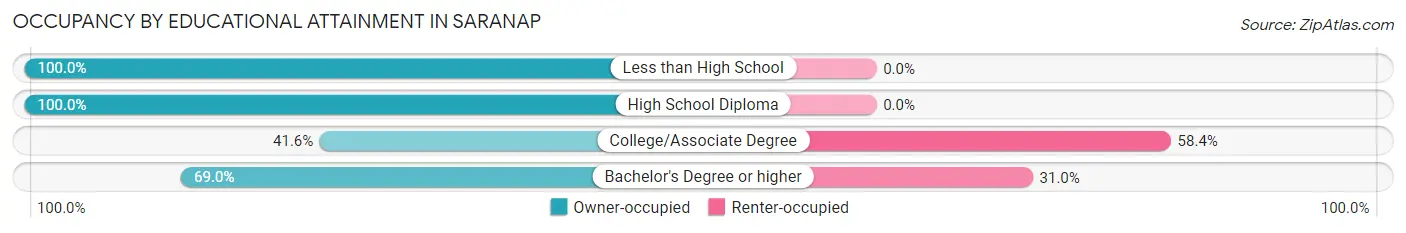
| Household Size | Owner-occupied | Renter-occupied |
| Less than High School | 35 (100.0%) | 0 (0.0%) |
| High School Diploma | 17 (100.0%) | 0 (0.0%) |
| College/Associate Degree | 238 (41.6%) | 334 (58.4%) |
| Bachelor's Degree or higher | 1,281 (69.0%) | 576 (31.0%) |
Occupancy by Age of Householder in Saranap
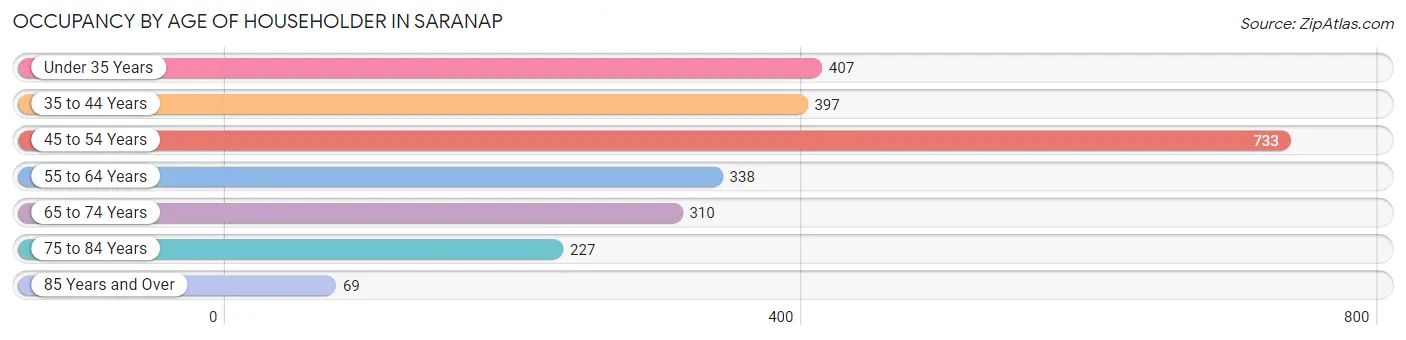
| Age Bracket | # Households | % Households |
| Under 35 Years | 407 | 16.4% |
| 35 to 44 Years | 397 | 16.0% |
| 45 to 54 Years | 733 | 29.5% |
| 55 to 64 Years | 338 | 13.6% |
| 65 to 74 Years | 310 | 12.5% |
| 75 to 84 Years | 227 | 9.1% |
| 85 Years and Over | 69 | 2.8% |
| Total | 2,481 | 100.0% |
Housing Finances in Saranap
Median Income by Occupancy in Saranap
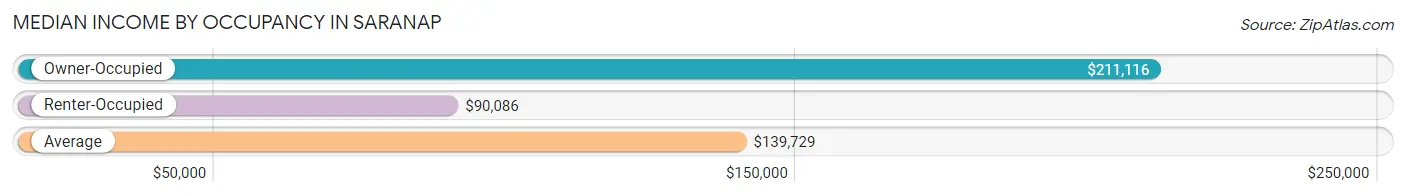
| Occupancy Type | # Households | Median Income |
| Owner-Occupied | 1,571 (63.3%) | $211,116 |
| Renter-Occupied | 910 (36.7%) | $90,086 |
| Average | 2,481 (100.0%) | $139,729 |
Occupancy by Householder Income Bracket in Saranap
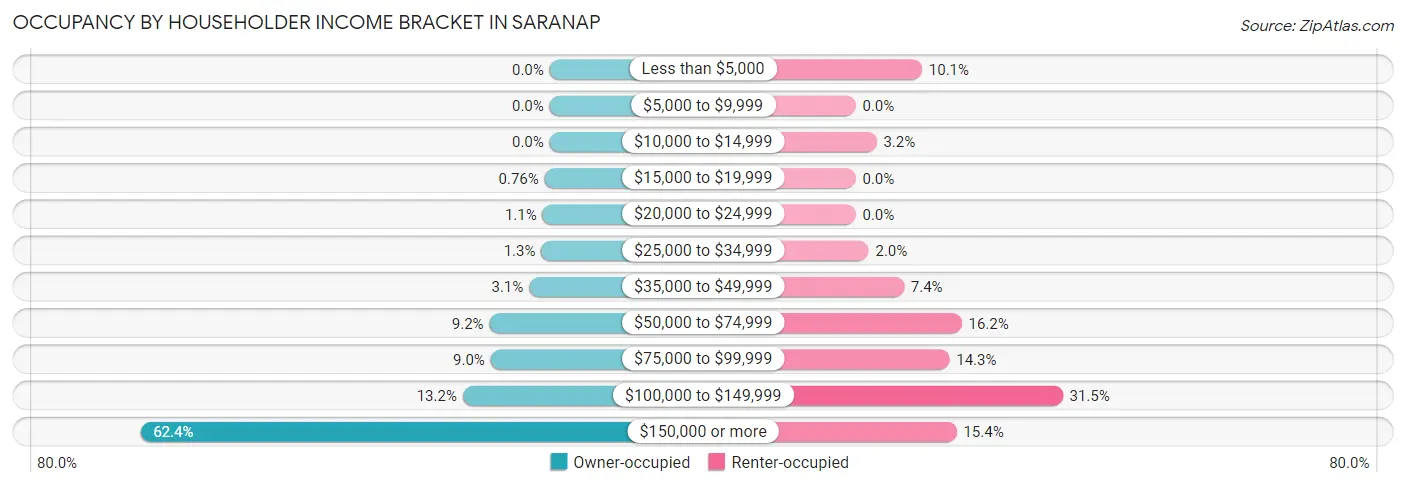
| Income Bracket | Owner-occupied | Renter-occupied |
| Less than $5,000 | 0 (0.0%) | 92 (10.1%) |
| $5,000 to $9,999 | 0 (0.0%) | 0 (0.0%) |
| $10,000 to $14,999 | 0 (0.0%) | 29 (3.2%) |
| $15,000 to $19,999 | 12 (0.8%) | 0 (0.0%) |
| $20,000 to $24,999 | 17 (1.1%) | 0 (0.0%) |
| $25,000 to $34,999 | 20 (1.3%) | 18 (2.0%) |
| $35,000 to $49,999 | 49 (3.1%) | 67 (7.4%) |
| $50,000 to $74,999 | 144 (9.2%) | 147 (16.2%) |
| $75,000 to $99,999 | 141 (9.0%) | 130 (14.3%) |
| $100,000 to $149,999 | 208 (13.2%) | 287 (31.5%) |
| $150,000 or more | 980 (62.4%) | 140 (15.4%) |
| Total | 1,571 (100.0%) | 910 (100.0%) |
Monthly Housing Cost Tiers in Saranap
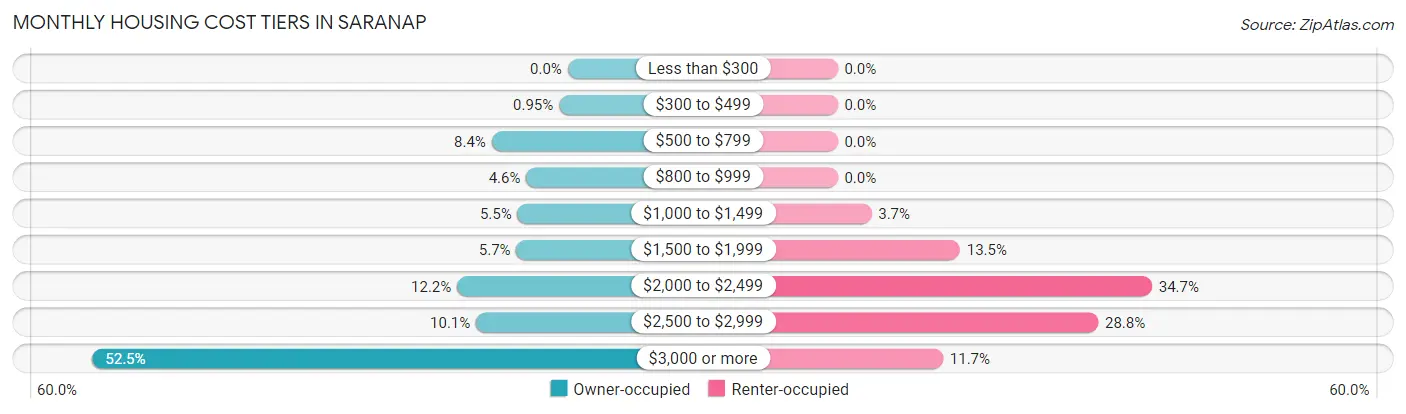
| Monthly Cost | Owner-occupied | Renter-occupied |
| Less than $300 | 0 (0.0%) | 0 (0.0%) |
| $300 to $499 | 15 (0.9%) | 0 (0.0%) |
| $500 to $799 | 132 (8.4%) | 0 (0.0%) |
| $800 to $999 | 72 (4.6%) | 0 (0.0%) |
| $1,000 to $1,499 | 87 (5.5%) | 34 (3.7%) |
| $1,500 to $1,999 | 89 (5.7%) | 123 (13.5%) |
| $2,000 to $2,499 | 192 (12.2%) | 316 (34.7%) |
| $2,500 to $2,999 | 159 (10.1%) | 262 (28.8%) |
| $3,000 or more | 825 (52.5%) | 106 (11.7%) |
| Total | 1,571 (100.0%) | 910 (100.0%) |
Physical Housing Characteristics in Saranap
Housing Structures in Saranap
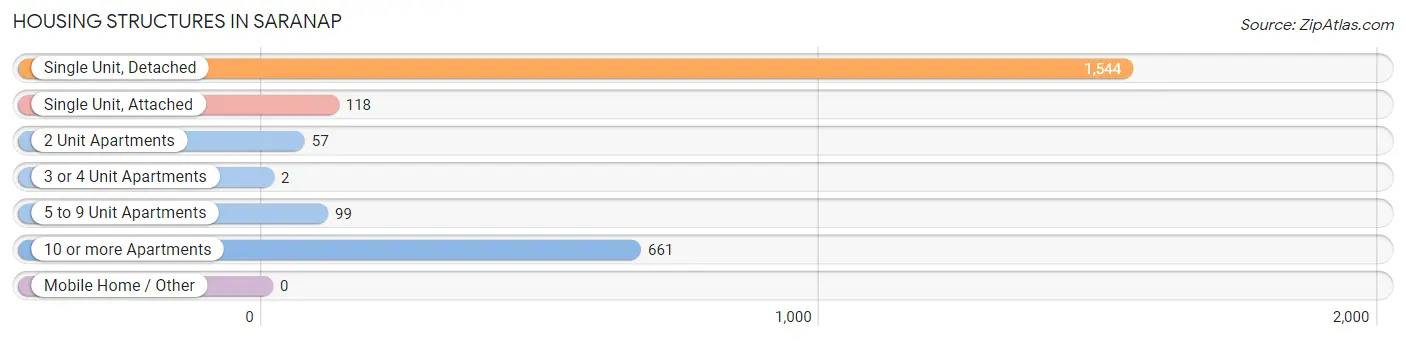
| Structure Type | # Housing Units | % Housing Units |
| Single Unit, Detached | 1,544 | 62.2% |
| Single Unit, Attached | 118 | 4.8% |
| 2 Unit Apartments | 57 | 2.3% |
| 3 or 4 Unit Apartments | 2 | 0.1% |
| 5 to 9 Unit Apartments | 99 | 4.0% |
| 10 or more Apartments | 661 | 26.6% |
| Mobile Home / Other | 0 | 0.0% |
| Total | 2,481 | 100.0% |
Housing Structures by Occupancy in Saranap
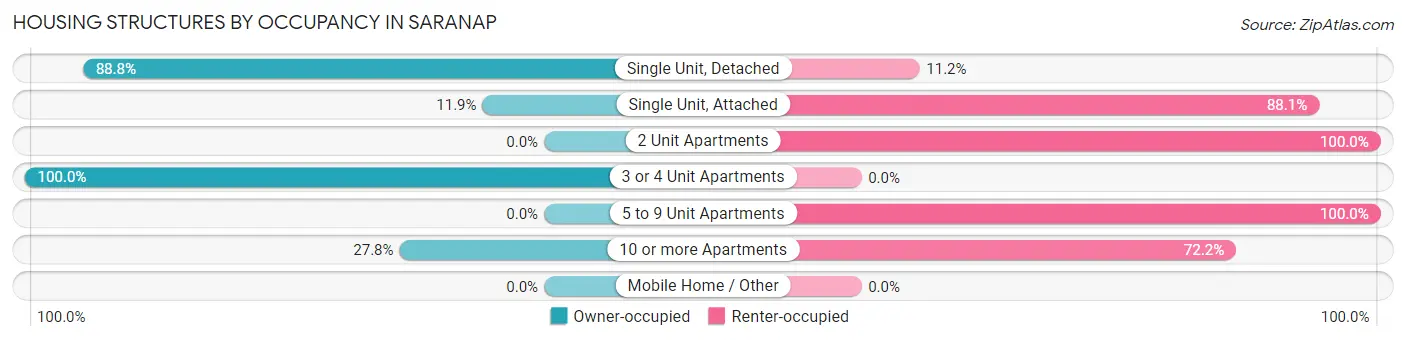
| Structure Type | Owner-occupied | Renter-occupied |
| Single Unit, Detached | 1,371 (88.8%) | 173 (11.2%) |
| Single Unit, Attached | 14 (11.9%) | 104 (88.1%) |
| 2 Unit Apartments | 0 (0.0%) | 57 (100.0%) |
| 3 or 4 Unit Apartments | 2 (100.0%) | 0 (0.0%) |
| 5 to 9 Unit Apartments | 0 (0.0%) | 99 (100.0%) |
| 10 or more Apartments | 184 (27.8%) | 477 (72.2%) |
| Mobile Home / Other | 0 (0.0%) | 0 (0.0%) |
| Total | 1,571 (63.3%) | 910 (36.7%) |
Housing Structures by Number of Rooms in Saranap
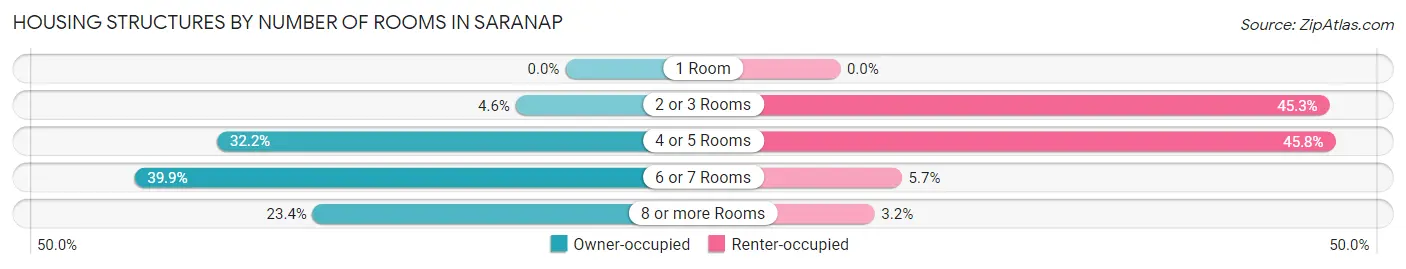
| Number of Rooms | Owner-occupied | Renter-occupied |
| 1 Room | 0 (0.0%) | 0 (0.0%) |
| 2 or 3 Rooms | 72 (4.6%) | 412 (45.3%) |
| 4 or 5 Rooms | 506 (32.2%) | 417 (45.8%) |
| 6 or 7 Rooms | 626 (39.9%) | 52 (5.7%) |
| 8 or more Rooms | 367 (23.4%) | 29 (3.2%) |
| Total | 1,571 (100.0%) | 910 (100.0%) |
Housing Structure by Heating Type in Saranap
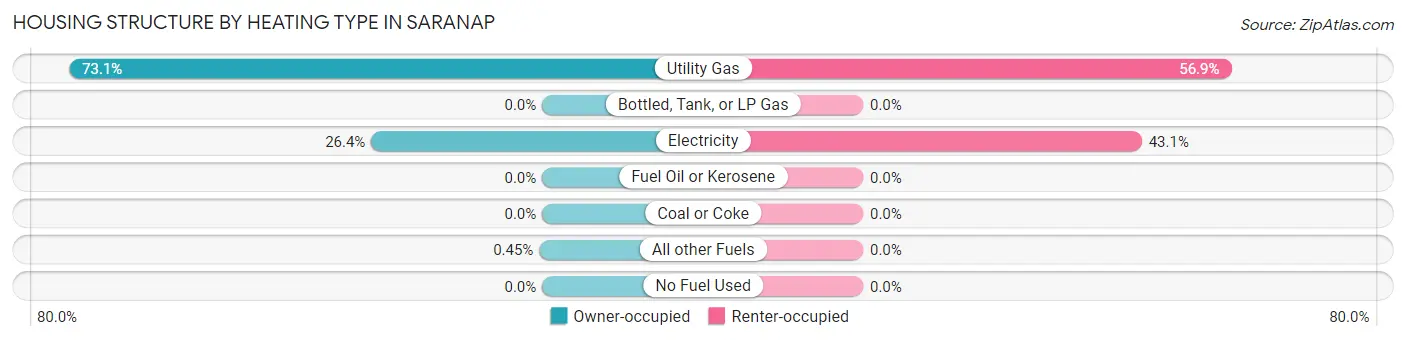
| Heating Type | Owner-occupied | Renter-occupied |
| Utility Gas | 1,149 (73.1%) | 518 (56.9%) |
| Bottled, Tank, or LP Gas | 0 (0.0%) | 0 (0.0%) |
| Electricity | 415 (26.4%) | 392 (43.1%) |
| Fuel Oil or Kerosene | 0 (0.0%) | 0 (0.0%) |
| Coal or Coke | 0 (0.0%) | 0 (0.0%) |
| All other Fuels | 7 (0.4%) | 0 (0.0%) |
| No Fuel Used | 0 (0.0%) | 0 (0.0%) |
| Total | 1,571 (100.0%) | 910 (100.0%) |
Household Vehicle Usage in Saranap
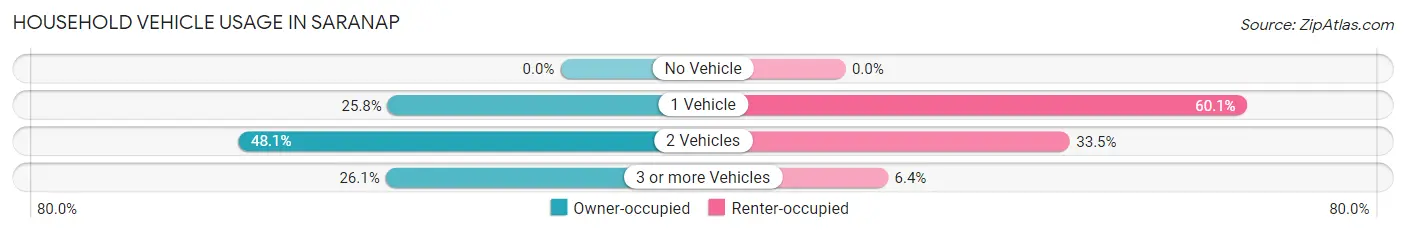
| Vehicles per Household | Owner-occupied | Renter-occupied |
| No Vehicle | 0 (0.0%) | 0 (0.0%) |
| 1 Vehicle | 405 (25.8%) | 547 (60.1%) |
| 2 Vehicles | 756 (48.1%) | 305 (33.5%) |
| 3 or more Vehicles | 410 (26.1%) | 58 (6.4%) |
| Total | 1,571 (100.0%) | 910 (100.0%) |
Real Estate & Mortgages in Saranap
Real Estate and Mortgage Overview in Saranap
| Characteristic | Without Mortgage | With Mortgage |
| Housing Units | 298 | 1,273 |
| Median Property Value | $1,264,300 | $1,338,100 |
| Median Household Income | $128,942 | $842 |
| Monthly Housing Costs | $806 | $825 |
| Real Estate Taxes | $4,492 | $0 |
Property Value by Mortgage Status in Saranap
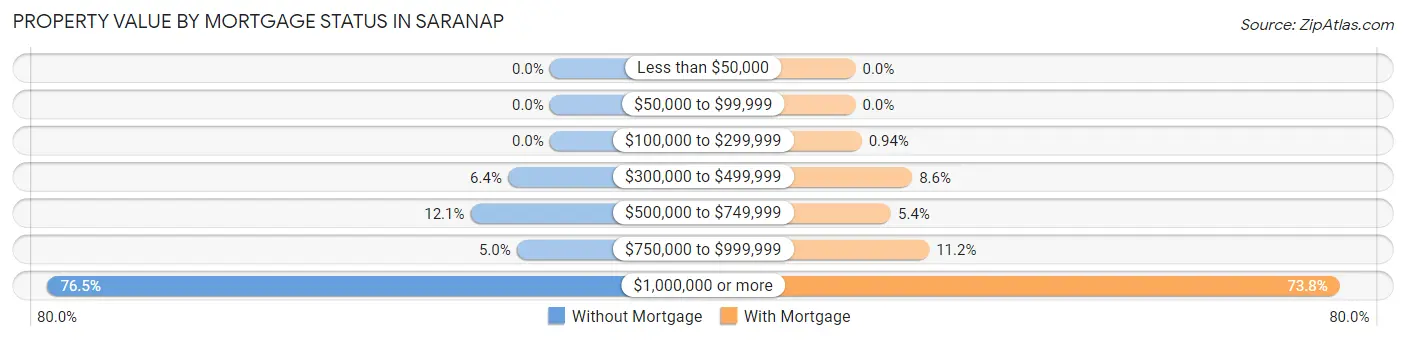
| Property Value | Without Mortgage | With Mortgage |
| Less than $50,000 | 0 (0.0%) | 0 (0.0%) |
| $50,000 to $99,999 | 0 (0.0%) | 0 (0.0%) |
| $100,000 to $299,999 | 0 (0.0%) | 12 (0.9%) |
| $300,000 to $499,999 | 19 (6.4%) | 110 (8.6%) |
| $500,000 to $749,999 | 36 (12.1%) | 69 (5.4%) |
| $750,000 to $999,999 | 15 (5.0%) | 143 (11.2%) |
| $1,000,000 or more | 228 (76.5%) | 939 (73.8%) |
| Total | 298 (100.0%) | 1,273 (100.0%) |
Household Income by Mortgage Status in Saranap
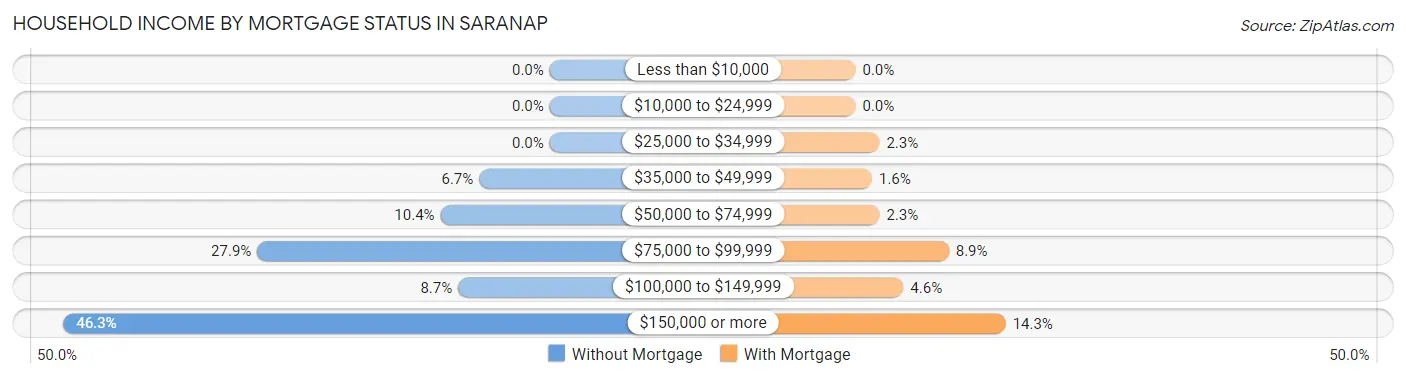
| Household Income | Without Mortgage | With Mortgage |
| Less than $10,000 | 0 (0.0%) | 0 (0.0%) |
| $10,000 to $24,999 | 0 (0.0%) | 0 (0.0%) |
| $25,000 to $34,999 | 0 (0.0%) | 29 (2.3%) |
| $35,000 to $49,999 | 20 (6.7%) | 20 (1.6%) |
| $50,000 to $74,999 | 31 (10.4%) | 29 (2.3%) |
| $75,000 to $99,999 | 83 (27.9%) | 113 (8.9%) |
| $100,000 to $149,999 | 26 (8.7%) | 58 (4.6%) |
| $150,000 or more | 138 (46.3%) | 182 (14.3%) |
| Total | 298 (100.0%) | 1,273 (100.0%) |
Property Value to Household Income Ratio in Saranap
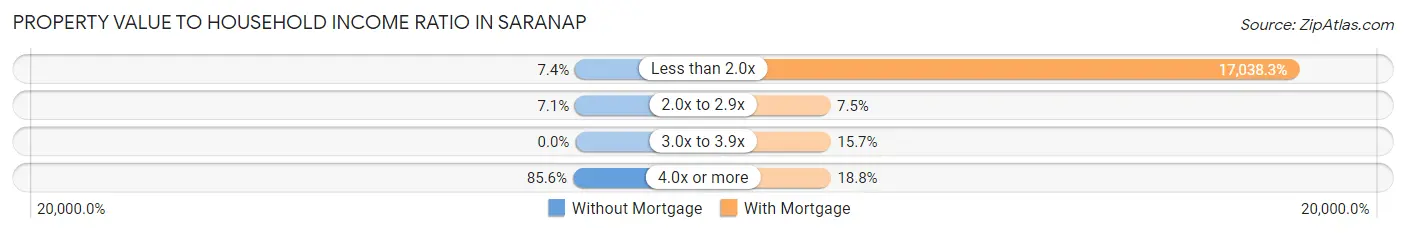
| Value-to-Income Ratio | Without Mortgage | With Mortgage |
| Less than 2.0x | 22 (7.4%) | 216,898 (17,038.3%) |
| 2.0x to 2.9x | 21 (7.0%) | 95 (7.5%) |
| 3.0x to 3.9x | 0 (0.0%) | 200 (15.7%) |
| 4.0x or more | 255 (85.6%) | 239 (18.8%) |
| Total | 298 (100.0%) | 1,273 (100.0%) |
Real Estate Taxes by Mortgage Status in Saranap
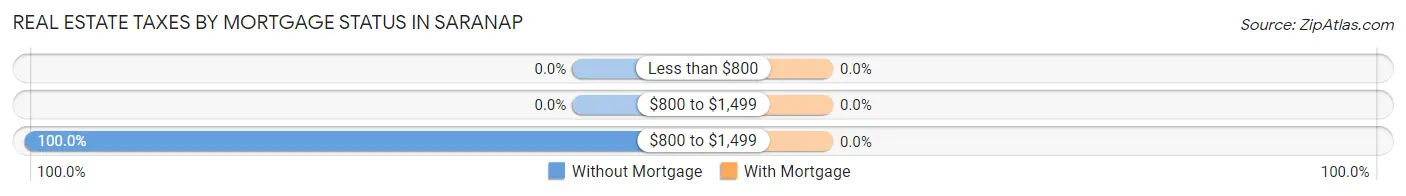
| Property Taxes | Without Mortgage | With Mortgage |
| Less than $800 | 0 (0.0%) | 0 (0.0%) |
| $800 to $1,499 | 0 (0.0%) | 0 (0.0%) |
| $800 to $1,499 | 298 (100.0%) | 0 (0.0%) |
| Total | 298 (100.0%) | 1,273 (100.0%) |
Health & Disability in Saranap
Health Insurance Coverage by Age in Saranap
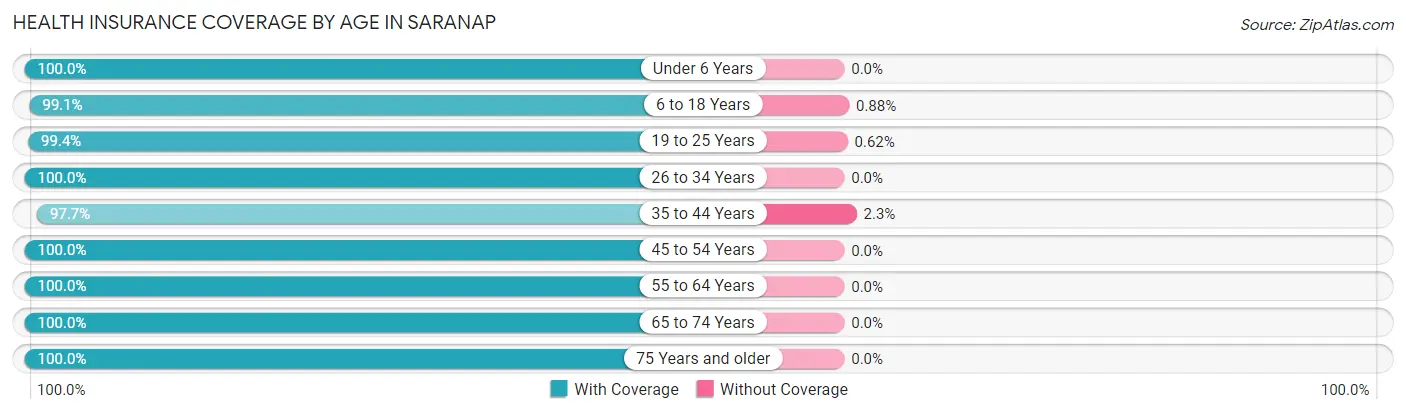
| Age Bracket | With Coverage | Without Coverage |
| Under 6 Years | 554 (100.0%) | 0 (0.0%) |
| 6 to 18 Years | 899 (99.1%) | 8 (0.9%) |
| 19 to 25 Years | 483 (99.4%) | 3 (0.6%) |
| 26 to 34 Years | 479 (100.0%) | 0 (0.0%) |
| 35 to 44 Years | 809 (97.7%) | 19 (2.3%) |
| 45 to 54 Years | 1,327 (100.0%) | 0 (0.0%) |
| 55 to 64 Years | 534 (100.0%) | 0 (0.0%) |
| 65 to 74 Years | 585 (100.0%) | 0 (0.0%) |
| 75 Years and older | 416 (100.0%) | 0 (0.0%) |
| Total | 6,086 (99.5%) | 30 (0.5%) |
Health Insurance Coverage by Citizenship Status in Saranap
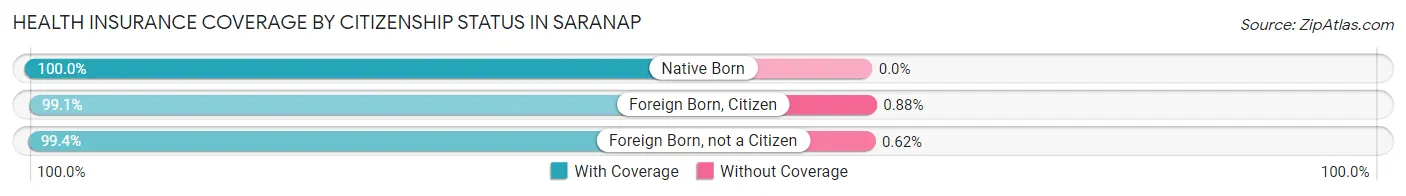
| Citizenship Status | With Coverage | Without Coverage |
| Native Born | 554 (100.0%) | 0 (0.0%) |
| Foreign Born, Citizen | 899 (99.1%) | 8 (0.9%) |
| Foreign Born, not a Citizen | 483 (99.4%) | 3 (0.6%) |
Health Insurance Coverage by Household Income in Saranap
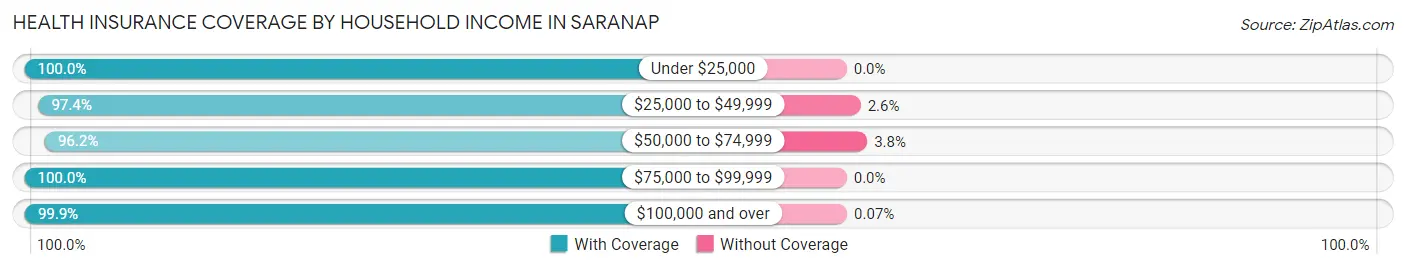
| Household Income | With Coverage | Without Coverage |
| Under $25,000 | 192 (100.0%) | 0 (0.0%) |
| $25,000 to $49,999 | 299 (97.4%) | 8 (2.6%) |
| $50,000 to $74,999 | 477 (96.2%) | 19 (3.8%) |
| $75,000 to $99,999 | 448 (100.0%) | 0 (0.0%) |
| $100,000 and over | 4,606 (99.9%) | 3 (0.1%) |
Public vs Private Health Insurance Coverage by Age in Saranap
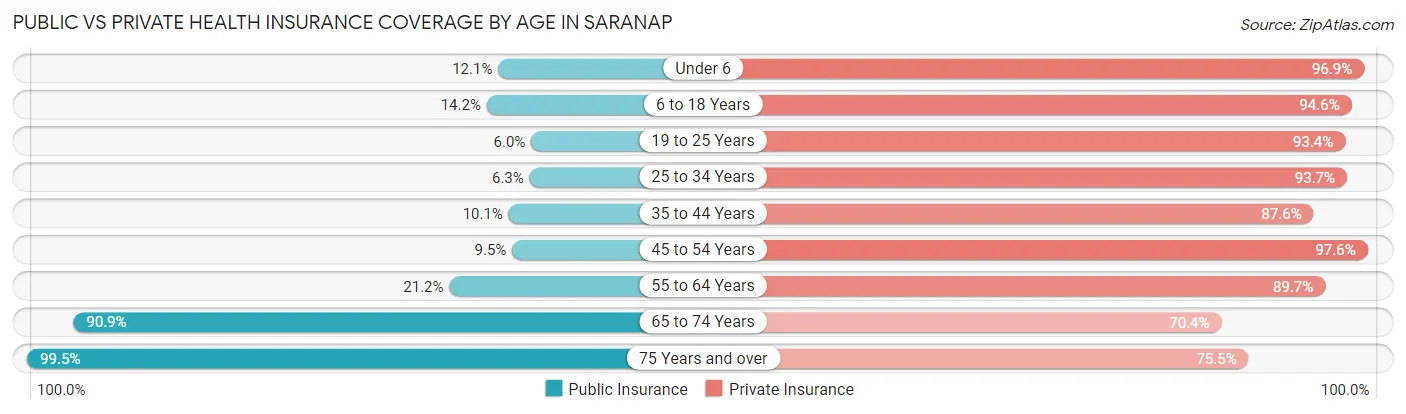
| Age Bracket | Public Insurance | Private Insurance |
| Under 6 | 67 (12.1%) | 537 (96.9%) |
| 6 to 18 Years | 129 (14.2%) | 858 (94.6%) |
| 19 to 25 Years | 29 (6.0%) | 454 (93.4%) |
| 25 to 34 Years | 30 (6.3%) | 449 (93.7%) |
| 35 to 44 Years | 84 (10.1%) | 725 (87.6%) |
| 45 to 54 Years | 126 (9.5%) | 1,295 (97.6%) |
| 55 to 64 Years | 113 (21.2%) | 479 (89.7%) |
| 65 to 74 Years | 532 (90.9%) | 412 (70.4%) |
| 75 Years and over | 414 (99.5%) | 314 (75.5%) |
| Total | 1,524 (24.9%) | 5,523 (90.3%) |
Disability Status by Sex by Age in Saranap
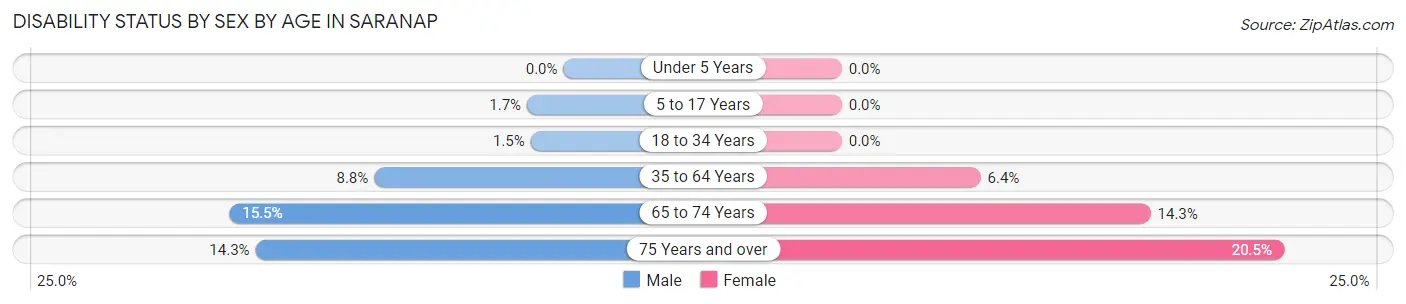
| Age Bracket | Male | Female |
| Under 5 Years | 0 (0.0%) | 0 (0.0%) |
| 5 to 17 Years | 7 (1.7%) | 0 (0.0%) |
| 18 to 34 Years | 10 (1.5%) | 0 (0.0%) |
| 35 to 64 Years | 112 (8.8%) | 91 (6.4%) |
| 65 to 74 Years | 42 (15.5%) | 45 (14.3%) |
| 75 Years and over | 26 (14.3%) | 48 (20.5%) |
Disability Class by Sex by Age in Saranap
Disability Class: Hearing Difficulty
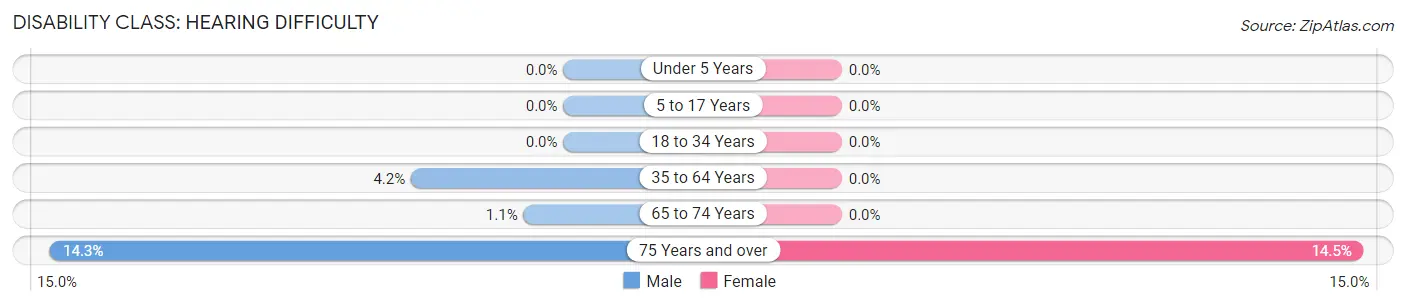
| Age Bracket | Male | Female |
| Under 5 Years | 0 (0.0%) | 0 (0.0%) |
| 5 to 17 Years | 0 (0.0%) | 0 (0.0%) |
| 18 to 34 Years | 0 (0.0%) | 0 (0.0%) |
| 35 to 64 Years | 54 (4.2%) | 0 (0.0%) |
| 65 to 74 Years | 3 (1.1%) | 0 (0.0%) |
| 75 Years and over | 26 (14.3%) | 34 (14.5%) |
Disability Class: Vision Difficulty
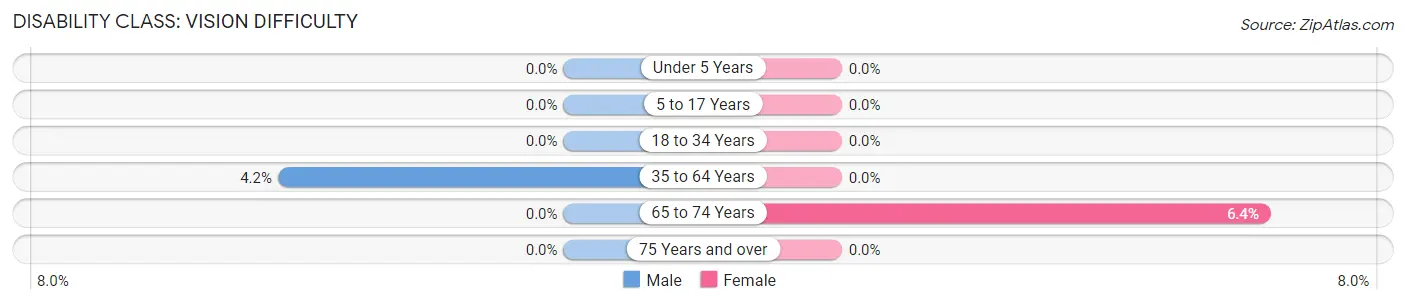
| Age Bracket | Male | Female |
| Under 5 Years | 0 (0.0%) | 0 (0.0%) |
| 5 to 17 Years | 0 (0.0%) | 0 (0.0%) |
| 18 to 34 Years | 0 (0.0%) | 0 (0.0%) |
| 35 to 64 Years | 54 (4.2%) | 0 (0.0%) |
| 65 to 74 Years | 0 (0.0%) | 20 (6.4%) |
| 75 Years and over | 0 (0.0%) | 0 (0.0%) |
Disability Class: Cognitive Difficulty
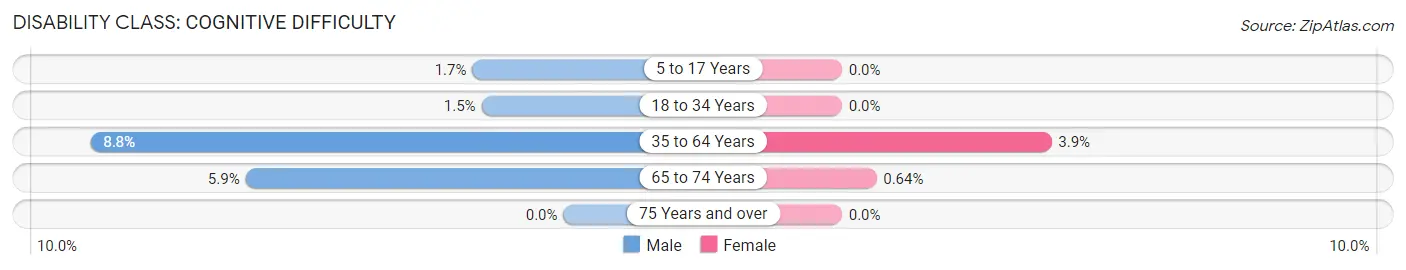
| Age Bracket | Male | Female |
| 5 to 17 Years | 7 (1.7%) | 0 (0.0%) |
| 18 to 34 Years | 10 (1.5%) | 0 (0.0%) |
| 35 to 64 Years | 112 (8.8%) | 55 (3.9%) |
| 65 to 74 Years | 16 (5.9%) | 2 (0.6%) |
| 75 Years and over | 0 (0.0%) | 0 (0.0%) |
Disability Class: Ambulatory Difficulty
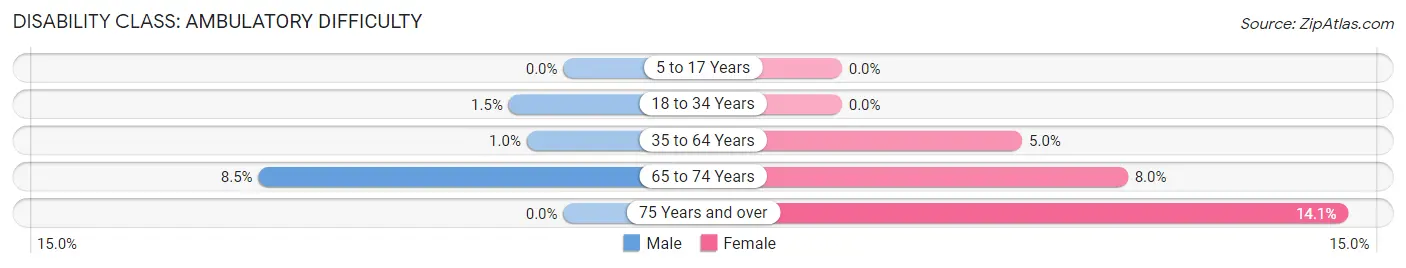
| Age Bracket | Male | Female |
| 5 to 17 Years | 0 (0.0%) | 0 (0.0%) |
| 18 to 34 Years | 10 (1.5%) | 0 (0.0%) |
| 35 to 64 Years | 13 (1.0%) | 71 (5.0%) |
| 65 to 74 Years | 23 (8.5%) | 25 (8.0%) |
| 75 Years and over | 0 (0.0%) | 33 (14.1%) |
Disability Class: Self-Care Difficulty
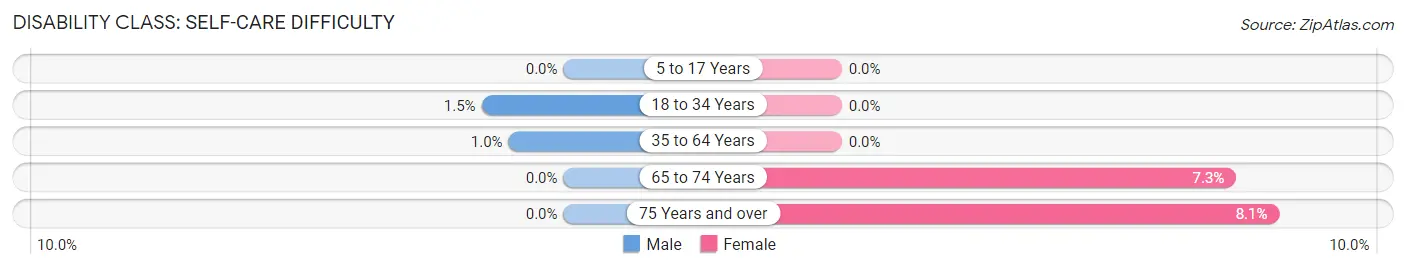
| Age Bracket | Male | Female |
| 5 to 17 Years | 0 (0.0%) | 0 (0.0%) |
| 18 to 34 Years | 10 (1.5%) | 0 (0.0%) |
| 35 to 64 Years | 13 (1.0%) | 0 (0.0%) |
| 65 to 74 Years | 0 (0.0%) | 23 (7.3%) |
| 75 Years and over | 0 (0.0%) | 19 (8.1%) |
Technology Access in Saranap
Computing Device Access in Saranap
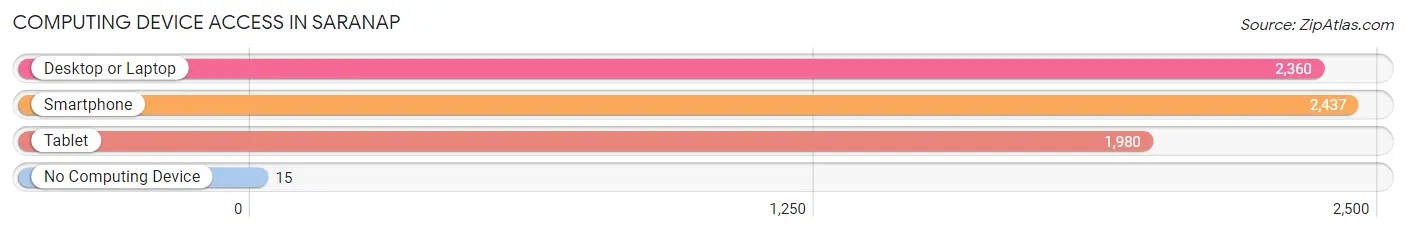
| Device Type | # Households | % Households |
| Desktop or Laptop | 2,360 | 95.1% |
| Smartphone | 2,437 | 98.2% |
| Tablet | 1,980 | 79.8% |
| No Computing Device | 15 | 0.6% |
| Total | 2,481 | 100.0% |
Internet Access in Saranap
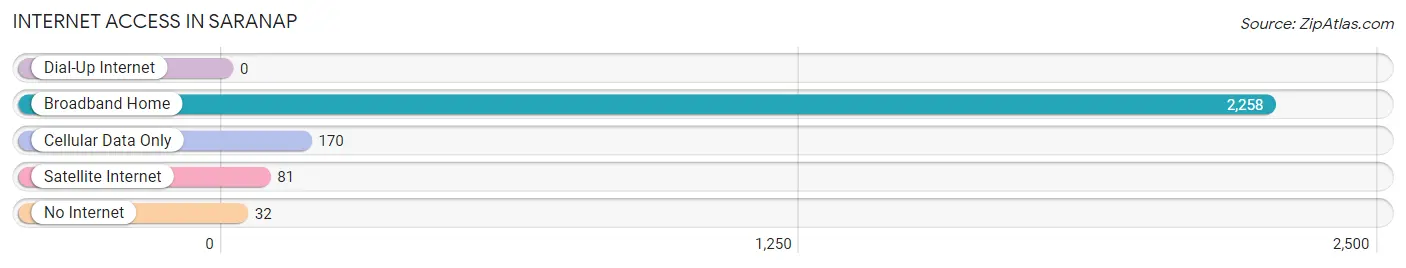
| Internet Type | # Households | % Households |
| Dial-Up Internet | 0 | 0.0% |
| Broadband Home | 2,258 | 91.0% |
| Cellular Data Only | 170 | 6.9% |
| Satellite Internet | 81 | 3.3% |
| No Internet | 32 | 1.3% |
| Total | 2,481 | 100.0% |
Saranap Summary
Saranap is a small unincorporated community located in Contra Costa County, California. It is situated in the San Ramon Valley, approximately 25 miles east of San Francisco. Saranap is bordered by the cities of Walnut Creek, Danville, and San Ramon. The population of Saranap was estimated to be 1,845 in 2019.
History
Saranap was originally inhabited by the Ohlone people, who lived in the area for thousands of years before the arrival of Europeans. The first Europeans to settle in the area were Spanish missionaries, who established the Mission San Jose in 1797. The mission was later secularized in 1834, and the land was divided into large ranchos. Saranap was part of the Rancho San Ramon, which was granted to Jose Maria Amador in 1834.
In the late 19th century, the area was settled by farmers and ranchers. The first post office was established in 1891, and the community was named after the Saranap Creek, which runs through the area. The creek was named after the Ohlone word for “place of the willows.”
Geography
Saranap is located in the San Ramon Valley, approximately 25 miles east of San Francisco. The community is bordered by the cities of Walnut Creek, Danville, and San Ramon. The area is characterized by rolling hills and valleys, with elevations ranging from 200 to 1,000 feet. The climate is mild, with temperatures ranging from the mid-50s to the mid-80s in the summer.
Economy
Saranap is primarily a residential community, with most of its residents commuting to nearby cities for work. The area is home to several small businesses, including a grocery store, a gas station, and a few restaurants. The community is also home to a number of technology companies, including Oracle, Chevron, and Symantec.
Demographics
As of 2019, the population of Saranap was estimated to be 1,845. The racial makeup of the community was 73.3% White, 11.2% Asian, 8.2% Hispanic or Latino, and 5.3% African American. The median household income was $133,945, and the median home value was $1,072,000. The median age was 44.7 years.
Saranap is a small, unincorporated community located in Contra Costa County, California. It is situated in the San Ramon Valley, approximately 25 miles east of San Francisco. The area was originally inhabited by the Ohlone people, and was later settled by Spanish missionaries and ranchers. The population of Saranap was estimated to be 1,845 in 2019. The economy of the community is primarily residential, with most of its residents commuting to nearby cities for work. The racial makeup of the community was 73.3% White, 11.2% Asian, 8.2% Hispanic or Latino, and 5.3% African American. The median household income was $133,945, and the median home value was $1,072,000. Saranap is a small, diverse community with a rich history and a bright future.
Common Questions
What is Per Capita Income in Saranap?
Per Capita income in Saranap is $92,395.
What is the Median Family Income in Saranap?
Median Family Income in Saranap is $200,455.
What is the Median Household income in Saranap?
Median Household Income in Saranap is $139,729.
What is Income or Wage Gap in Saranap?
Income or Wage Gap in Saranap is 3.1%.
Women in Saranap earn 96.9 cents for every dollar earned by a man.
What is Inequality or Gini Index in Saranap?
Inequality or Gini Index in Saranap is 0.50.
What is the Total Population of Saranap?
Total Population of Saranap is 6,136.
What is the Total Male Population of Saranap?
Total Male Population of Saranap is 3,019.
What is the Total Female Population of Saranap?
Total Female Population of Saranap is 3,117.
What is the Ratio of Males per 100 Females in Saranap?
There are 96.86 Males per 100 Females in Saranap.
What is the Ratio of Females per 100 Males in Saranap?
There are 103.25 Females per 100 Males in Saranap.
What is the Median Population Age in Saranap?
Median Population Age in Saranap is 41.8 Years.
What is the Average Family Size in Saranap
Average Family Size in Saranap is 3.1 People.
What is the Average Household Size in Saranap
Average Household Size in Saranap is 2.4 People.
How Large is the Labor Force in Saranap?
There are 3,440 People in the Labor Forcein in Saranap.
What is the Percentage of People in the Labor Force in Saranap?
70.0% of People are in the Labor Force in Saranap.
What is the Unemployment Rate in Saranap?
Unemployment Rate in Saranap is 3.5%.