Cities with the Highest Percentage of Eastern European Population in Massachusetts
RELATED REPORTS & OPTIONS
Eastern European
Massachusetts
Compare Cities
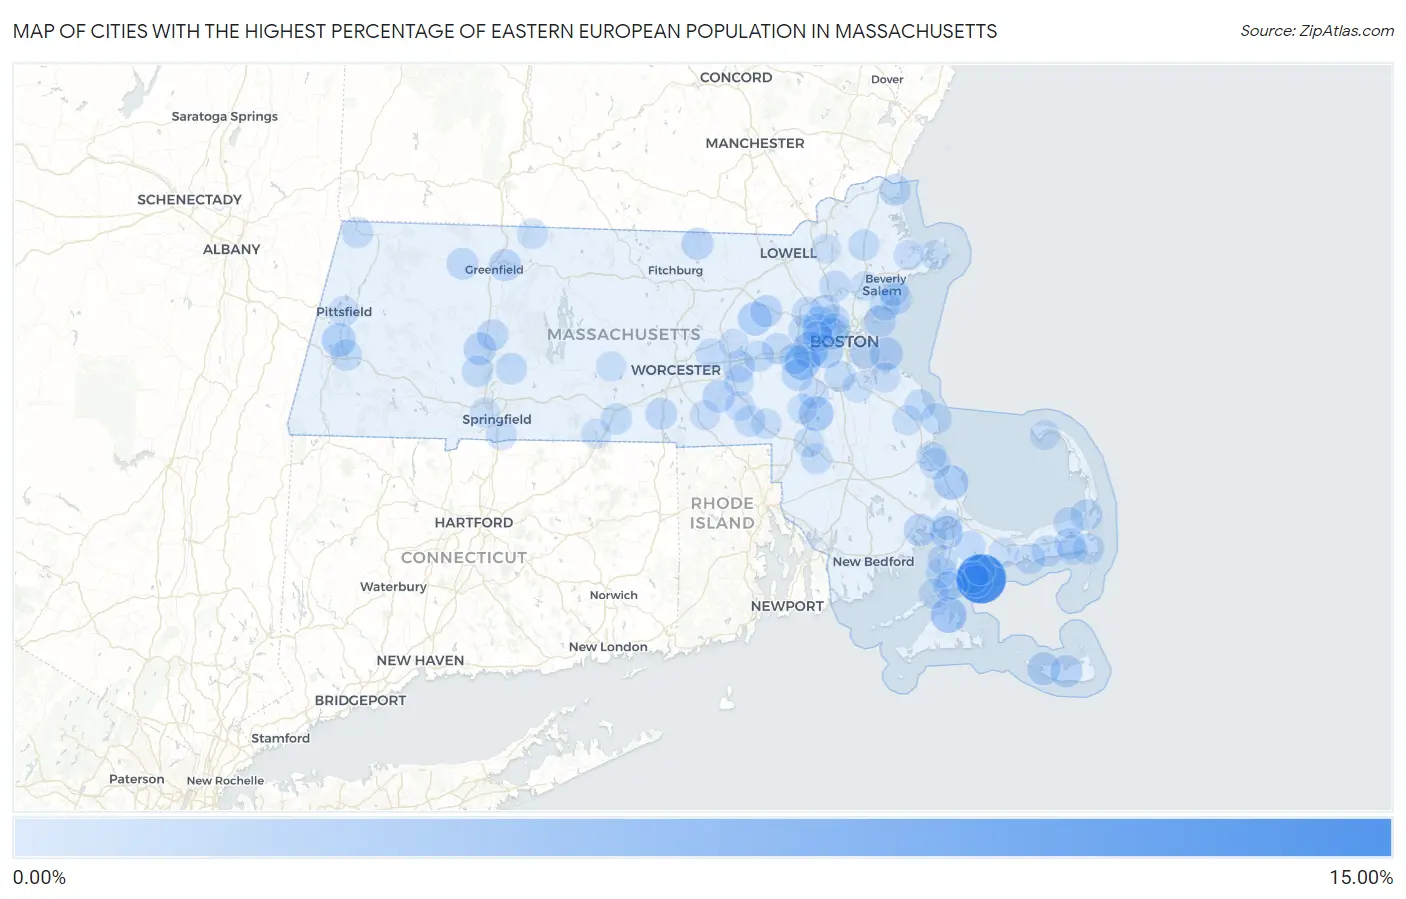
Map of Cities with the Highest Percentage of Eastern European Population in Massachusetts
0.00%
15.00%
Cities with the Highest Percentage of Eastern European Population in Massachusetts
| City | Eastern European | vs State | vs National | |
| 1. | Popponesset | 13.66% | 0.57%(+13.1)#1 | 0.30%(+13.4)#36 |
| 2. | Newton | 4.25% | 0.57%(+3.68)#2 | 0.30%(+3.94)#218 |
| 3. | Vineyard Haven | 3.97% | 0.57%(+3.40)#3 | 0.30%(+3.67)#243 |
| 4. | Needham | 3.88% | 0.57%(+3.31)#4 | 0.30%(+3.58)#252 |
| 5. | Sharon | 3.36% | 0.57%(+2.79)#5 | 0.30%(+3.06)#320 |
| 6. | The Pinehills | 3.32% | 0.57%(+2.74)#6 | 0.30%(+3.01)#326 |
| 7. | Lenox | 2.85% | 0.57%(+2.28)#7 | 0.30%(+2.55)#405 |
| 8. | Brookline | 2.77% | 0.57%(+2.20)#8 | 0.30%(+2.47)#417 |
| 9. | Maynard | 2.76% | 0.57%(+2.18)#9 | 0.30%(+2.45)#421 |
| 10. | Hull | 2.45% | 0.57%(+1.88)#10 | 0.30%(+2.15)#503 |
| 11. | Madaket | 2.20% | 0.57%(+1.63)#11 | 0.30%(+1.90)#610 |
| 12. | Bourne | 2.08% | 0.57%(+1.50)#12 | 0.30%(+1.77)#664 |
| 13. | Northampton | 2.03% | 0.57%(+1.46)#13 | 0.30%(+1.73)#685 |
| 14. | Weweantic | 2.01% | 0.57%(+1.44)#14 | 0.30%(+1.71)#697 |
| 15. | Upton | 1.96% | 0.57%(+1.39)#15 | 0.30%(+1.66)#717 |
| 16. | Nantucket | 1.96% | 0.57%(+1.38)#16 | 0.30%(+1.65)#725 |
| 17. | New Seabury | 1.90% | 0.57%(+1.33)#17 | 0.30%(+1.59)#757 |
| 18. | Arlington | 1.81% | 0.57%(+1.24)#18 | 0.30%(+1.51)#807 |
| 19. | Cordaville | 1.77% | 0.57%(+1.20)#19 | 0.30%(+1.46)#832 |
| 20. | West Concord | 1.77% | 0.57%(+1.20)#20 | 0.30%(+1.46)#833 |
| 21. | Turners Falls | 1.75% | 0.57%(+1.17)#21 | 0.30%(+1.44)#841 |
| 22. | Seabrook | 1.68% | 0.57%(+1.11)#22 | 0.30%(+1.38)#875 |
| 23. | Townsend | 1.68% | 0.57%(+1.11)#23 | 0.30%(+1.38)#876 |
| 24. | Cambridge | 1.55% | 0.57%(+0.980)#24 | 0.30%(+1.25)#965 |
| 25. | Oxford | 1.53% | 0.57%(+0.962)#25 | 0.30%(+1.23)#992 |
| 26. | Marblehead | 1.52% | 0.57%(+0.951)#26 | 0.30%(+1.22)#1,001 |
| 27. | Nahant | 1.47% | 0.57%(+0.897)#27 | 0.30%(+1.17)#1,047 |
| 28. | Dover | 1.43% | 0.57%(+0.861)#28 | 0.30%(+1.13)#1,074 |
| 29. | Shelburne Falls | 1.41% | 0.57%(+0.841)#29 | 0.30%(+1.11)#1,085 |
| 30. | Orleans | 1.38% | 0.57%(+0.810)#30 | 0.30%(+1.08)#1,126 |
| 31. | Salisbury | 1.37% | 0.57%(+0.795)#31 | 0.30%(+1.06)#1,142 |
| 32. | Hatfield | 1.35% | 0.57%(+0.781)#32 | 0.30%(+1.05)#1,164 |
| 33. | West Dennis | 1.32% | 0.57%(+0.746)#33 | 0.30%(+1.01)#1,200 |
| 34. | Reading | 1.30% | 0.57%(+0.727)#34 | 0.30%(+0.995)#1,222 |
| 35. | Lexington | 1.28% | 0.57%(+0.711)#35 | 0.30%(+0.979)#1,242 |
| 36. | Granby | 1.28% | 0.57%(+0.704)#36 | 0.30%(+0.972)#1,249 |
| 37. | Lee | 1.26% | 0.57%(+0.689)#37 | 0.30%(+0.957)#1,265 |
| 38. | Sturbridge | 1.26% | 0.57%(+0.688)#38 | 0.30%(+0.956)#1,266 |
| 39. | Wellesley | 1.24% | 0.57%(+0.664)#39 | 0.30%(+0.932)#1,306 |
| 40. | Easthampton Town | 1.23% | 0.57%(+0.655)#40 | 0.30%(+0.923)#1,319 |
| 41. | West Chatham | 1.22% | 0.57%(+0.653)#41 | 0.30%(+0.921)#1,320 |
| 42. | Teaticket | 1.22% | 0.57%(+0.645)#42 | 0.30%(+0.913)#1,333 |
| 43. | Harwich Center | 1.20% | 0.57%(+0.626)#43 | 0.30%(+0.894)#1,364 |
| 44. | Forestdale | 1.12% | 0.57%(+0.553)#44 | 0.30%(+0.821)#1,460 |
| 45. | Cochituate | 1.12% | 0.57%(+0.553)#45 | 0.30%(+0.821)#1,461 |
| 46. | Williamstown | 1.11% | 0.57%(+0.540)#46 | 0.30%(+0.808)#1,485 |
| 47. | Boxford | 1.11% | 0.57%(+0.534)#47 | 0.30%(+0.802)#1,497 |
| 48. | Medford | 1.10% | 0.57%(+0.528)#48 | 0.30%(+0.796)#1,505 |
| 49. | Marshfield Hills | 1.10% | 0.57%(+0.527)#49 | 0.30%(+0.795)#1,510 |
| 50. | Swampscott | 1.08% | 0.57%(+0.512)#50 | 0.30%(+0.781)#1,535 |
| 51. | Bellingham | 1.08% | 0.57%(+0.507)#51 | 0.30%(+0.775)#1,544 |
| 52. | Milton | 1.06% | 0.57%(+0.490)#52 | 0.30%(+0.758)#1,575 |
| 53. | Belmont | 1.04% | 0.57%(+0.465)#53 | 0.30%(+0.733)#1,608 |
| 54. | Ocean Bluff Brant Rock | 1.04% | 0.57%(+0.463)#54 | 0.30%(+0.731)#1,613 |
| 55. | Brewster | 1.04% | 0.57%(+0.463)#55 | 0.30%(+0.731)#1,614 |
| 56. | West Yarmouth | 1.03% | 0.57%(+0.461)#56 | 0.30%(+0.729)#1,620 |
| 57. | Plymouth | 0.98% | 0.57%(+0.409)#57 | 0.30%(+0.677)#1,722 |
| 58. | Amherst | 0.98% | 0.57%(+0.408)#58 | 0.30%(+0.676)#1,728 |
| 59. | Framingham | 0.97% | 0.57%(+0.400)#59 | 0.30%(+0.668)#1,744 |
| 60. | West Falmouth | 0.95% | 0.57%(+0.376)#60 | 0.30%(+0.644)#1,798 |
| 61. | Northborough | 0.94% | 0.57%(+0.372)#61 | 0.30%(+0.640)#1,810 |
| 62. | Norton Center | 0.93% | 0.57%(+0.358)#62 | 0.30%(+0.626)#1,838 |
| 63. | Somerville | 0.91% | 0.57%(+0.343)#63 | 0.30%(+0.611)#1,867 |
| 64. | Longmeadow | 0.87% | 0.57%(+0.302)#64 | 0.30%(+0.570)#1,958 |
| 65. | Winchester | 0.82% | 0.57%(+0.252)#65 | 0.30%(+0.521)#2,108 |
| 66. | Northfield | 0.77% | 0.57%(+0.199)#66 | 0.30%(+0.467)#2,265 |
| 67. | Waltham | 0.77% | 0.57%(+0.196)#67 | 0.30%(+0.464)#2,274 |
| 68. | Mansfield Center | 0.75% | 0.57%(+0.182)#68 | 0.30%(+0.450)#2,319 |
| 69. | Hingham | 0.75% | 0.57%(+0.177)#69 | 0.30%(+0.445)#2,336 |
| 70. | Franklin Town | 0.70% | 0.57%(+0.124)#70 | 0.30%(+0.392)#2,508 |
| 71. | North Falmouth | 0.69% | 0.57%(+0.118)#71 | 0.30%(+0.387)#2,528 |
| 72. | Pittsfield | 0.65% | 0.57%(+0.082)#72 | 0.30%(+0.350)#2,655 |
| 73. | Boston | 0.64% | 0.57%(+0.071)#73 | 0.30%(+0.339)#2,689 |
| 74. | Norwood | 0.64% | 0.57%(+0.069)#74 | 0.30%(+0.338)#2,694 |
| 75. | Watertown Town | 0.64% | 0.57%(+0.068)#75 | 0.30%(+0.336)#2,701 |
| 76. | Mashpee Neck | 0.63% | 0.57%(+0.058)#76 | 0.30%(+0.326)#2,751 |
| 77. | Greenfield | 0.63% | 0.57%(+0.056)#77 | 0.30%(+0.324)#2,760 |
| 78. | Woods Hole | 0.60% | 0.57%(+0.033)#78 | 0.30%(+0.301)#2,861 |
| 79. | Buzzards Bay | 0.60% | 0.57%(+0.030)#79 | 0.30%(+0.298)#2,874 |
| 80. | Essex | 0.59% | 0.57%(+0.013)#80 | 0.30%(+0.281)#2,934 |
| 81. | North Plymouth | 0.57% | 0.57%(-0.006)#81 | 0.30%(+0.262)#3,015 |
| 82. | Provincetown | 0.55% | 0.57%(-0.018)#82 | 0.30%(+0.250)#3,078 |
| 83. | Whitinsville | 0.54% | 0.57%(-0.036)#83 | 0.30%(+0.232)#3,164 |
| 84. | North Pembroke | 0.53% | 0.57%(-0.041)#84 | 0.30%(+0.227)#3,188 |
| 85. | Salem | 0.53% | 0.57%(-0.044)#85 | 0.30%(+0.224)#3,211 |
| 86. | North Attleborough | 0.53% | 0.57%(-0.045)#86 | 0.30%(+0.223)#3,216 |
| 87. | Hopkinton | 0.52% | 0.57%(-0.056)#87 | 0.30%(+0.212)#3,261 |
| 88. | Milford | 0.49% | 0.57%(-0.079)#88 | 0.30%(+0.190)#3,369 |
| 89. | North Brookfield | 0.49% | 0.57%(-0.079)#89 | 0.30%(+0.189)#3,378 |
| 90. | Harwich Port | 0.49% | 0.57%(-0.083)#90 | 0.30%(+0.185)#3,401 |
| 91. | Barnstable Town | 0.47% | 0.57%(-0.102)#91 | 0.30%(+0.166)#3,522 |
| 92. | Braintree Town | 0.43% | 0.57%(-0.138)#92 | 0.30%(+0.130)#3,715 |
| 93. | West Springfield Town | 0.43% | 0.57%(-0.144)#93 | 0.30%(+0.124)#3,751 |
| 94. | Holland | 0.41% | 0.57%(-0.159)#94 | 0.30%(+0.109)#3,850 |
| 95. | Falmouth | 0.39% | 0.57%(-0.186)#95 | 0.30%(+0.083)#4,054 |
| 96. | Walpole | 0.38% | 0.57%(-0.195)#96 | 0.30%(+0.073)#4,136 |
| 97. | Gloucester | 0.36% | 0.57%(-0.213)#97 | 0.30%(+0.055)#4,281 |
| 98. | Peabody | 0.36% | 0.57%(-0.216)#98 | 0.30%(+0.052)#4,308 |
| 99. | Andover | 0.35% | 0.57%(-0.221)#99 | 0.30%(+0.047)#4,353 |
| 100. | Marlborough | 0.35% | 0.57%(-0.224)#100 | 0.30%(+0.044)#4,370 |
Common Questions
What are the Top 10 Cities with the Highest Percentage of Eastern European Population in Massachusetts?
Top 10 Cities with the Highest Percentage of Eastern European Population in Massachusetts are:
#1
13.66%
#2
4.25%
#3
3.97%
#4
3.88%
#5
3.36%
#6
3.32%
#7
2.85%
#8
2.77%
#9
2.76%
#10
2.45%
What city has the Highest Percentage of Eastern European Population in Massachusetts?
Popponesset has the Highest Percentage of Eastern European Population in Massachusetts with 13.66%.
What is the Percentage of Eastern European Population in the State of Massachusetts?
Percentage of Eastern European Population in Massachusetts is 0.57%.
What is the Percentage of Eastern European Population in the United States?
Percentage of Eastern European Population in the United States is 0.30%.