Cities with the Highest Percentage of Eastern European Population in Florida
RELATED REPORTS & OPTIONS
Eastern European
Florida
Compare Cities
Map of Cities with the Highest Percentage of Eastern European Population in Florida
0.00%
10.00%
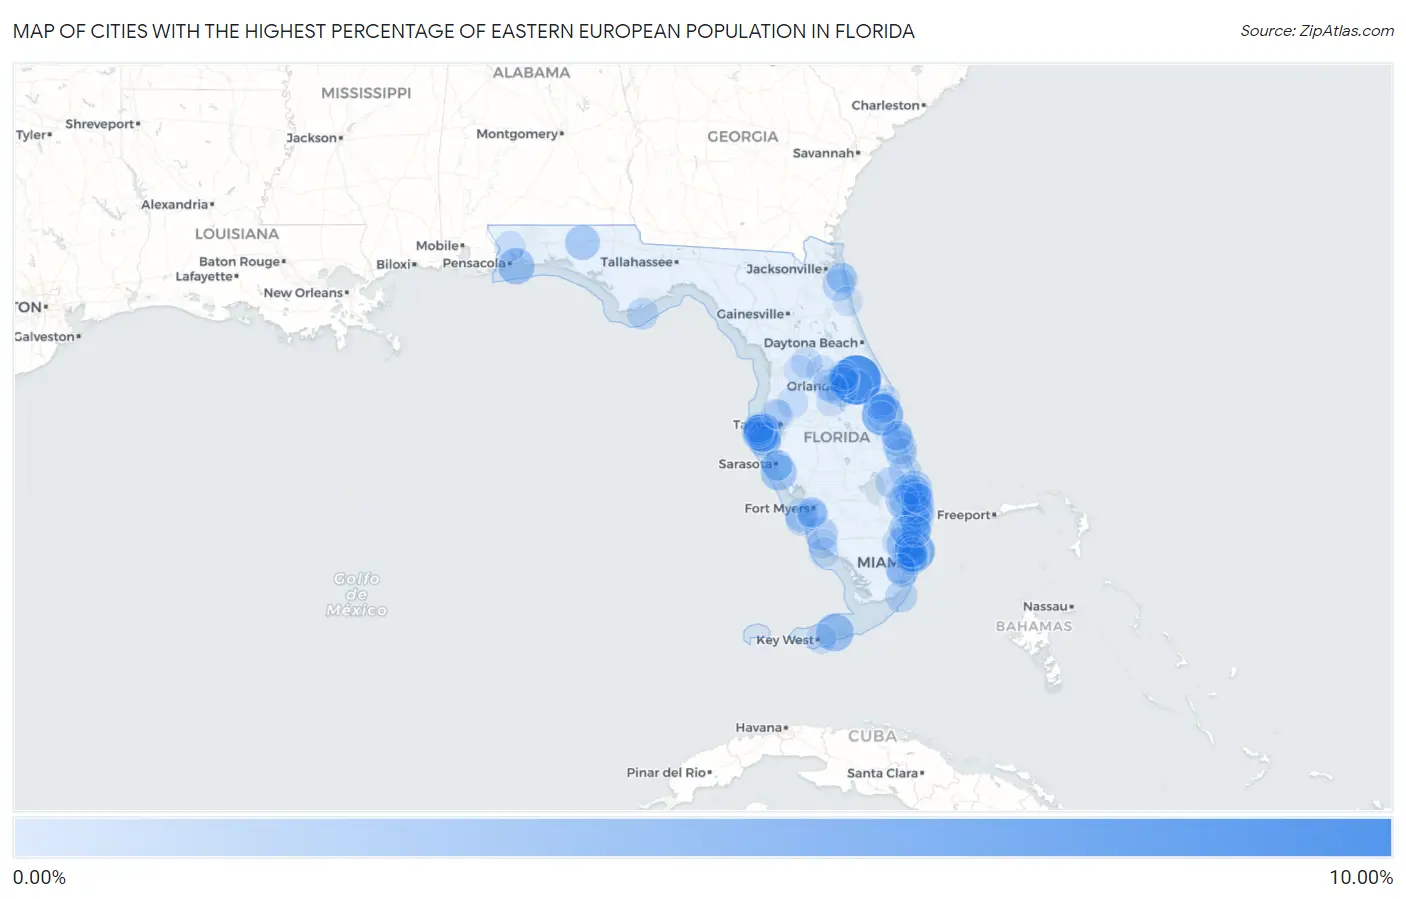
Cities with the Highest Percentage of Eastern European Population in Florida
| City | Eastern European | vs State | vs National | |
| 1. | Chuluota | 9.02% | 0.32% (+8.70)#1 | 0.30% (+8.71)#54 |
| 2. | Golden Beach | 5.66% | 0.32% (+5.34)#2 | 0.30% (+5.35)#117 |
| 3. | Melbourne Village | 5.35% | 0.32% (+5.03)#3 | 0.30% (+5.05)#131 |
| 4. | Bay Pines | 4.20% | 0.32% (+3.88)#4 | 0.30% (+3.89)#222 |
| 5. | Cudjoe Key | 3.80% | 0.32% (+3.48)#5 | 0.30% (+3.49)#262 |
| 6. | Oriole Beach | 3.35% | 0.32% (+3.03)#6 | 0.30% (+3.05)#322 |
| 7. | North Redington Beach | 3.19% | 0.32% (+2.87)#7 | 0.30% (+2.88)#343 |
| 8. | Osprey | 3.15% | 0.32% (+2.83)#8 | 0.30% (+2.84)#349 |
| 9. | Ponce De Leon | 2.71% | 0.32% (+2.39)#9 | 0.30% (+2.41)#434 |
| 10. | Cooper City | 2.47% | 0.32% (+2.15)#10 | 0.30% (+2.17)#489 |
| 11. | Parkland | 2.46% | 0.32% (+2.14)#11 | 0.30% (+2.15)#500 |
| 12. | Aventura | 2.38% | 0.32% (+2.06)#12 | 0.30% (+2.07)#527 |
| 13. | Tequesta | 2.22% | 0.32% (+1.90)#13 | 0.30% (+1.92)#600 |
| 14. | St Pete Beach | 2.21% | 0.32% (+1.89)#14 | 0.30% (+1.91)#604 |
| 15. | Westlake | 2.21% | 0.32% (+1.89)#15 | 0.30% (+1.91)#605 |
| 16. | Ojus | 2.09% | 0.32% (+1.77)#16 | 0.30% (+1.78)#655 |
| 17. | Palm Beach | 2.03% | 0.32% (+1.71)#17 | 0.30% (+1.73)#687 |
| 18. | Boca Raton | 2.01% | 0.32% (+1.69)#18 | 0.30% (+1.70)#699 |
| 19. | South Beach | 1.96% | 0.32% (+1.64)#19 | 0.30% (+1.65)#727 |
| 20. | Vineyards | 1.95% | 0.32% (+1.63)#20 | 0.30% (+1.64)#738 |
| 21. | Highland Beach | 1.85% | 0.32% (+1.54)#21 | 0.30% (+1.55)#784 |
| 22. | Nocatee | 1.67% | 0.32% (+1.35)#22 | 0.30% (+1.37)#878 |
| 23. | Bay Harbor Islands | 1.66% | 0.32% (+1.34)#23 | 0.30% (+1.36)#891 |
| 24. | North Palm Beach | 1.66% | 0.32% (+1.34)#24 | 0.30% (+1.35)#892 |
| 25. | Pelican Marsh | 1.65% | 0.32% (+1.33)#25 | 0.30% (+1.35)#901 |
| 26. | North Key Largo | 1.57% | 0.32% (+1.25)#26 | 0.30% (+1.27)#950 |
| 27. | North River Shores | 1.56% | 0.32% (+1.24)#27 | 0.30% (+1.26)#958 |
| 28. | Tierra Verde | 1.55% | 0.32% (+1.23)#28 | 0.30% (+1.24)#970 |
| 29. | Indian River Shores | 1.55% | 0.32% (+1.23)#29 | 0.30% (+1.24)#971 |
| 30. | Palmer Ranch | 1.54% | 0.32% (+1.23)#30 | 0.30% (+1.24)#974 |
| 31. | Palm Beach Gardens | 1.54% | 0.32% (+1.22)#31 | 0.30% (+1.24)#976 |
| 32. | Manalapan | 1.53% | 0.32% (+1.21)#32 | 0.30% (+1.23)#993 |
| 33. | Winter Garden | 1.49% | 0.32% (+1.17)#33 | 0.30% (+1.19)#1,026 |
| 34. | Pinecrest | 1.48% | 0.32% (+1.16)#34 | 0.30% (+1.18)#1,034 |
| 35. | South Palm Beach | 1.46% | 0.32% (+1.14)#35 | 0.30% (+1.15)#1,056 |
| 36. | Ives Estates | 1.45% | 0.32% (+1.14)#36 | 0.30% (+1.15)#1,058 |
| 37. | Lighthouse Point | 1.44% | 0.32% (+1.12)#37 | 0.30% (+1.13)#1,068 |
| 38. | Indiantown | 1.43% | 0.32% (+1.12)#38 | 0.30% (+1.13)#1,073 |
| 39. | Juno Beach | 1.41% | 0.32% (+1.10)#39 | 0.30% (+1.11)#1,083 |
| 40. | St James City | 1.40% | 0.32% (+1.08)#40 | 0.30% (+1.10)#1,098 |
| 41. | Treasure Island | 1.35% | 0.32% (+1.03)#41 | 0.30% (+1.05)#1,168 |
| 42. | St George Island | 1.34% | 0.32% (+1.02)#42 | 0.30% (+1.04)#1,175 |
| 43. | Sky Lake | 1.29% | 0.32% (+0.974)#43 | 0.30% (+0.989)#1,231 |
| 44. | Sanibel | 1.21% | 0.32% (+0.896)#44 | 0.30% (+0.911)#1,339 |
| 45. | Bithlo | 1.20% | 0.32% (+0.886)#45 | 0.30% (+0.901)#1,357 |
| 46. | Viera East | 1.20% | 0.32% (+0.877)#46 | 0.30% (+0.892)#1,368 |
| 47. | Sawgrass | 1.15% | 0.32% (+0.829)#47 | 0.30% (+0.845)#1,426 |
| 48. | Jupiter Farms | 1.10% | 0.32% (+0.782)#48 | 0.30% (+0.797)#1,503 |
| 49. | Pasadena Hills | 1.10% | 0.32% (+0.780)#49 | 0.30% (+0.795)#1,509 |
| 50. | Maitland | 1.07% | 0.32% (+0.756)#50 | 0.30% (+0.771)#1,552 |
| 51. | St Lucie Village | 1.07% | 0.32% (+0.755)#51 | 0.30% (+0.770)#1,556 |
| 52. | Delray Beach | 1.07% | 0.32% (+0.753)#52 | 0.30% (+0.768)#1,560 |
| 53. | Indian Rocks Beach | 1.03% | 0.32% (+0.711)#53 | 0.30% (+0.726)#1,626 |
| 54. | South Sarasota | 1.03% | 0.32% (+0.711)#54 | 0.30% (+0.726)#1,628 |
| 55. | The Villages | 1.03% | 0.32% (+0.710)#55 | 0.30% (+0.725)#1,630 |
| 56. | Southgate | 1.02% | 0.32% (+0.700)#56 | 0.30% (+0.715)#1,642 |
| 57. | Indian Shores | 1.02% | 0.32% (+0.696)#57 | 0.30% (+0.711)#1,650 |
| 58. | Lake Clarke Shores | 1.01% | 0.32% (+0.694)#58 | 0.30% (+0.709)#1,655 |
| 59. | Mcgregor | 0.99% | 0.32% (+0.675)#59 | 0.30% (+0.690)#1,693 |
| 60. | Palmetto Bay | 0.98% | 0.32% (+0.666)#60 | 0.30% (+0.681)#1,714 |
| 61. | Midway Cdp Santa Rosa County | 0.97% | 0.32% (+0.649)#61 | 0.30% (+0.664)#1,757 |
| 62. | Jupiter | 0.95% | 0.32% (+0.632)#62 | 0.30% (+0.647)#1,793 |
| 63. | Orchid | 0.93% | 0.32% (+0.612)#63 | 0.30% (+0.627)#1,836 |
| 64. | Winter Park | 0.93% | 0.32% (+0.612)#64 | 0.30% (+0.627)#1,837 |
| 65. | Wellington | 0.91% | 0.32% (+0.587)#65 | 0.30% (+0.602)#1,885 |
| 66. | Weston | 0.88% | 0.32% (+0.565)#66 | 0.30% (+0.580)#1,934 |
| 67. | Fern Park | 0.88% | 0.32% (+0.558)#67 | 0.30% (+0.574)#1,946 |
| 68. | Wallace | 0.88% | 0.32% (+0.557)#68 | 0.30% (+0.572)#1,953 |
| 69. | Redington Shores | 0.87% | 0.32% (+0.547)#69 | 0.30% (+0.562)#1,978 |
| 70. | Hollywood | 0.86% | 0.32% (+0.545)#70 | 0.30% (+0.560)#1,985 |
| 71. | Surfside | 0.85% | 0.32% (+0.535)#71 | 0.30% (+0.550)#2,013 |
| 72. | Cypress Lake | 0.85% | 0.32% (+0.534)#72 | 0.30% (+0.549)#2,014 |
| 73. | Celebration | 0.85% | 0.32% (+0.529)#73 | 0.30% (+0.544)#2,024 |
| 74. | Cocoa Beach | 0.84% | 0.32% (+0.519)#74 | 0.30% (+0.534)#2,056 |
| 75. | The Acreage | 0.84% | 0.32% (+0.518)#75 | 0.30% (+0.533)#2,062 |
| 76. | Stock Island | 0.83% | 0.32% (+0.514)#76 | 0.30% (+0.529)#2,073 |
| 77. | Palm Beach Shores | 0.82% | 0.32% (+0.503)#77 | 0.30% (+0.518)#2,115 |
| 78. | Longwood | 0.81% | 0.32% (+0.494)#78 | 0.30% (+0.509)#2,143 |
| 79. | South Patrick Shores | 0.81% | 0.32% (+0.493)#79 | 0.30% (+0.508)#2,147 |
| 80. | Miami Beach | 0.80% | 0.32% (+0.483)#80 | 0.30% (+0.498)#2,173 |
| 81. | Windermere | 0.79% | 0.32% (+0.470)#81 | 0.30% (+0.485)#2,208 |
| 82. | Lake Magdalene | 0.79% | 0.32% (+0.467)#82 | 0.30% (+0.482)#2,215 |
| 83. | Islamorada | 0.78% | 0.32% (+0.462)#83 | 0.30% (+0.477)#2,230 |
| 84. | Coral Springs | 0.78% | 0.32% (+0.458)#84 | 0.30% (+0.474)#2,243 |
| 85. | Northdale | 0.76% | 0.32% (+0.444)#85 | 0.30% (+0.459)#2,293 |
| 86. | Palm Shores | 0.76% | 0.32% (+0.442)#86 | 0.30% (+0.457)#2,301 |
| 87. | Marco Island | 0.74% | 0.32% (+0.421)#87 | 0.30% (+0.436)#2,370 |
| 88. | Tavares | 0.74% | 0.32% (+0.420)#88 | 0.30% (+0.435)#2,372 |
| 89. | Lake Park | 0.73% | 0.32% (+0.415)#89 | 0.30% (+0.430)#2,385 |
| 90. | Chaires | 0.73% | 0.32% (+0.409)#90 | 0.30% (+0.424)#2,408 |
| 91. | Lake Panasoffkee | 0.72% | 0.32% (+0.400)#91 | 0.30% (+0.415)#2,443 |
| 92. | Wabasso Beach | 0.71% | 0.32% (+0.395)#92 | 0.30% (+0.410)#2,457 |
| 93. | Palm Valley | 0.71% | 0.32% (+0.395)#93 | 0.30% (+0.410)#2,460 |
| 94. | West Melbourne | 0.71% | 0.32% (+0.387)#94 | 0.30% (+0.402)#2,477 |
| 95. | Lely Resort | 0.71% | 0.32% (+0.387)#95 | 0.30% (+0.402)#2,478 |
| 96. | Kendall | 0.70% | 0.32% (+0.378)#96 | 0.30% (+0.393)#2,505 |
| 97. | St Augustine Beach | 0.68% | 0.32% (+0.360)#97 | 0.30% (+0.375)#2,565 |
| 98. | Whiskey Creek | 0.68% | 0.32% (+0.360)#98 | 0.30% (+0.375)#2,566 |
| 99. | Hillsboro Beach | 0.67% | 0.32% (+0.355)#99 | 0.30% (+0.370)#2,583 |
| 100. | Sunny Isles Beach | 0.67% | 0.32% (+0.348)#100 | 0.30% (+0.363)#2,606 |
Common Questions
What are the Top 10 Cities with the Highest Percentage of Eastern European Population in Florida?
Top 10 Cities with the Highest Percentage of Eastern European Population in Florida are:
#1
9.02%
#2
5.66%
#3
5.35%
#4
4.20%
#5
3.80%
#6
3.35%
#7
3.19%
#8
3.15%
#9
2.71%
#10
2.47%
What city has the Highest Percentage of Eastern European Population in Florida?
Chuluota has the Highest Percentage of Eastern European Population in Florida with 9.02%.
What is the Percentage of Eastern European Population in the State of Florida?
Percentage of Eastern European Population in Florida is 0.32%.
What is the Percentage of Eastern European Population in the United States?
Percentage of Eastern European Population in the United States is 0.30%.