Cities with the Highest Percentage of Eastern European Population in Texas
RELATED REPORTS & OPTIONS
Eastern European
Texas
Compare Cities
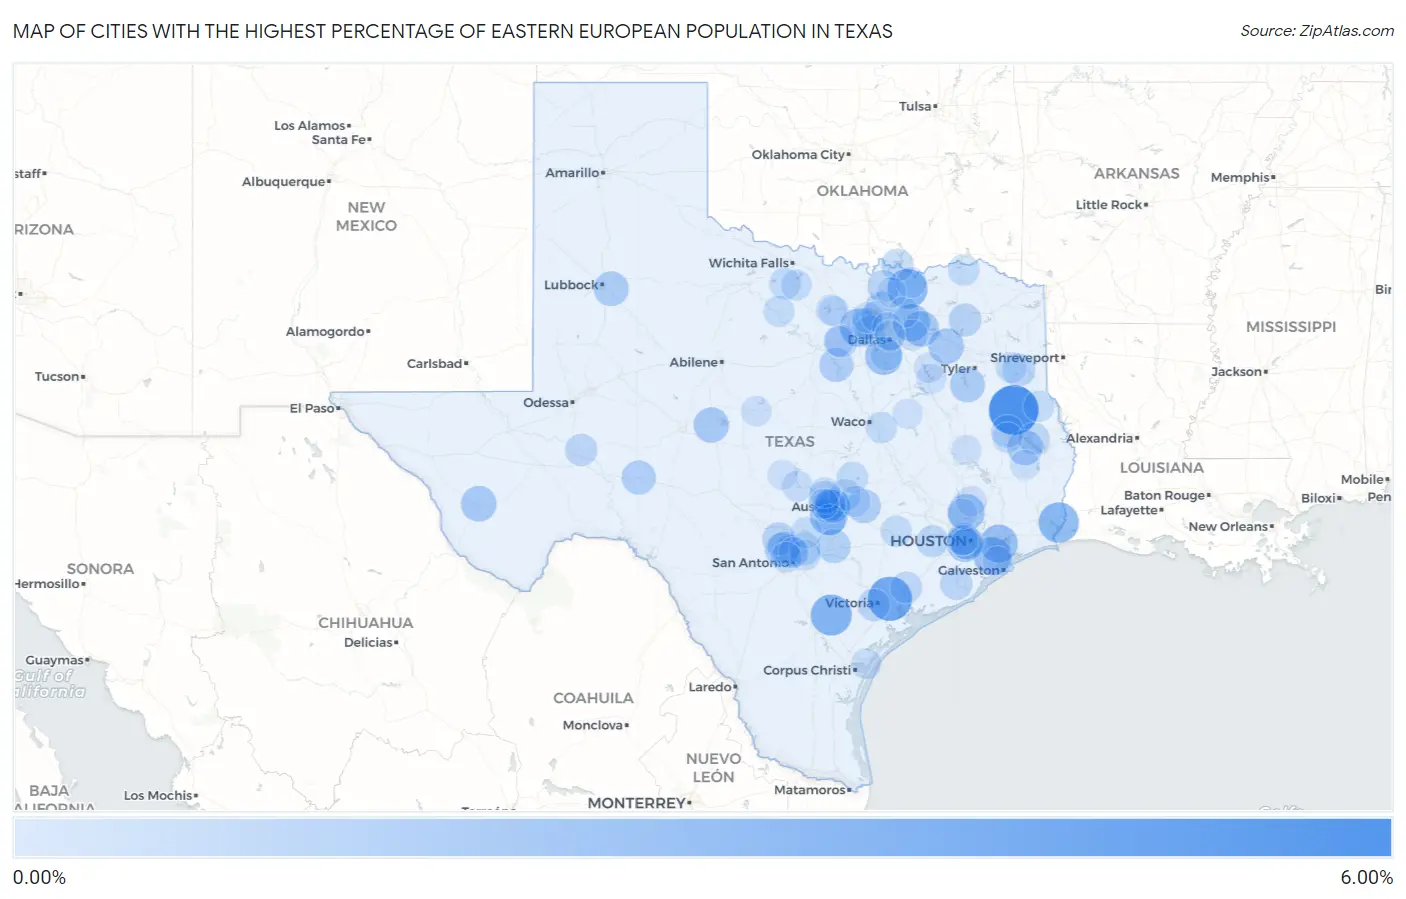
Map of Cities with the Highest Percentage of Eastern European Population in Texas
0.00%
6.00%
Cities with the Highest Percentage of Eastern European Population in Texas
| City | Eastern European | vs State | vs National | |
| 1. | Appleby | 5.10% | 0.12%(+4.98)#1 | 0.30%(+4.80)#148 |
| 2. | Oak Ridge Town Cooke County | 4.85% | 0.12%(+4.74)#2 | 0.30%(+4.55)#166 |
| 3. | Sunrise Shores | 4.72% | 0.12%(+4.60)#3 | 0.30%(+4.42)#177 |
| 4. | Inez | 3.78% | 0.12%(+3.66)#4 | 0.30%(+3.47)#265 |
| 5. | Pettus | 2.99% | 0.12%(+2.87)#5 | 0.30%(+2.68)#380 |
| 6. | Bridge City | 2.82% | 0.12%(+2.70)#6 | 0.30%(+2.52)#409 |
| 7. | Tom Bean | 2.74% | 0.12%(+2.62)#7 | 0.30%(+2.44)#425 |
| 8. | Bacliff | 2.28% | 0.12%(+2.16)#8 | 0.30%(+1.97)#572 |
| 9. | Beach City | 2.27% | 0.12%(+2.15)#9 | 0.30%(+1.97)#578 |
| 10. | Haslet | 2.27% | 0.12%(+2.15)#10 | 0.30%(+1.97)#579 |
| 11. | Hays | 2.17% | 0.12%(+2.05)#11 | 0.30%(+1.87)#620 |
| 12. | Ovilla | 2.08% | 0.12%(+1.97)#12 | 0.30%(+1.78)#657 |
| 13. | Lavon | 2.07% | 0.12%(+1.95)#13 | 0.30%(+1.76)#670 |
| 14. | Shenandoah | 1.98% | 0.12%(+1.86)#14 | 0.30%(+1.68)#706 |
| 15. | Bellaire | 1.86% | 0.12%(+1.75)#15 | 0.30%(+1.56)#778 |
| 16. | Union Valley | 1.69% | 0.12%(+1.57)#16 | 0.30%(+1.38)#866 |
| 17. | Marfa | 1.68% | 0.12%(+1.56)#17 | 0.30%(+1.38)#874 |
| 18. | Fruitvale | 1.67% | 0.12%(+1.55)#18 | 0.30%(+1.36)#883 |
| 19. | Zavalla | 1.65% | 0.12%(+1.53)#19 | 0.30%(+1.35)#900 |
| 20. | Paint Rock | 1.61% | 0.12%(+1.49)#20 | 0.30%(+1.31)#925 |
| 21. | Ransom Canyon | 1.49% | 0.12%(+1.37)#21 | 0.30%(+1.19)#1,027 |
| 22. | Shadybrook | 1.47% | 0.12%(+1.35)#22 | 0.30%(+1.16)#1,048 |
| 23. | Grey Forest | 1.38% | 0.12%(+1.26)#23 | 0.30%(+1.07)#1,134 |
| 24. | Ozona | 1.34% | 0.12%(+1.23)#24 | 0.30%(+1.04)#1,171 |
| 25. | West Lake Hills | 1.34% | 0.12%(+1.22)#25 | 0.30%(+1.04)#1,178 |
| 26. | Mcdade | 1.31% | 0.12%(+1.20)#26 | 0.30%(+1.01)#1,201 |
| 27. | Canyon Creek | 1.30% | 0.12%(+1.19)#27 | 0.30%(+1.00)#1,216 |
| 28. | Kingsbury | 1.27% | 0.12%(+1.15)#28 | 0.30%(+0.970)#1,254 |
| 29. | Barton Creek | 1.14% | 0.12%(+1.03)#29 | 0.30%(+0.840)#1,432 |
| 30. | Rollingwood | 1.12% | 0.12%(+1.00)#30 | 0.30%(+0.819)#1,463 |
| 31. | Como | 1.07% | 0.12%(+0.952)#31 | 0.30%(+0.768)#1,559 |
| 32. | Tatum | 1.06% | 0.12%(+0.942)#32 | 0.30%(+0.758)#1,576 |
| 33. | Shavano Park | 1.04% | 0.12%(+0.925)#33 | 0.30%(+0.740)#1,600 |
| 34. | West University Place | 1.04% | 0.12%(+0.917)#34 | 0.30%(+0.732)#1,611 |
| 35. | Boerne | 1.01% | 0.12%(+0.893)#35 | 0.30%(+0.708)#1,657 |
| 36. | Hudson Bend | 1.01% | 0.12%(+0.889)#36 | 0.30%(+0.704)#1,665 |
| 37. | Spring Valley Village | 0.99% | 0.12%(+0.876)#37 | 0.30%(+0.691)#1,691 |
| 38. | Willow Park | 0.99% | 0.12%(+0.870)#38 | 0.30%(+0.685)#1,704 |
| 39. | Redland | 0.97% | 0.12%(+0.849)#39 | 0.30%(+0.664)#1,756 |
| 40. | Preston | 0.96% | 0.12%(+0.844)#40 | 0.30%(+0.659)#1,771 |
| 41. | Quail Creek | 0.92% | 0.12%(+0.803)#41 | 0.30%(+0.619)#1,854 |
| 42. | Collinsville | 0.91% | 0.12%(+0.789)#42 | 0.30%(+0.604)#1,879 |
| 43. | Wild Peach Village | 0.90% | 0.12%(+0.784)#43 | 0.30%(+0.599)#1,890 |
| 44. | Mccamey | 0.89% | 0.12%(+0.768)#44 | 0.30%(+0.583)#1,929 |
| 45. | Brazos Country | 0.86% | 0.12%(+0.742)#45 | 0.30%(+0.557)#1,993 |
| 46. | Providence Village | 0.84% | 0.12%(+0.724)#46 | 0.30%(+0.539)#2,041 |
| 47. | Cross Mountain | 0.84% | 0.12%(+0.721)#47 | 0.30%(+0.536)#2,051 |
| 48. | Ganado | 0.82% | 0.12%(+0.701)#48 | 0.30%(+0.516)#2,121 |
| 49. | Garden Ridge | 0.82% | 0.12%(+0.699)#49 | 0.30%(+0.515)#2,127 |
| 50. | Broaddus | 0.81% | 0.12%(+0.694)#50 | 0.30%(+0.509)#2,142 |
| 51. | Trophy Club | 0.76% | 0.12%(+0.643)#51 | 0.30%(+0.458)#2,296 |
| 52. | Pflugerville | 0.74% | 0.12%(+0.623)#52 | 0.30%(+0.439)#2,358 |
| 53. | Granger | 0.73% | 0.12%(+0.608)#53 | 0.30%(+0.424)#2,410 |
| 54. | Center Point | 0.72% | 0.12%(+0.602)#54 | 0.30%(+0.417)#2,434 |
| 55. | Powderly | 0.72% | 0.12%(+0.600)#55 | 0.30%(+0.416)#2,442 |
| 56. | Archer City | 0.71% | 0.12%(+0.591)#56 | 0.30%(+0.406)#2,468 |
| 57. | Fayetteville | 0.69% | 0.12%(+0.575)#57 | 0.30%(+0.391)#2,510 |
| 58. | Lost Creek | 0.69% | 0.12%(+0.571)#58 | 0.30%(+0.387)#2,529 |
| 59. | Riesel | 0.68% | 0.12%(+0.564)#59 | 0.30%(+0.380)#2,551 |
| 60. | Buda | 0.67% | 0.12%(+0.554)#60 | 0.30%(+0.370)#2,585 |
| 61. | Glenn Heights | 0.66% | 0.12%(+0.538)#61 | 0.30%(+0.353)#2,645 |
| 62. | Newcastle | 0.63% | 0.12%(+0.512)#62 | 0.30%(+0.327)#2,742 |
| 63. | Lake Cherokee | 0.63% | 0.12%(+0.510)#63 | 0.30%(+0.325)#2,758 |
| 64. | Elgin | 0.63% | 0.12%(+0.508)#64 | 0.30%(+0.324)#2,763 |
| 65. | Colleyville | 0.62% | 0.12%(+0.503)#65 | 0.30%(+0.318)#2,783 |
| 66. | Canyon Lake | 0.60% | 0.12%(+0.483)#66 | 0.30%(+0.299)#2,871 |
| 67. | Windthorst | 0.60% | 0.12%(+0.480)#67 | 0.30%(+0.295)#2,886 |
| 68. | Southside Place | 0.59% | 0.12%(+0.467)#68 | 0.30%(+0.283)#2,927 |
| 69. | Randolph Afb | 0.59% | 0.12%(+0.467)#69 | 0.30%(+0.282)#2,930 |
| 70. | Argyle | 0.58% | 0.12%(+0.463)#70 | 0.30%(+0.278)#2,953 |
| 71. | Lake Bridgeport | 0.57% | 0.12%(+0.454)#71 | 0.30%(+0.269)#2,997 |
| 72. | Leon Valley | 0.57% | 0.12%(+0.447)#72 | 0.30%(+0.262)#3,014 |
| 73. | Center | 0.56% | 0.12%(+0.436)#73 | 0.30%(+0.252)#3,067 |
| 74. | Sunrise Beach Village | 0.55% | 0.12%(+0.433)#74 | 0.30%(+0.249)#3,081 |
| 75. | Hickory Creek | 0.55% | 0.12%(+0.431)#75 | 0.30%(+0.247)#3,089 |
| 76. | Hudson Oaks | 0.54% | 0.12%(+0.424)#76 | 0.30%(+0.239)#3,136 |
| 77. | Mclendon Chisholm | 0.53% | 0.12%(+0.414)#77 | 0.30%(+0.229)#3,183 |
| 78. | Lowry Crossing | 0.53% | 0.12%(+0.411)#78 | 0.30%(+0.227)#3,192 |
| 79. | Ingleside | 0.51% | 0.12%(+0.396)#79 | 0.30%(+0.211)#3,264 |
| 80. | Piney Point Village | 0.51% | 0.12%(+0.395)#80 | 0.30%(+0.210)#3,269 |
| 81. | Addison | 0.51% | 0.12%(+0.392)#81 | 0.30%(+0.207)#3,289 |
| 82. | Jonestown | 0.50% | 0.12%(+0.382)#82 | 0.30%(+0.197)#3,332 |
| 83. | Hill Country Village | 0.50% | 0.12%(+0.380)#83 | 0.30%(+0.195)#3,344 |
| 84. | Cut And Shoot | 0.50% | 0.12%(+0.379)#84 | 0.30%(+0.195)#3,345 |
| 85. | Bells | 0.48% | 0.12%(+0.365)#85 | 0.30%(+0.180)#3,431 |
| 86. | Bangs | 0.47% | 0.12%(+0.352)#86 | 0.30%(+0.168)#3,515 |
| 87. | The Woodlands | 0.43% | 0.12%(+0.316)#87 | 0.30%(+0.131)#3,698 |
| 88. | Lufkin | 0.43% | 0.12%(+0.314)#88 | 0.30%(+0.129)#3,719 |
| 89. | University Park | 0.43% | 0.12%(+0.314)#89 | 0.30%(+0.129)#3,722 |
| 90. | Highland Park | 0.42% | 0.12%(+0.299)#90 | 0.30%(+0.115)#3,814 |
| 91. | Llano | 0.41% | 0.12%(+0.296)#91 | 0.30%(+0.111)#3,838 |
| 92. | Bridgeport | 0.41% | 0.12%(+0.295)#92 | 0.30%(+0.110)#3,846 |
| 93. | Colmesneil | 0.41% | 0.12%(+0.293)#93 | 0.30%(+0.108)#3,857 |
| 94. | Mabank | 0.41% | 0.12%(+0.292)#94 | 0.30%(+0.107)#3,860 |
| 95. | Mexia | 0.41% | 0.12%(+0.286)#95 | 0.30%(+0.102)#3,902 |
| 96. | Lovelady | 0.40% | 0.12%(+0.279)#96 | 0.30%(+0.094)#3,972 |
| 97. | Gunter | 0.39% | 0.12%(+0.276)#97 | 0.30%(+0.091)#3,992 |
| 98. | Star Harbor | 0.39% | 0.12%(+0.275)#98 | 0.30%(+0.090)#3,998 |
| 99. | Texas City | 0.39% | 0.12%(+0.269)#99 | 0.30%(+0.084)#4,035 |
| 100. | Bee Cave | 0.39% | 0.12%(+0.269)#100 | 0.30%(+0.084)#4,039 |
Common Questions
What are the Top 10 Cities with the Highest Percentage of Eastern European Population in Texas?
Top 10 Cities with the Highest Percentage of Eastern European Population in Texas are:
#1
5.10%
#2
3.78%
#3
2.99%
#4
2.82%
#5
2.74%
#6
2.28%
#7
2.27%
#8
2.27%
#9
2.17%
#10
2.08%
What city has the Highest Percentage of Eastern European Population in Texas?
Appleby has the Highest Percentage of Eastern European Population in Texas with 5.10%.
What is the Percentage of Eastern European Population in the State of Texas?
Percentage of Eastern European Population in Texas is 0.12%.
What is the Percentage of Eastern European Population in the United States?
Percentage of Eastern European Population in the United States is 0.30%.