Cities with the Highest Percentage of Eastern European Population in Connecticut
RELATED REPORTS & OPTIONS
Eastern European
Connecticut
Compare Cities
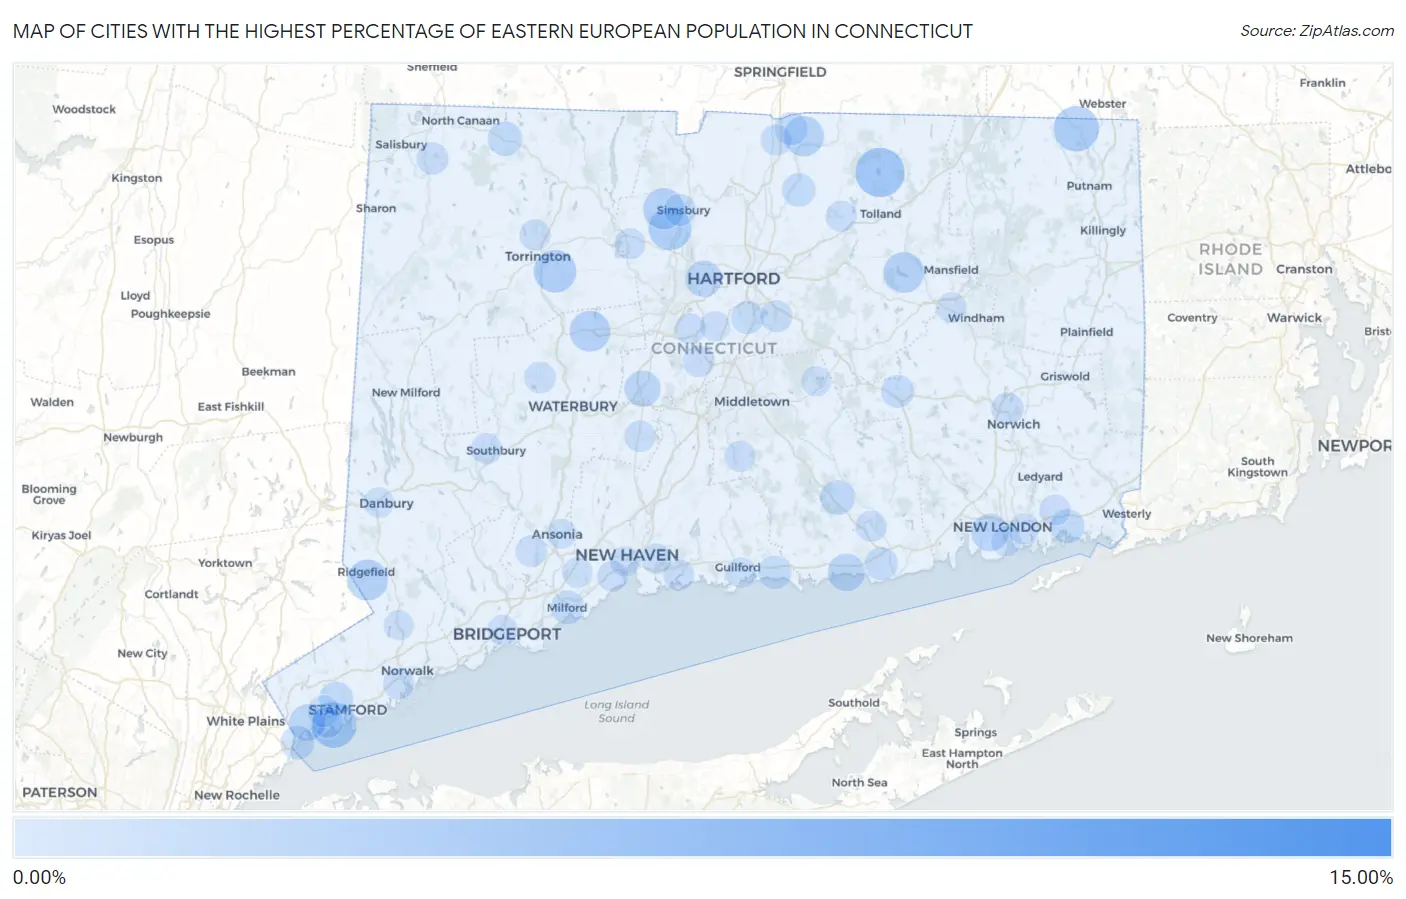
Map of Cities with the Highest Percentage of Eastern European Population in Connecticut
0.00%
15.00%
Cities with the Highest Percentage of Eastern European Population in Connecticut
| City | Eastern European | vs State | vs National | |
| 1. | Fenwick Borough | 12.50% | 0.56%(+11.9)#1 | 0.30%(+12.2)#38 |
| 2. | Rock Ridge | 11.72% | 0.56%(+11.2)#2 | 0.30%(+11.4)#39 |
| 3. | Weston | 9.91% | 0.56%(+9.35)#3 | 0.30%(+9.61)#48 |
| 4. | Dodgingtown | 7.87% | 0.56%(+7.31)#4 | 0.30%(+7.56)#66 |
| 5. | Brookfield Center | 5.29% | 0.56%(+4.73)#5 | 0.30%(+4.99)#135 |
| 6. | Staples | 4.83% | 0.56%(+4.27)#6 | 0.30%(+4.53)#168 |
| 7. | Westport | 4.50% | 0.56%(+3.94)#7 | 0.30%(+4.19)#196 |
| 8. | Saugatuck | 4.17% | 0.56%(+3.61)#8 | 0.30%(+3.86)#224 |
| 9. | Crystal Lake | 3.94% | 0.56%(+3.38)#9 | 0.30%(+3.64)#244 |
| 10. | Coleytown | 3.39% | 0.56%(+2.83)#10 | 0.30%(+3.09)#316 |
| 11. | Mill Plain | 3.31% | 0.56%(+2.75)#11 | 0.30%(+3.01)#328 |
| 12. | Old Greenwich | 3.22% | 0.56%(+2.66)#12 | 0.30%(+2.91)#337 |
| 13. | Quinebaug | 3.17% | 0.56%(+2.61)#13 | 0.30%(+2.87)#346 |
| 14. | West Mountain | 3.07% | 0.56%(+2.51)#14 | 0.30%(+2.77)#365 |
| 15. | Woodmont Borough | 2.96% | 0.56%(+2.41)#15 | 0.30%(+2.66)#384 |
| 16. | Tashua | 2.91% | 0.56%(+2.35)#16 | 0.30%(+2.60)#395 |
| 17. | Northwest Harwinton | 2.62% | 0.56%(+2.06)#17 | 0.30%(+2.32)#458 |
| 18. | Weatogue | 2.62% | 0.56%(+2.06)#18 | 0.30%(+2.32)#459 |
| 19. | Oronoque | 2.53% | 0.56%(+1.97)#19 | 0.30%(+2.23)#478 |
| 20. | Old Hill | 2.52% | 0.56%(+1.96)#20 | 0.30%(+2.22)#482 |
| 21. | West Simsbury | 2.36% | 0.56%(+1.80)#21 | 0.30%(+2.06)#532 |
| 22. | Ridgefield | 2.29% | 0.56%(+1.73)#22 | 0.30%(+1.98)#564 |
| 23. | South Coventry | 2.25% | 0.56%(+1.69)#23 | 0.30%(+1.94)#590 |
| 24. | Terryville | 2.24% | 0.56%(+1.68)#24 | 0.30%(+1.94)#593 |
| 25. | Hazardville | 2.16% | 0.56%(+1.60)#25 | 0.30%(+1.85)#623 |
| 26. | Lake Bungee | 2.14% | 0.56%(+1.58)#26 | 0.30%(+1.83)#633 |
| 27. | Route 7 Gateway | 2.08% | 0.56%(+1.52)#27 | 0.30%(+1.78)#661 |
| 28. | Daniels Farm | 1.90% | 0.56%(+1.34)#28 | 0.30%(+1.59)#759 |
| 29. | Greens Farms | 1.84% | 0.56%(+1.28)#29 | 0.30%(+1.53)#792 |
| 30. | Cornwall Bridge | 1.75% | 0.56%(+1.19)#30 | 0.30%(+1.44)#839 |
| 31. | Compo | 1.68% | 0.56%(+1.12)#31 | 0.30%(+1.37)#877 |
| 32. | Westbrook Center | 1.64% | 0.56%(+1.08)#32 | 0.30%(+1.34)#904 |
| 33. | Waterford | 1.62% | 0.56%(+1.06)#33 | 0.30%(+1.31)#919 |
| 34. | Lakes West | 1.55% | 0.56%(+0.987)#34 | 0.30%(+1.24)#972 |
| 35. | Candlewood Isle | 1.50% | 0.56%(+0.939)#35 | 0.30%(+1.20)#1,021 |
| 36. | Greenwich | 1.42% | 0.56%(+0.864)#36 | 0.30%(+1.12)#1,079 |
| 37. | Plantsville | 1.39% | 0.56%(+0.832)#37 | 0.30%(+1.09)#1,116 |
| 38. | West Hartford | 1.38% | 0.56%(+0.818)#38 | 0.30%(+1.07)#1,130 |
| 39. | Lakeside Woods | 1.24% | 0.56%(+0.684)#39 | 0.30%(+0.940)#1,291 |
| 40. | Chester Center | 1.16% | 0.56%(+0.597)#40 | 0.30%(+0.853)#1,417 |
| 41. | Norfolk | 1.07% | 0.56%(+0.514)#41 | 0.30%(+0.770)#1,557 |
| 42. | Stonington Borough | 1.06% | 0.56%(+0.502)#42 | 0.30%(+0.758)#1,574 |
| 43. | Mystic | 1.02% | 0.56%(+0.459)#43 | 0.30%(+0.715)#1,643 |
| 44. | Murray | 0.99% | 0.56%(+0.430)#44 | 0.30%(+0.686)#1,701 |
| 45. | Lordship | 0.99% | 0.56%(+0.427)#45 | 0.30%(+0.683)#1,708 |
| 46. | Stamford | 0.98% | 0.56%(+0.417)#46 | 0.30%(+0.673)#1,737 |
| 47. | Byram | 0.95% | 0.56%(+0.386)#47 | 0.30%(+0.642)#1,804 |
| 48. | Milford City Balance | 0.92% | 0.56%(+0.356)#48 | 0.30%(+0.612)#1,864 |
| 49. | Broad Brook | 0.87% | 0.56%(+0.314)#49 | 0.30%(+0.570)#1,959 |
| 50. | Madison Center | 0.85% | 0.56%(+0.287)#50 | 0.30%(+0.543)#2,030 |
| 51. | Sherwood Manor | 0.84% | 0.56%(+0.278)#51 | 0.30%(+0.534)#2,058 |
| 52. | Old Saybrook Center | 0.79% | 0.56%(+0.234)#52 | 0.30%(+0.490)#2,191 |
| 53. | South Wilton | 0.77% | 0.56%(+0.211)#53 | 0.30%(+0.467)#2,267 |
| 54. | Wethersfield | 0.77% | 0.56%(+0.209)#54 | 0.30%(+0.465)#2,272 |
| 55. | Colchester | 0.76% | 0.56%(+0.200)#55 | 0.30%(+0.456)#2,304 |
| 56. | Ridgebury | 0.73% | 0.56%(+0.172)#56 | 0.30%(+0.428)#2,396 |
| 57. | Newtown Borough | 0.66% | 0.56%(+0.104)#57 | 0.30%(+0.360)#2,615 |
| 58. | Norwich | 0.65% | 0.56%(+0.089)#58 | 0.30%(+0.345)#2,670 |
| 59. | Falls Village | 0.63% | 0.56%(+0.075)#59 | 0.30%(+0.331)#2,727 |
| 60. | Poplar Plains | 0.63% | 0.56%(+0.069)#60 | 0.30%(+0.325)#2,756 |
| 61. | Simsbury Center | 0.62% | 0.56%(+0.062)#61 | 0.30%(+0.318)#2,786 |
| 62. | Litchfield Borough | 0.59% | 0.56%(+0.031)#62 | 0.30%(+0.287)#2,918 |
| 63. | Glastonbury Center | 0.58% | 0.56%(+0.018)#63 | 0.30%(+0.274)#2,975 |
| 64. | Cos Cob | 0.57% | 0.56%(+0.006)#64 | 0.30%(+0.262)#3,013 |
| 65. | Tokeneke | 0.54% | 0.56%(-0.016)#65 | 0.30%(+0.240)#3,128 |
| 66. | Watertown | 0.53% | 0.56%(-0.028)#66 | 0.30%(+0.227)#3,187 |
| 67. | Shelton | 0.53% | 0.56%(-0.031)#67 | 0.30%(+0.225)#3,199 |
| 68. | Kensington | 0.51% | 0.56%(-0.048)#68 | 0.30%(+0.208)#3,286 |
| 69. | Norwalk | 0.48% | 0.56%(-0.084)#69 | 0.30%(+0.172)#3,488 |
| 70. | Stepney | 0.46% | 0.56%(-0.097)#70 | 0.30%(+0.159)#3,559 |
| 71. | Torrington | 0.46% | 0.56%(-0.098)#71 | 0.30%(+0.158)#3,563 |
| 72. | Cheshire Village | 0.46% | 0.56%(-0.100)#72 | 0.30%(+0.156)#3,579 |
| 73. | Branford Center | 0.45% | 0.56%(-0.108)#73 | 0.30%(+0.148)#3,619 |
| 74. | Heritage Village | 0.43% | 0.56%(-0.129)#74 | 0.30%(+0.127)#3,734 |
| 75. | Bigelow Corners | 0.43% | 0.56%(-0.132)#75 | 0.30%(+0.124)#3,753 |
| 76. | Thompsonville | 0.42% | 0.56%(-0.140)#76 | 0.30%(+0.116)#3,801 |
| 77. | Sandy Hook | 0.41% | 0.56%(-0.154)#77 | 0.30%(+0.102)#3,898 |
| 78. | Naugatuck Borough | 0.40% | 0.56%(-0.155)#78 | 0.30%(+0.101)#3,914 |
| 79. | Essex Village | 0.40% | 0.56%(-0.156)#79 | 0.30%(+0.100)#3,920 |
| 80. | Durham | 0.40% | 0.56%(-0.156)#80 | 0.30%(+0.100)#3,921 |
| 81. | Rockville | 0.40% | 0.56%(-0.157)#81 | 0.30%(+0.099)#3,928 |
| 82. | Old Mystic | 0.38% | 0.56%(-0.176)#82 | 0.30%(+0.080)#4,073 |
| 83. | Collinsville | 0.37% | 0.56%(-0.186)#83 | 0.30%(+0.070)#4,170 |
| 84. | Riverside | 0.36% | 0.56%(-0.197)#84 | 0.30%(+0.059)#4,240 |
| 85. | Long Hill | 0.35% | 0.56%(-0.206)#85 | 0.30%(+0.050)#4,325 |
| 86. | West Haven | 0.34% | 0.56%(-0.216)#86 | 0.30%(+0.040)#4,412 |
| 87. | New Britain | 0.34% | 0.56%(-0.220)#87 | 0.30%(+0.036)#4,447 |
| 88. | East Haven | 0.31% | 0.56%(-0.247)#88 | 0.30%(+0.008)#4,719 |
| 89. | New Canaan | 0.31% | 0.56%(-0.254)#89 | 0.30%(+0.002)#4,773 |
| 90. | Orange | 0.30% | 0.56%(-0.264)#90 | 0.30%(-0.009)#4,887 |
| 91. | Danbury | 0.27% | 0.56%(-0.286)#91 | 0.30%(-0.030)#5,158 |
| 92. | New Haven | 0.27% | 0.56%(-0.286)#92 | 0.30%(-0.030)#5,170 |
| 93. | Bridgeport | 0.26% | 0.56%(-0.295)#93 | 0.30%(-0.039)#5,294 |
| 94. | New London | 0.26% | 0.56%(-0.295)#94 | 0.30%(-0.039)#5,297 |
| 95. | Lake Pocotopaug | 0.25% | 0.56%(-0.308)#95 | 0.30%(-0.052)#5,459 |
| 96. | Wilton Center | 0.24% | 0.56%(-0.316)#96 | 0.30%(-0.060)#5,543 |
| 97. | Newington | 0.24% | 0.56%(-0.317)#97 | 0.30%(-0.061)#5,551 |
| 98. | Willimantic | 0.24% | 0.56%(-0.318)#98 | 0.30%(-0.062)#5,561 |
| 99. | Guilford Center | 0.24% | 0.56%(-0.324)#99 | 0.30%(-0.068)#5,622 |
| 100. | Ansonia | 0.23% | 0.56%(-0.333)#100 | 0.30%(-0.077)#5,739 |
Common Questions
What are the Top 10 Cities with the Highest Percentage of Eastern European Population in Connecticut?
Top 10 Cities with the Highest Percentage of Eastern European Population in Connecticut are:
#1
3.94%
#2
3.22%
#3
3.17%
#4
2.62%
#5
2.62%
#6
2.36%
#7
2.29%
#8
2.25%
#9
2.24%
#10
2.16%
What city has the Highest Percentage of Eastern European Population in Connecticut?
Crystal Lake has the Highest Percentage of Eastern European Population in Connecticut with 3.94%.
What is the Percentage of Eastern European Population in the State of Connecticut?
Percentage of Eastern European Population in Connecticut is 0.56%.
What is the Percentage of Eastern European Population in the United States?
Percentage of Eastern European Population in the United States is 0.30%.