Cities with the Highest Percentage of Eastern European Population in Tennessee
RELATED REPORTS & OPTIONS
Eastern European
Tennessee
Compare Cities
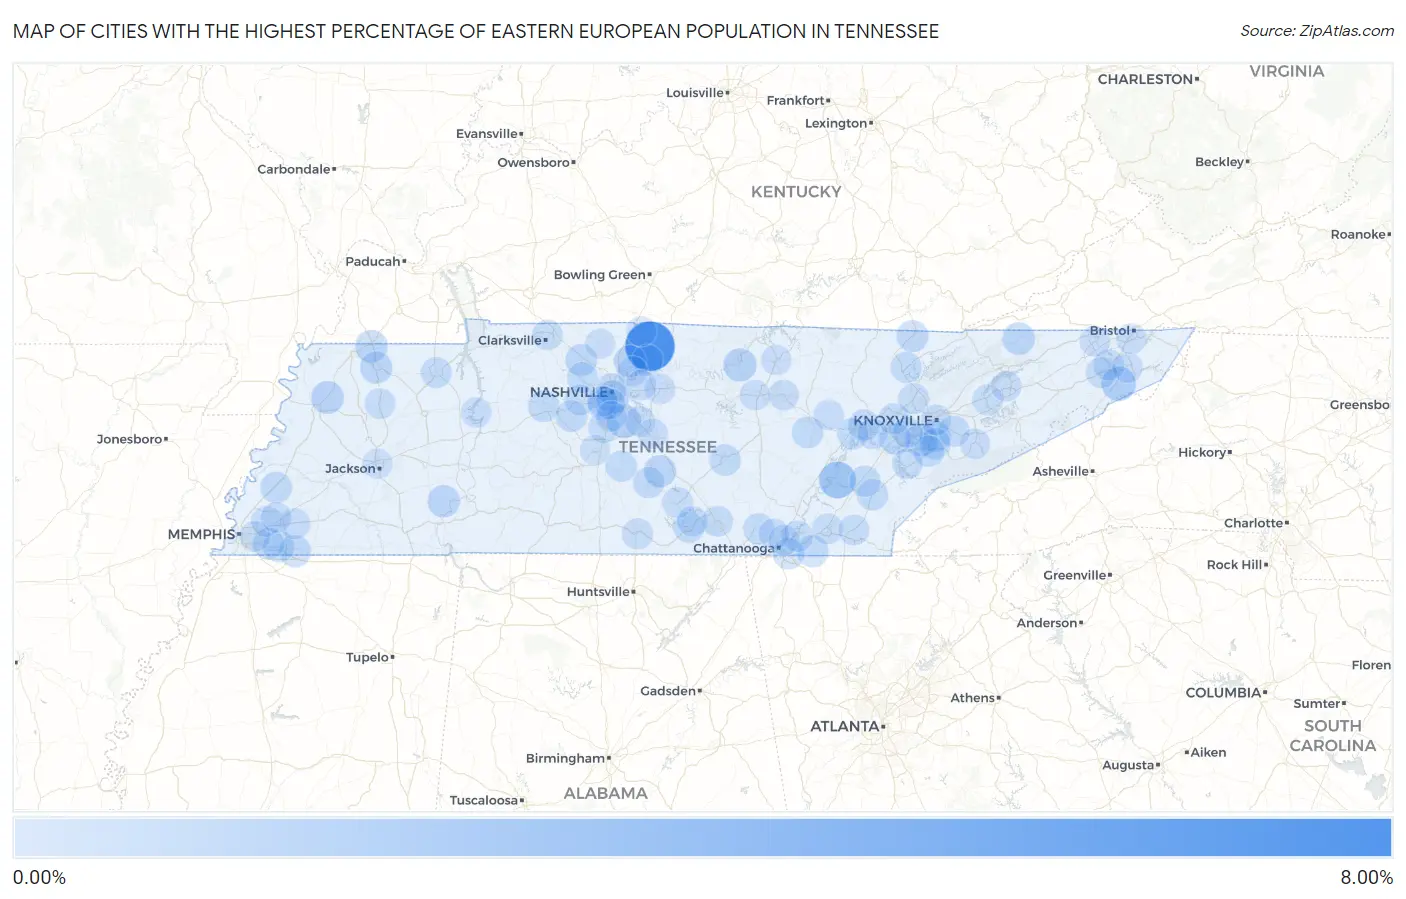
Map of Cities with the Highest Percentage of Eastern European Population in Tennessee
0.00%
8.00%
Cities with the Highest Percentage of Eastern European Population in Tennessee
| City | Eastern European | vs State | vs National | |
| 1. | Graball | 6.34% | 0.16%(+6.18)#1 | 0.30%(+6.03)#93 |
| 2. | Decatur | 2.07% | 0.16%(+1.91)#2 | 0.30%(+1.76)#669 |
| 3. | Unicoi | 1.29% | 0.16%(+1.13)#3 | 0.30%(+0.985)#1,234 |
| 4. | Nolensville | 1.08% | 0.16%(+0.924)#4 | 0.30%(+0.776)#1,541 |
| 5. | Karns | 1.08% | 0.16%(+0.923)#5 | 0.30%(+0.775)#1,543 |
| 6. | Gainesboro | 0.92% | 0.16%(+0.765)#6 | 0.30%(+0.617)#1,857 |
| 7. | Berry Hill | 0.91% | 0.16%(+0.757)#7 | 0.30%(+0.609)#1,871 |
| 8. | Louisville | 0.89% | 0.16%(+0.739)#8 | 0.30%(+0.591)#1,907 |
| 9. | Newbern | 0.81% | 0.16%(+0.657)#9 | 0.30%(+0.509)#2,141 |
| 10. | Sneedville | 0.75% | 0.16%(+0.599)#10 | 0.30%(+0.451)#2,316 |
| 11. | South Fulton | 0.70% | 0.16%(+0.545)#11 | 0.30%(+0.396)#2,495 |
| 12. | Saltillo | 0.68% | 0.16%(+0.529)#12 | 0.30%(+0.381)#2,543 |
| 13. | Martin | 0.67% | 0.16%(+0.510)#13 | 0.30%(+0.362)#2,609 |
| 14. | Bell Buckle | 0.64% | 0.16%(+0.489)#14 | 0.30%(+0.340)#2,685 |
| 15. | Shackle Island | 0.64% | 0.16%(+0.484)#15 | 0.30%(+0.336)#2,698 |
| 16. | Rossville | 0.59% | 0.16%(+0.435)#16 | 0.30%(+0.287)#2,917 |
| 17. | Gladeville | 0.54% | 0.16%(+0.385)#17 | 0.30%(+0.237)#3,143 |
| 18. | Pleasant View | 0.53% | 0.16%(+0.370)#18 | 0.30%(+0.222)#3,224 |
| 19. | Jellico | 0.50% | 0.16%(+0.342)#19 | 0.30%(+0.194)#3,351 |
| 20. | Lenoir City | 0.50% | 0.16%(+0.340)#20 | 0.30%(+0.192)#3,361 |
| 21. | Collierville | 0.49% | 0.16%(+0.331)#21 | 0.30%(+0.183)#3,416 |
| 22. | Brighton | 0.49% | 0.16%(+0.331)#22 | 0.30%(+0.183)#3,418 |
| 23. | Apison | 0.48% | 0.16%(+0.321)#23 | 0.30%(+0.173)#3,484 |
| 24. | Rockford | 0.47% | 0.16%(+0.316)#24 | 0.30%(+0.167)#3,517 |
| 25. | Biltmore | 0.47% | 0.16%(+0.314)#25 | 0.30%(+0.166)#3,526 |
| 26. | Dickson | 0.46% | 0.16%(+0.305)#26 | 0.30%(+0.157)#3,566 |
| 27. | Mcminnville | 0.46% | 0.16%(+0.302)#27 | 0.30%(+0.154)#3,586 |
| 28. | Germantown | 0.40% | 0.16%(+0.246)#28 | 0.30%(+0.098)#3,940 |
| 29. | Fairview | 0.40% | 0.16%(+0.244)#29 | 0.30%(+0.095)#3,962 |
| 30. | Lake Tansi | 0.40% | 0.16%(+0.240)#30 | 0.30%(+0.092)#3,989 |
| 31. | Seymour | 0.37% | 0.16%(+0.218)#31 | 0.30%(+0.069)#4,175 |
| 32. | Forest Hills | 0.37% | 0.16%(+0.210)#32 | 0.30%(+0.062)#4,219 |
| 33. | Englewood | 0.36% | 0.16%(+0.209)#33 | 0.30%(+0.061)#4,226 |
| 34. | Eagleton Village | 0.36% | 0.16%(+0.201)#34 | 0.30%(+0.053)#4,300 |
| 35. | Powells Crossroads | 0.36% | 0.16%(+0.200)#35 | 0.30%(+0.052)#4,309 |
| 36. | Shelbyville | 0.35% | 0.16%(+0.195)#36 | 0.30%(+0.047)#4,347 |
| 37. | Maryville | 0.34% | 0.16%(+0.186)#37 | 0.30%(+0.038)#4,423 |
| 38. | Harriman | 0.33% | 0.16%(+0.178)#38 | 0.30%(+0.030)#4,518 |
| 39. | East Ridge | 0.33% | 0.16%(+0.171)#39 | 0.30%(+0.023)#4,592 |
| 40. | Jacksboro | 0.32% | 0.16%(+0.169)#40 | 0.30%(+0.021)#4,609 |
| 41. | Chapel Hill | 0.31% | 0.16%(+0.152)#41 | 0.30%(+0.004)#4,759 |
| 42. | Nashville | 0.30% | 0.16%(+0.146)#42 | 0.30%(-0.002)#4,825 |
| 43. | Rockwood | 0.29% | 0.16%(+0.137)#43 | 0.30%(-0.011)#4,921 |
| 44. | Paris | 0.29% | 0.16%(+0.135)#44 | 0.30%(-0.013)#4,943 |
| 45. | Ashland City | 0.29% | 0.16%(+0.132)#45 | 0.30%(-0.016)#4,972 |
| 46. | Winchester | 0.29% | 0.16%(+0.130)#46 | 0.30%(-0.018)#4,995 |
| 47. | Niota | 0.28% | 0.16%(+0.128)#47 | 0.30%(-0.020)#5,017 |
| 48. | Oak Ridge | 0.28% | 0.16%(+0.127)#48 | 0.30%(-0.022)#5,049 |
| 49. | Pegram | 0.28% | 0.16%(+0.121)#49 | 0.30%(-0.027)#5,123 |
| 50. | Franklin | 0.27% | 0.16%(+0.117)#50 | 0.30%(-0.031)#5,182 |
| 51. | Jonesborough | 0.27% | 0.16%(+0.116)#51 | 0.30%(-0.032)#5,197 |
| 52. | Fayetteville | 0.27% | 0.16%(+0.115)#52 | 0.30%(-0.033)#5,221 |
| 53. | Harrison | 0.26% | 0.16%(+0.109)#53 | 0.30%(-0.039)#5,295 |
| 54. | Monteagle | 0.26% | 0.16%(+0.106)#54 | 0.30%(-0.043)#5,341 |
| 55. | Johnson City | 0.26% | 0.16%(+0.103)#55 | 0.30%(-0.045)#5,376 |
| 56. | Clinton | 0.26% | 0.16%(+0.103)#56 | 0.30%(-0.045)#5,380 |
| 57. | Gallatin | 0.25% | 0.16%(+0.098)#57 | 0.30%(-0.050)#5,439 |
| 58. | Oakland | 0.24% | 0.16%(+0.085)#58 | 0.30%(-0.063)#5,574 |
| 59. | Greenback | 0.20% | 0.16%(+0.048)#59 | 0.30%(-0.100)#6,024 |
| 60. | Cleveland | 0.20% | 0.16%(+0.046)#60 | 0.30%(-0.103)#6,049 |
| 61. | Tullahoma | 0.19% | 0.16%(+0.039)#61 | 0.30%(-0.109)#6,143 |
| 62. | Benton | 0.19% | 0.16%(+0.034)#62 | 0.30%(-0.114)#6,218 |
| 63. | Oak Hill | 0.19% | 0.16%(+0.033)#63 | 0.30%(-0.115)#6,226 |
| 64. | Farragut | 0.18% | 0.16%(+0.025)#64 | 0.30%(-0.123)#6,341 |
| 65. | Bradford | 0.18% | 0.16%(+0.021)#65 | 0.30%(-0.127)#6,388 |
| 66. | Belle Meade | 0.17% | 0.16%(+0.015)#66 | 0.30%(-0.133)#6,475 |
| 67. | Knoxville | 0.17% | 0.16%(+0.015)#67 | 0.30%(-0.133)#6,476 |
| 68. | Bartlett | 0.17% | 0.16%(+0.011)#68 | 0.30%(-0.137)#6,523 |
| 69. | Jefferson City | 0.17% | 0.16%(+0.011)#69 | 0.30%(-0.137)#6,524 |
| 70. | Smyrna | 0.16% | 0.16%(+0.004)#70 | 0.30%(-0.144)#6,633 |
| 71. | Memphis | 0.15% | 0.16%(-0.004)#71 | 0.30%(-0.153)#6,754 |
| 72. | Clarksville | 0.15% | 0.16%(-0.005)#72 | 0.30%(-0.153)#6,760 |
| 73. | Decherd | 0.15% | 0.16%(-0.006)#73 | 0.30%(-0.154)#6,773 |
| 74. | Kingsport | 0.15% | 0.16%(-0.008)#74 | 0.30%(-0.156)#6,816 |
| 75. | Lebanon | 0.15% | 0.16%(-0.009)#75 | 0.30%(-0.157)#6,834 |
| 76. | Monterey | 0.15% | 0.16%(-0.010)#76 | 0.30%(-0.158)#6,854 |
| 77. | Signal Mountain | 0.14% | 0.16%(-0.020)#77 | 0.30%(-0.168)#6,983 |
| 78. | Brentwood | 0.13% | 0.16%(-0.022)#78 | 0.30%(-0.170)#7,008 |
| 79. | Chattanooga | 0.13% | 0.16%(-0.028)#79 | 0.30%(-0.176)#7,105 |
| 80. | New Johnsonville | 0.11% | 0.16%(-0.047)#80 | 0.30%(-0.195)#7,355 |
| 81. | Fairfield Glade | 0.11% | 0.16%(-0.048)#81 | 0.30%(-0.196)#7,362 |
| 82. | Elizabethton | 0.10% | 0.16%(-0.051)#82 | 0.30%(-0.199)#7,397 |
| 83. | Cookeville | 0.10% | 0.16%(-0.053)#83 | 0.30%(-0.201)#7,417 |
| 84. | Bristol | 0.10% | 0.16%(-0.053)#84 | 0.30%(-0.201)#7,425 |
| 85. | Livingston | 0.10% | 0.16%(-0.054)#85 | 0.30%(-0.202)#7,429 |
| 86. | Lakeland | 0.10% | 0.16%(-0.054)#86 | 0.30%(-0.202)#7,439 |
| 87. | Hendersonville | 0.10% | 0.16%(-0.055)#87 | 0.30%(-0.203)#7,448 |
| 88. | Kingston | 0.10% | 0.16%(-0.055)#88 | 0.30%(-0.204)#7,452 |
| 89. | Lynchburg | 0.091% | 0.16%(-0.064)#89 | 0.30%(-0.212)#7,559 |
| 90. | Murfreesboro | 0.087% | 0.16%(-0.069)#90 | 0.30%(-0.217)#7,627 |
| 91. | Mount Juliet | 0.086% | 0.16%(-0.070)#91 | 0.30%(-0.218)#7,641 |
| 92. | Morristown | 0.085% | 0.16%(-0.071)#92 | 0.30%(-0.219)#7,655 |
| 93. | Pigeon Forge | 0.079% | 0.16%(-0.077)#93 | 0.30%(-0.225)#7,740 |
| 94. | Spring Hill | 0.064% | 0.16%(-0.091)#94 | 0.30%(-0.239)#7,927 |
| 95. | Jackson | 0.056% | 0.16%(-0.100)#95 | 0.30%(-0.248)#8,014 |
| 96. | Portland | 0.030% | 0.16%(-0.125)#96 | 0.30%(-0.273)#8,282 |
| 97. | Springfield | 0.016% | 0.16%(-0.140)#97 | 0.30%(-0.288)#8,375 |
Common Questions
What are the Top 10 Cities with the Highest Percentage of Eastern European Population in Tennessee?
Top 10 Cities with the Highest Percentage of Eastern European Population in Tennessee are:
#1
6.34%
#2
2.07%
#3
1.29%
#4
1.08%
#5
0.92%
#6
0.91%
#7
0.89%
#8
0.81%
#9
0.75%
#10
0.70%
What city has the Highest Percentage of Eastern European Population in Tennessee?
Graball has the Highest Percentage of Eastern European Population in Tennessee with 6.34%.
What is the Percentage of Eastern European Population in the State of Tennessee?
Percentage of Eastern European Population in Tennessee is 0.16%.
What is the Percentage of Eastern European Population in the United States?
Percentage of Eastern European Population in the United States is 0.30%.