Cities with the Highest Percentage of Eastern European Population in Delaware
RELATED REPORTS & OPTIONS
Eastern European
Delaware
Compare Cities
Map of Cities with the Highest Percentage of Eastern European Population in Delaware
0.00%
2.50%
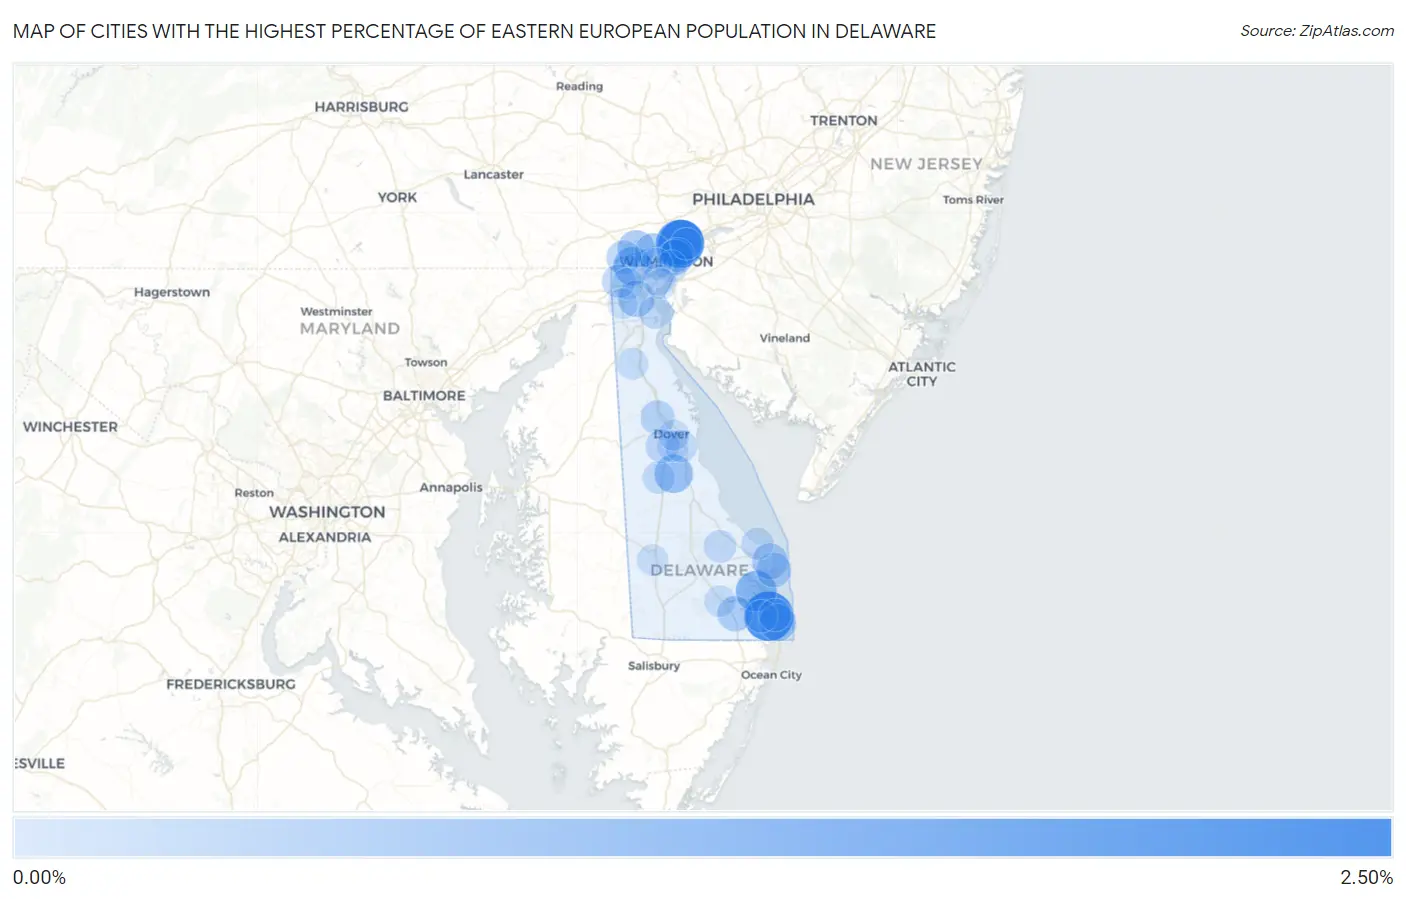
Cities with the Highest Percentage of Eastern European Population in Delaware
| City | Eastern European | vs State | vs National | |
| 1. | Ocean View | 2.29% | 0.30%(+1.99)#1 | 0.30%(+1.99)#557 |
| 2. | Ardencroft | 2.11% | 0.30%(+1.80)#2 | 0.30%(+1.80)#645 |
| 3. | Ardentown | 1.79% | 0.30%(+1.49)#3 | 0.30%(+1.49)#818 |
| 4. | Long Neck | 1.24% | 0.30%(+0.940)#4 | 0.30%(+0.937)#1,297 |
| 5. | Riverview | 0.97% | 0.30%(+0.669)#5 | 0.30%(+0.665)#1,751 |
| 6. | Pike Creek Valley | 0.94% | 0.30%(+0.643)#6 | 0.30%(+0.639)#1,813 |
| 7. | South Bethany | 0.82% | 0.30%(+0.516)#7 | 0.30%(+0.513)#2,131 |
| 8. | Hockessin | 0.79% | 0.30%(+0.492)#8 | 0.30%(+0.489)#2,194 |
| 9. | Bear | 0.72% | 0.30%(+0.424)#9 | 0.30%(+0.420)#2,417 |
| 10. | Rehoboth Beach | 0.66% | 0.30%(+0.363)#10 | 0.30%(+0.359)#2,618 |
| 11. | Greenville | 0.64% | 0.30%(+0.337)#11 | 0.30%(+0.334)#2,714 |
| 12. | Edgemoor | 0.63% | 0.30%(+0.332)#12 | 0.30%(+0.328)#2,734 |
| 13. | Dagsboro | 0.60% | 0.30%(+0.298)#13 | 0.30%(+0.294)#2,891 |
| 14. | Dewey Beach | 0.56% | 0.30%(+0.257)#14 | 0.30%(+0.253)#3,061 |
| 15. | Cheswold | 0.49% | 0.30%(+0.188)#15 | 0.30%(+0.184)#3,404 |
| 16. | North Star | 0.48% | 0.30%(+0.178)#16 | 0.30%(+0.174)#3,472 |
| 17. | Bellefonte | 0.46% | 0.30%(+0.158)#17 | 0.30%(+0.155)#3,583 |
| 18. | Newark | 0.39% | 0.30%(+0.091)#18 | 0.30%(+0.088)#4,012 |
| 19. | Wyoming | 0.37% | 0.30%(+0.070)#19 | 0.30%(+0.067)#4,190 |
| 20. | Millville | 0.29% | 0.30%(-0.008)#20 | 0.30%(-0.011)#4,925 |
| 21. | Bethany Beach | 0.28% | 0.30%(-0.018)#21 | 0.30%(-0.022)#5,056 |
| 22. | Milton | 0.27% | 0.30%(-0.032)#22 | 0.30%(-0.035)#5,242 |
| 23. | Felton | 0.26% | 0.30%(-0.036)#23 | 0.30%(-0.040)#5,302 |
| 24. | Delaware City | 0.26% | 0.30%(-0.042)#24 | 0.30%(-0.045)#5,375 |
| 25. | Dover Base Housing | 0.25% | 0.30%(-0.055)#25 | 0.30%(-0.058)#5,528 |
| 26. | Lewes | 0.24% | 0.30%(-0.061)#26 | 0.30%(-0.064)#5,583 |
| 27. | Wilmington | 0.21% | 0.30%(-0.086)#27 | 0.30%(-0.090)#5,884 |
| 28. | Millsboro | 0.19% | 0.30%(-0.111)#28 | 0.30%(-0.115)#6,222 |
| 29. | Townsend | 0.18% | 0.30%(-0.117)#29 | 0.30%(-0.120)#6,309 |
| 30. | Elsmere | 0.18% | 0.30%(-0.123)#30 | 0.30%(-0.126)#6,377 |
| 31. | Brookside | 0.17% | 0.30%(-0.126)#31 | 0.30%(-0.129)#6,413 |
| 32. | Bridgeville | 0.15% | 0.30%(-0.146)#32 | 0.30%(-0.149)#6,712 |
| 33. | Highland Acres | 0.15% | 0.30%(-0.146)#33 | 0.30%(-0.150)#6,716 |
| 34. | Claymont | 0.15% | 0.30%(-0.153)#34 | 0.30%(-0.157)#6,826 |
| 35. | Wilmington Manor | 0.13% | 0.30%(-0.167)#35 | 0.30%(-0.171)#7,019 |
| 36. | Dover | 0.12% | 0.30%(-0.182)#36 | 0.30%(-0.185)#7,215 |
| 37. | New Castle | 0.11% | 0.30%(-0.192)#37 | 0.30%(-0.195)#7,351 |
| 38. | Glasgow | 0.071% | 0.30%(-0.229)#38 | 0.30%(-0.232)#7,837 |
1
Common Questions
What are the Top 10 Cities with the Highest Percentage of Eastern European Population in Delaware?
Top 10 Cities with the Highest Percentage of Eastern European Population in Delaware are:
#1
2.29%
#2
2.11%
#3
1.79%
#4
1.24%
#5
0.97%
#6
0.94%
#7
0.82%
#8
0.79%
#9
0.72%
#10
0.66%
What city has the Highest Percentage of Eastern European Population in Delaware?
Ocean View has the Highest Percentage of Eastern European Population in Delaware with 2.29%.
What is the Percentage of Eastern European Population in the State of Delaware?
Percentage of Eastern European Population in Delaware is 0.30%.
What is the Percentage of Eastern European Population in the United States?
Percentage of Eastern European Population in the United States is 0.30%.