Cities with the Highest Percentage of Eastern European Population in Michigan
RELATED REPORTS & OPTIONS
Eastern European
Michigan
Compare Cities
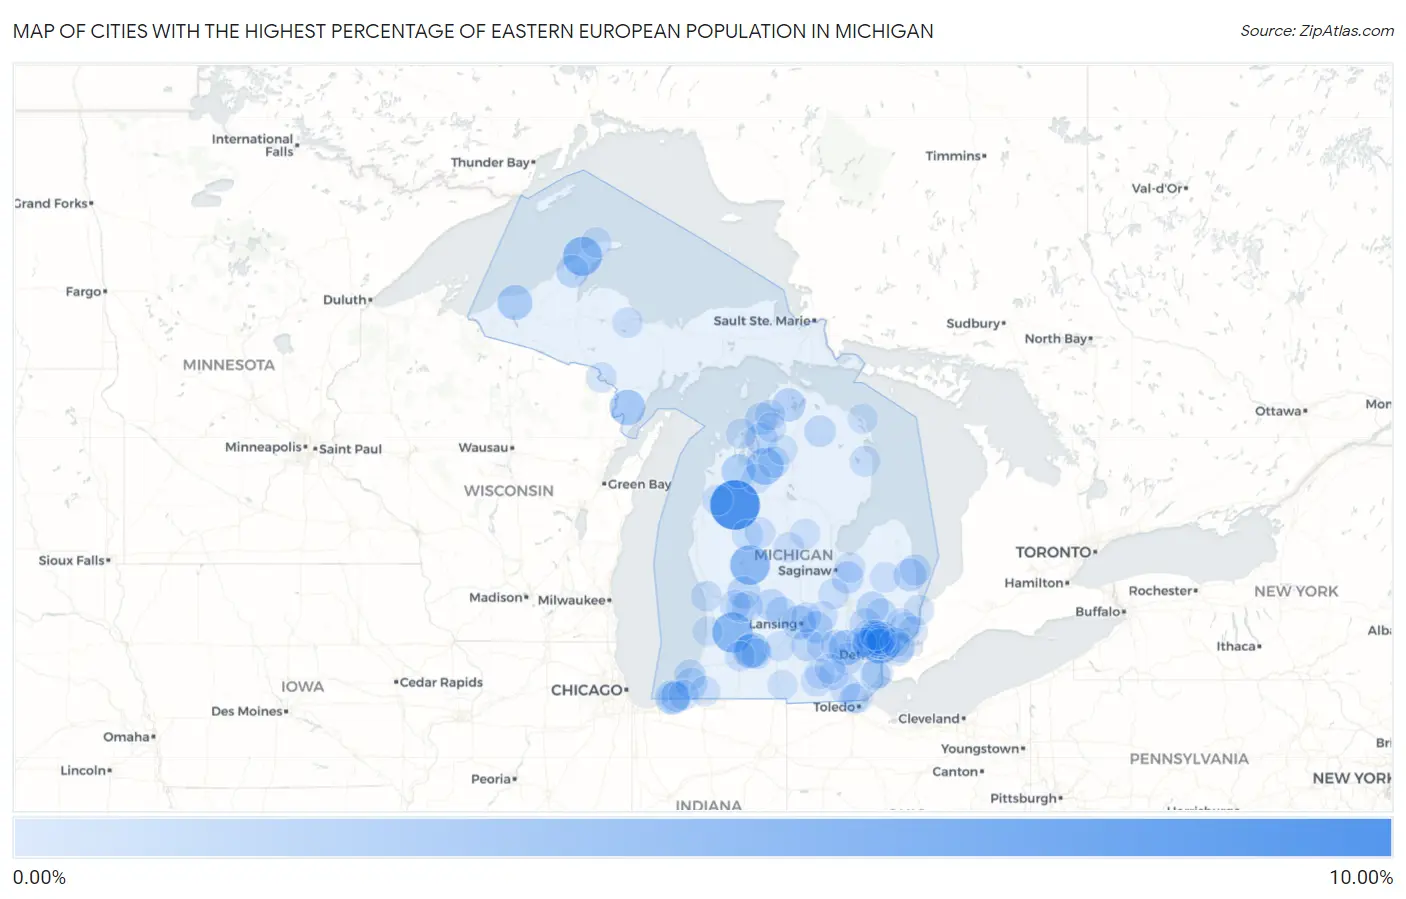
Map of Cities with the Highest Percentage of Eastern European Population in Michigan
0.00%
10.00%
Cities with the Highest Percentage of Eastern European Population in Michigan
| City | Eastern European | vs State | vs National | |
| 1. | Caberfae | 9.72% | 0.29%(+9.43)#1 | 0.30%(+9.42)#49 |
| 2. | Huntington Woods | 6.08% | 0.29%(+5.79)#2 | 0.30%(+5.78)#103 |
| 3. | Hopkins | 5.23% | 0.29%(+4.94)#3 | 0.30%(+4.93)#142 |
| 4. | Morley | 4.93% | 0.29%(+4.64)#4 | 0.30%(+4.63)#162 |
| 5. | Ahmeek | 4.60% | 0.29%(+4.31)#5 | 0.30%(+4.29)#192 |
| 6. | Kalkaska | 3.67% | 0.29%(+3.38)#6 | 0.30%(+3.36)#277 |
| 7. | Daggett | 3.00% | 0.29%(+2.71)#7 | 0.30%(+2.70)#377 |
| 8. | Bingham Farms | 2.90% | 0.29%(+2.61)#8 | 0.30%(+2.59)#398 |
| 9. | Whitmore Lake | 2.87% | 0.29%(+2.58)#9 | 0.30%(+2.57)#402 |
| 10. | South Gull Lake | 2.71% | 0.29%(+2.42)#10 | 0.30%(+2.41)#433 |
| 11. | White Pine | 2.65% | 0.29%(+2.36)#11 | 0.30%(+2.35)#448 |
| 12. | Michiana | 2.46% | 0.29%(+2.17)#12 | 0.30%(+2.15)#501 |
| 13. | Richland | 2.35% | 0.29%(+2.06)#13 | 0.30%(+2.05)#539 |
| 14. | Edgemont Park | 2.29% | 0.29%(+2.00)#14 | 0.30%(+1.99)#558 |
| 15. | Chums Corner | 2.29% | 0.29%(+2.00)#15 | 0.30%(+1.98)#563 |
| 16. | Brutus | 1.90% | 0.29%(+1.61)#16 | 0.30%(+1.59)#758 |
| 17. | Lake Leann | 1.87% | 0.29%(+1.58)#17 | 0.30%(+1.56)#776 |
| 18. | Applegate | 1.72% | 0.29%(+1.43)#18 | 0.30%(+1.41)#855 |
| 19. | Leslie | 1.67% | 0.29%(+1.38)#19 | 0.30%(+1.37)#879 |
| 20. | Rockford | 1.63% | 0.29%(+1.34)#20 | 0.30%(+1.32)#913 |
| 21. | Houghton | 1.63% | 0.29%(+1.34)#21 | 0.30%(+1.32)#914 |
| 22. | Williamston | 1.60% | 0.29%(+1.31)#22 | 0.30%(+1.30)#937 |
| 23. | Charlevoix | 1.50% | 0.29%(+1.21)#23 | 0.30%(+1.19)#1,024 |
| 24. | Ionia | 1.47% | 0.29%(+1.18)#24 | 0.30%(+1.16)#1,049 |
| 25. | Central Lake | 1.47% | 0.29%(+1.18)#25 | 0.30%(+1.16)#1,050 |
| 26. | Metamora | 1.45% | 0.29%(+1.17)#26 | 0.30%(+1.15)#1,059 |
| 27. | Frankenmuth | 1.38% | 0.29%(+1.09)#27 | 0.30%(+1.08)#1,125 |
| 28. | Baroda | 1.34% | 0.29%(+1.05)#28 | 0.30%(+1.04)#1,179 |
| 29. | Ann Arbor | 1.31% | 0.29%(+1.02)#29 | 0.30%(+1.00)#1,211 |
| 30. | Village Of Clarkston | 1.29% | 0.29%(+1.00)#30 | 0.30%(+0.987)#1,232 |
| 31. | Canada Creek Ranch | 1.27% | 0.29%(+0.986)#31 | 0.30%(+0.970)#1,253 |
| 32. | Grosse Pointe Farms | 1.26% | 0.29%(+0.970)#32 | 0.30%(+0.954)#1,269 |
| 33. | Birmingham | 1.25% | 0.29%(+0.963)#33 | 0.30%(+0.948)#1,283 |
| 34. | Portland | 1.18% | 0.29%(+0.891)#34 | 0.30%(+0.876)#1,382 |
| 35. | Port Sanilac | 1.14% | 0.29%(+0.848)#35 | 0.30%(+0.833)#1,439 |
| 36. | Franklin | 1.13% | 0.29%(+0.843)#36 | 0.30%(+0.827)#1,449 |
| 37. | Manistee Lake | 1.09% | 0.29%(+0.805)#37 | 0.30%(+0.789)#1,522 |
| 38. | Shoreham | 1.09% | 0.29%(+0.798)#38 | 0.30%(+0.782)#1,532 |
| 39. | Grand Beach | 1.06% | 0.29%(+0.773)#39 | 0.30%(+0.757)#1,577 |
| 40. | Gibraltar | 1.05% | 0.29%(+0.762)#40 | 0.30%(+0.747)#1,590 |
| 41. | Augusta | 0.94% | 0.29%(+0.654)#41 | 0.30%(+0.639)#1,817 |
| 42. | Orchard Lake Village | 0.94% | 0.29%(+0.651)#42 | 0.30%(+0.636)#1,824 |
| 43. | Leonard | 0.93% | 0.29%(+0.641)#43 | 0.30%(+0.625)#1,840 |
| 44. | New Haven | 0.90% | 0.29%(+0.615)#44 | 0.30%(+0.599)#1,889 |
| 45. | Reed City | 0.89% | 0.29%(+0.599)#45 | 0.30%(+0.583)#1,930 |
| 46. | New Buffalo | 0.88% | 0.29%(+0.593)#46 | 0.30%(+0.577)#1,937 |
| 47. | Lost Lake Woods | 0.87% | 0.29%(+0.581)#47 | 0.30%(+0.566)#1,974 |
| 48. | New Baltimore | 0.83% | 0.29%(+0.546)#48 | 0.30%(+0.531)#2,067 |
| 49. | Madison Heights | 0.83% | 0.29%(+0.539)#49 | 0.30%(+0.524)#2,090 |
| 50. | Farmington Hills | 0.82% | 0.29%(+0.532)#50 | 0.30%(+0.516)#2,120 |
| 51. | Beverly Hills | 0.82% | 0.29%(+0.527)#51 | 0.30%(+0.511)#2,134 |
| 52. | Forest Hills | 0.81% | 0.29%(+0.521)#52 | 0.30%(+0.505)#2,154 |
| 53. | New Lothrop | 0.81% | 0.29%(+0.517)#53 | 0.30%(+0.501)#2,163 |
| 54. | Stockbridge | 0.79% | 0.29%(+0.506)#54 | 0.30%(+0.491)#2,188 |
| 55. | Temperance | 0.79% | 0.29%(+0.501)#55 | 0.30%(+0.486)#2,206 |
| 56. | South Rockwood | 0.79% | 0.29%(+0.499)#56 | 0.30%(+0.484)#2,211 |
| 57. | Ferrysburg | 0.78% | 0.29%(+0.489)#57 | 0.30%(+0.474)#2,242 |
| 58. | Manitou Beach Devils Lake | 0.77% | 0.29%(+0.487)#58 | 0.30%(+0.471)#2,250 |
| 59. | Marysville | 0.77% | 0.29%(+0.484)#59 | 0.30%(+0.468)#2,260 |
| 60. | Pleasant Ridge | 0.77% | 0.29%(+0.478)#60 | 0.30%(+0.463)#2,280 |
| 61. | Brethren | 0.77% | 0.29%(+0.477)#61 | 0.30%(+0.462)#2,285 |
| 62. | Deerfield | 0.76% | 0.29%(+0.475)#62 | 0.30%(+0.460)#2,290 |
| 63. | Walker | 0.76% | 0.29%(+0.475)#63 | 0.30%(+0.459)#2,294 |
| 64. | Bay Shore | 0.75% | 0.29%(+0.462)#64 | 0.30%(+0.447)#2,334 |
| 65. | Evart | 0.75% | 0.29%(+0.459)#65 | 0.30%(+0.444)#2,340 |
| 66. | Eagle Harbor | 0.75% | 0.29%(+0.458)#66 | 0.30%(+0.443)#2,345 |
| 67. | Rosebush | 0.74% | 0.29%(+0.451)#67 | 0.30%(+0.435)#2,371 |
| 68. | Marlette | 0.72% | 0.29%(+0.435)#68 | 0.30%(+0.420)#2,419 |
| 69. | Farmington | 0.72% | 0.29%(+0.435)#69 | 0.30%(+0.419)#2,427 |
| 70. | Morrice | 0.72% | 0.29%(+0.433)#70 | 0.30%(+0.417)#2,436 |
| 71. | Pinckney | 0.72% | 0.29%(+0.430)#71 | 0.30%(+0.414)#2,447 |
| 72. | Northport | 0.70% | 0.29%(+0.414)#72 | 0.30%(+0.399)#2,487 |
| 73. | Pearl Beach | 0.70% | 0.29%(+0.410)#73 | 0.30%(+0.394)#2,500 |
| 74. | Clinton | 0.68% | 0.29%(+0.395)#74 | 0.30%(+0.379)#2,553 |
| 75. | Bath | 0.67% | 0.29%(+0.382)#75 | 0.30%(+0.367)#2,594 |
| 76. | Iron Mountain | 0.66% | 0.29%(+0.377)#76 | 0.30%(+0.361)#2,611 |
| 77. | Manchester | 0.66% | 0.29%(+0.375)#77 | 0.30%(+0.360)#2,616 |
| 78. | Three Oaks | 0.66% | 0.29%(+0.375)#78 | 0.30%(+0.359)#2,619 |
| 79. | Vineyard Lake | 0.65% | 0.29%(+0.366)#79 | 0.30%(+0.350)#2,657 |
| 80. | Village Of Grosse Pointe Shores | 0.65% | 0.29%(+0.363)#80 | 0.30%(+0.348)#2,664 |
| 81. | Negaunee | 0.65% | 0.29%(+0.357)#81 | 0.30%(+0.341)#2,681 |
| 82. | Westwood | 0.64% | 0.29%(+0.355)#82 | 0.30%(+0.339)#2,688 |
| 83. | Niles | 0.63% | 0.29%(+0.344)#83 | 0.30%(+0.328)#2,739 |
| 84. | Reese | 0.62% | 0.29%(+0.327)#84 | 0.30%(+0.312)#2,818 |
| 85. | Royal Oak | 0.59% | 0.29%(+0.304)#85 | 0.30%(+0.289)#2,907 |
| 86. | Fife Lake | 0.59% | 0.29%(+0.304)#86 | 0.30%(+0.288)#2,911 |
| 87. | Beaverton | 0.59% | 0.29%(+0.298)#87 | 0.30%(+0.283)#2,928 |
| 88. | Lakes Of The North | 0.58% | 0.29%(+0.294)#88 | 0.30%(+0.278)#2,955 |
| 89. | Lambertville | 0.58% | 0.29%(+0.291)#89 | 0.30%(+0.275)#2,967 |
| 90. | Olivet | 0.56% | 0.29%(+0.276)#90 | 0.30%(+0.260)#3,024 |
| 91. | Oak Park | 0.56% | 0.29%(+0.275)#91 | 0.30%(+0.259)#3,028 |
| 92. | Clawson | 0.56% | 0.29%(+0.274)#92 | 0.30%(+0.258)#3,033 |
| 93. | Novi | 0.56% | 0.29%(+0.272)#93 | 0.30%(+0.256)#3,040 |
| 94. | Presque Isle Harbor | 0.56% | 0.29%(+0.271)#94 | 0.30%(+0.256)#3,044 |
| 95. | St Clair Shores | 0.55% | 0.29%(+0.259)#95 | 0.30%(+0.244)#3,110 |
| 96. | Bloomfield Hills | 0.55% | 0.29%(+0.257)#96 | 0.30%(+0.241)#3,121 |
| 97. | East Grand Rapids | 0.54% | 0.29%(+0.256)#97 | 0.30%(+0.241)#3,124 |
| 98. | Advance | 0.54% | 0.29%(+0.251)#98 | 0.30%(+0.235)#3,151 |
| 99. | Quincy | 0.54% | 0.29%(+0.249)#99 | 0.30%(+0.233)#3,161 |
| 100. | Douglas | 0.53% | 0.29%(+0.240)#100 | 0.30%(+0.224)#3,203 |
Common Questions
What are the Top 10 Cities with the Highest Percentage of Eastern European Population in Michigan?
Top 10 Cities with the Highest Percentage of Eastern European Population in Michigan are:
#1
9.72%
#2
6.08%
#3
5.23%
#4
4.93%
#5
4.60%
#6
3.67%
#7
3.00%
#8
2.90%
#9
2.87%
#10
2.71%
What city has the Highest Percentage of Eastern European Population in Michigan?
Caberfae has the Highest Percentage of Eastern European Population in Michigan with 9.72%.
What is the Percentage of Eastern European Population in the State of Michigan?
Percentage of Eastern European Population in Michigan is 0.29%.
What is the Percentage of Eastern European Population in the United States?
Percentage of Eastern European Population in the United States is 0.30%.