Cities with the Highest Percentage of Eastern European Population in Idaho

RELATED REPORTS & OPTIONS

Eastern European
Population
Families and Households
Female Fertility
Female Fertility (Unmarried)
Race (Community Size)
Race (Percentage)
Ancestry (Community Size)
AfghanAfricanAlaska NativeAlaskan AthabascanAlbanianAleutAlsatianAmericanApacheArabArapahoArgentineanArmenianAssyrian / Chaldean / SyriacAustralianAustrianBahamianBangladeshiBarbadianBasqueBelgianBelizeanBermudanBhutaneseBlackfeetBolivianBrazilianBritishBritish West IndianBulgarianBurmeseCajunCambodianCanadianCape VerdeanCarpatho RusynCelticCentral AmericanCentral American IndianCherokeeCheyenneChickasawChileanChineseChippewaChoctawColombianColvilleComancheCosta RicanCreeCreekCroatianCrowCubanCypriotCzechCzechoslovakianDanishDelawareDominicanDutchDutch West IndianEastern EuropeanEcuadorianEgyptianEnglishEstonianEthiopianEuropeanFijianFilipinoFinnishFrenchFrench American IndianFrench CanadianGermanGerman RussianGhanaianGreekGuamanian / ChamorroGuatemalanGuyaneseHaitianHmongHonduranHopiHoumaHungarianIcelanderIndian (Asian)IndonesianInupiatIranianIraqiIrishIroquoisIsraeliItalianJamaicanJapaneseJordanianKenyanKiowaKoreanLaotianLatvianLebaneseLiberianLithuanianLumbeeLuxembourgerMacedonianMalaysianMalteseMarshalleseMenomineeMexicanMexican American IndianMongolianMoroccanNative HawaiianNavajoNepaleseNew ZealanderNicaraguanNigerianNorthern EuropeanNorwegianOkinawanOsageOttawaPaiutePakistaniPalestinianPanamanianParaguayanPennsylvania GermanPeruvianPimaPolishPortuguesePotawatomiPuebloPuerto RicanPuget Sound SalishRomanianRussianSalvadoranSamoanScandinavianScotch-IrishScottishSeminoleSenegaleseSerbianShoshoneSierra LeoneanSiouxSlavicSlovakSloveneSomaliSouth AfricanSouth AmericanSouth American IndianSoviet UnionSpaniardSpanishSpanish AmericanSpanish American IndianSri LankanSubsaharan AfricanSudaneseSwedishSwissSyrianTaiwaneseThaiTlingit-HaidaTohono O'OdhamTonganTrinidadian and TobagonianTsimshianTurkishU.S. Virgin IslanderUgandanUkrainianUruguayanUteVenezuelanVietnameseWelshWest IndianYakamaYaquiYugoslavianYumanYup'ikZimbabwean
Ancestry (Percentage)
AfghanAfricanAlaska NativeAlaskan AthabascanAlbanianAleutAlsatianAmericanApacheArabArapahoArgentineanArmenianAssyrian / Chaldean / SyriacAustralianAustrianBahamianBangladeshiBarbadianBasqueBelgianBelizeanBermudanBhutaneseBlackfeetBolivianBrazilianBritishBritish West IndianBulgarianBurmeseCajunCambodianCanadianCape VerdeanCarpatho RusynCelticCentral AmericanCentral American IndianCherokeeCheyenneChickasawChileanChineseChippewaChoctawColombianColvilleComancheCosta RicanCreeCreekCroatianCrowCubanCypriotCzechCzechoslovakianDanishDelawareDominicanDutchDutch West IndianEastern EuropeanEcuadorianEgyptianEnglishEstonianEthiopianEuropeanFijianFilipinoFinnishFrenchFrench American IndianFrench CanadianGermanGerman RussianGhanaianGreekGuamanian / ChamorroGuatemalanGuyaneseHaitianHmongHonduranHopiHoumaHungarianIcelanderIndian (Asian)IndonesianInupiatIranianIraqiIrishIroquoisIsraeliItalianJamaicanJapaneseJordanianKenyanKiowaKoreanLaotianLatvianLebaneseLiberianLithuanianLumbeeLuxembourgerMacedonianMalaysianMalteseMarshalleseMenomineeMexicanMexican American IndianMongolianMoroccanNative HawaiianNavajoNepaleseNew ZealanderNicaraguanNigerianNorthern EuropeanNorwegianOkinawanOsageOttawaPaiutePakistaniPalestinianPanamanianParaguayanPennsylvania GermanPeruvianPimaPolishPortuguesePotawatomiPuebloPuerto RicanPuget Sound SalishRomanianRussianSalvadoranSamoanScandinavianScotch-IrishScottishSeminoleSenegaleseSerbianShoshoneSierra LeoneanSiouxSlavicSlovakSloveneSomaliSouth AfricanSouth AmericanSouth American IndianSoviet UnionSpaniardSpanishSpanish AmericanSpanish American IndianSri LankanSubsaharan AfricanSudaneseSwedishSwissSyrianTaiwaneseThaiTlingit-HaidaTohono O'OdhamTonganTrinidadian and TobagonianTsimshianTurkishU.S. Virgin IslanderUgandanUkrainianUruguayanUteVenezuelanVietnameseWelshWest IndianYakamaYaquiYugoslavianYumanYup'ikZimbabwean
Immigrant Origin (Total)
AfghanistanAfricaAlbaniaArgentinaArmeniaAsiaAustraliaAustriaAzoresBahamasBangladeshBarbadosBelarusBelgiumBelizeBoliviaBosnia and HerzegovinaBrazilBulgariaBurma / MyanmarCabo VerdeCambodiaCameroonCanadaCaribbeanCentral AmericaChileChinaColombiaCongoCosta RicaCroatiaCubaCzechoslovakiaDenmarkDominicaDominican RepublicEastern AfricaEastern AsiaEastern EuropeEcuadorEgyptEl SalvadorEnglandEritreaEthiopiaEuropeFijiFranceGermanyGhanaGreeceGrenadaGuatemalaGuyanaHaitiHondurasHong KongHungaryIndiaIndonesiaIranIraqIrelandIsraelItalyJamaicaJapanJordanKazakhstanKenyaKoreaKuwaitLaosLatin AmericaLatviaLebanonLiberiaLithuaniaMalaysiaMexicoMicronesiaMiddle AfricaMoldovaMoroccoNepalNetherlandsNicaraguaNigeriaNorth MacedoniaNorthern AfricaNorthern EuropeNorwayOceaniaPakistanPanamaPeruPhilippinesPolandPortugalRomaniaRussiaSaudi ArabiaScotlandSenegalSerbiaSierra LeoneSingaporeSomaliaSouth AfricaSouth AmericaSouth Central AsiaSouth Eastern AsiaSouthern EuropeSpainSri LankaSt. Vincent and the GrenadinesSudanSwedenSwitzerlandSyriaTaiwanThailandTrinidad and TobagoTurkeyUgandaUkraineUruguayUzbekistanVenezuelaVietnamWest IndiesWestern AfricaWestern AsiaWestern EuropeYemenZaireZimbabwe
Immigrant Origin (Percentage)
AfghanistanAfricaAlbaniaArgentinaArmeniaAsiaAustraliaAustriaAzoresBahamasBangladeshBarbadosBelarusBelgiumBelizeBoliviaBosnia and HerzegovinaBrazilBulgariaBurma / MyanmarCabo VerdeCambodiaCameroonCanadaCaribbeanCentral AmericaChileChinaColombiaCongoCosta RicaCroatiaCubaCzechoslovakiaDenmarkDominicaDominican RepublicEastern AfricaEastern AsiaEastern EuropeEcuadorEgyptEl SalvadorEnglandEritreaEthiopiaEuropeFijiFranceGermanyGhanaGreeceGrenadaGuatemalaGuyanaHaitiHondurasHong KongHungaryIndiaIndonesiaIranIraqIrelandIsraelItalyJamaicaJapanJordanKazakhstanKenyaKoreaKuwaitLaosLatin AmericaLatviaLebanonLiberiaLithuaniaMalaysiaMexicoMicronesiaMiddle AfricaMoldovaMoroccoNepalNetherlandsNicaraguaNigeriaNorth MacedoniaNorthern AfricaNorthern EuropeNorwayOceaniaPakistanPanamaPeruPhilippinesPolandPortugalRomaniaRussiaSaudi ArabiaScotlandSenegalSerbiaSierra LeoneSingaporeSomaliaSouth AfricaSouth AmericaSouth Central AsiaSouth Eastern AsiaSouthern EuropeSpainSri LankaSt. Vincent and the GrenadinesSudanSwedenSwitzerlandSyriaTaiwanThailandTrinidad and TobagoTurkeyUgandaUkraineUruguayUzbekistanVenezuelaVietnamWest IndiesWestern AfricaWestern AsiaWestern EuropeYemenZaireZimbabwe
Income
Income (Families)
Income (Households)
Poverty
Poverty (Families)
Unemployment
Employment Occupations
Employment Industries
Employer Class
Commute Time
Commute Means
School Enrollment
Education by Degree Field
Occupancy
Finances
Physical Characteristics
Idaho
Compare Cities
Comparison Subject

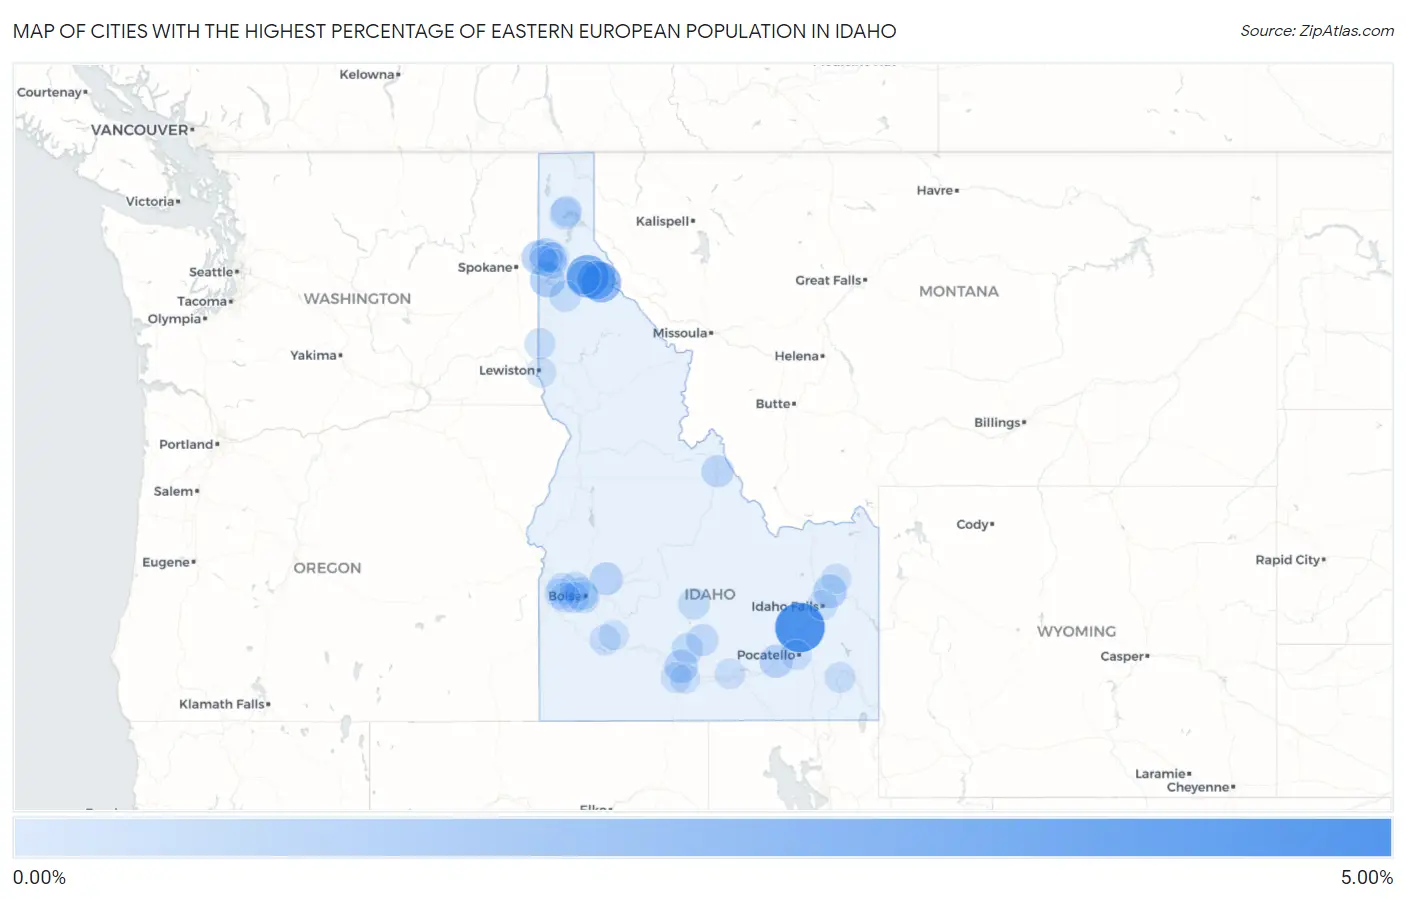
Map of Cities with the Highest Percentage of Eastern European Population in Idaho

0.00%
5.00%
Cities with the Highest Percentage of Eastern European Population in Idaho Map

Cities with the Highest Percentage of Eastern European Population in Idaho

City Eastern European vs State vs National
1.Moreland4.17%0.15%(+4.02)#10.30%(+3.87)#223
2.Smelterville2.61%0.15%(+2.46)#20.30%(+2.31)#462
3.Wallace2.03%0.15%(+1.88)#30.30%(+1.73)#688
4.Osburn1.85%0.15%(+1.70)#40.30%(+1.54)#789
5.Rockford Bay0.98%0.15%(+0.832)#50.30%(+0.677)#1,723
6.Hauser0.86%0.15%(+0.708)#60.30%(+0.552)#2,008
7.Pinehurst0.75%0.15%(+0.605)#70.30%(+0.449)#2,327
8.Rigby0.75%0.15%(+0.598)#80.30%(+0.442)#2,348
9.Rathdrum0.72%0.15%(+0.574)#90.30%(+0.418)#2,429
10.Jerome0.65%0.15%(+0.501)#100.30%(+0.345)#2,671
11.American Falls0.63%0.15%(+0.486)#110.30%(+0.330)#2,728
12.Idaho City0.59%0.15%(+0.446)#120.30%(+0.291)#2,903
13.Garden City0.51%0.15%(+0.364)#130.30%(+0.208)#3,282
14.Salmon0.44%0.15%(+0.297)#140.30%(+0.141)#3,656
15.Richfield0.39%0.15%(+0.245)#150.30%(+0.089)#4,003
16.Boise City0.31%0.15%(+0.159)#160.30%(+0.003)#4,765
17.Sandpoint0.30%0.15%(+0.155)#170.30%(-0.000)#4,803
18.Shoshone0.30%0.15%(+0.148)#180.30%(-0.007)#4,875
19.Hailey0.29%0.15%(+0.144)#190.30%(-0.011)#4,927
20.Middleton0.29%0.15%(+0.143)#200.30%(-0.012)#4,941
21.St Maries0.29%0.15%(+0.143)#210.30%(-0.013)#4,945
22.Eagle0.28%0.15%(+0.136)#220.30%(-0.020)#5,014
23.Hayden Lake0.26%0.15%(+0.112)#230.30%(-0.044)#5,359
24.Moscow0.21%0.15%(+0.063)#240.30%(-0.093)#5,928
25.Meridian0.19%0.15%(+0.046)#250.30%(-0.110)#6,159
26.Caldwell0.19%0.15%(+0.040)#260.30%(-0.116)#6,245
27.Ponderay0.17%0.15%(+0.018)#270.30%(-0.138)#6,537
28.Mountain Home Afb0.16%0.15%(+0.009)#280.30%(-0.147)#6,671
29.Filer0.14%0.15%(-0.003)#290.30%(-0.159)#6,866
30.Grace0.14%0.15%(-0.006)#300.30%(-0.162)#6,911
31.Rupert0.12%0.15%(-0.033)#310.30%(-0.188)#7,257
32.Hayden0.11%0.15%(-0.033)#320.30%(-0.189)#7,271
33.Pocatello0.094%0.15%(-0.054)#330.30%(-0.210)#7,529
34.Idaho Falls0.075%0.15%(-0.073)#340.30%(-0.229)#7,795
35.Coeur D Alene0.064%0.15%(-0.084)#350.30%(-0.240)#7,931
36.Nampa0.062%0.15%(-0.086)#360.30%(-0.241)#7,943
37.Post Falls0.045%0.15%(-0.103)#370.30%(-0.259)#8,140
38.Mountain Home0.037%0.15%(-0.111)#380.30%(-0.266)#8,215
39.Rexburg0.034%0.15%(-0.114)#390.30%(-0.270)#8,247
40.Twin Falls0.021%0.15%(-0.127)#400.30%(-0.283)#8,349
41.Lewiston0.018%0.15%(-0.130)#410.30%(-0.286)#8,369

Common Questions

What are the Top 10 Cities with the Highest Percentage of Eastern European Population in Idaho?
Top 10 Cities with the Highest Percentage of Eastern European Population in Idaho are:
#1
4.17%
#2
2.61%
#3
2.03%
#4
1.85%
#5
0.98%
#6
0.86%
#7
0.75%
#8
0.75%
#9
0.72%
#10
0.65%
What city has the Highest Percentage of Eastern European Population in Idaho?
Moreland has the Highest Percentage of Eastern European Population in Idaho with 4.17%.
What is the Percentage of Eastern European Population in the State of Idaho?
Percentage of Eastern European Population in Idaho is 0.15%.
What is the Percentage of Eastern European Population in the United States?
Percentage of Eastern European Population in the United States is 0.30%.