Cities with the Highest Percentage of Eastern European Population in Ohio
RELATED REPORTS & OPTIONS
Eastern European
Ohio
Compare Cities
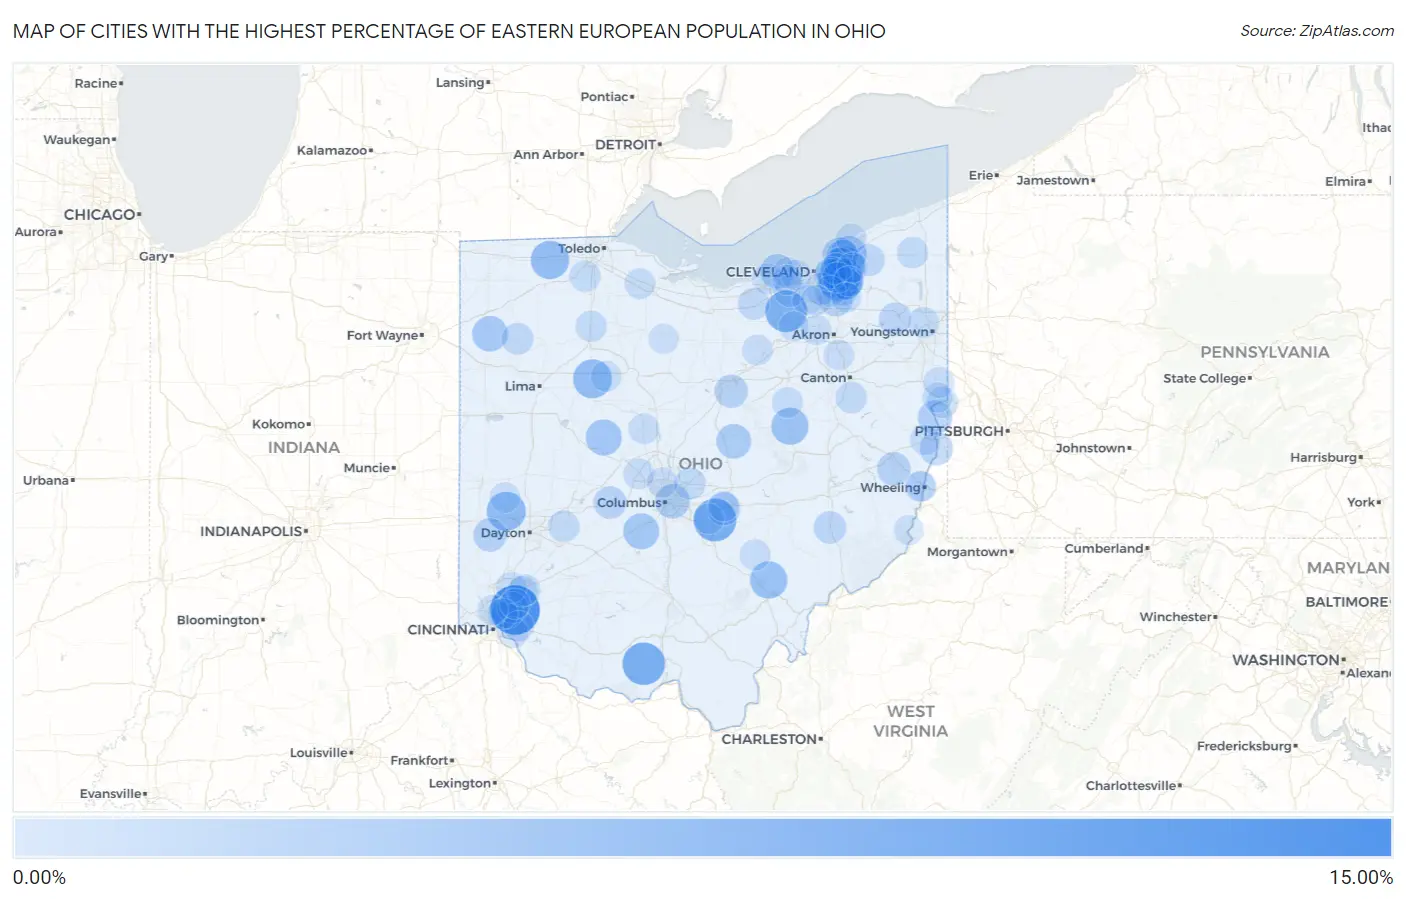
Map of Cities with the Highest Percentage of Eastern European Population in Ohio
0.00%
15.00%
Cities with the Highest Percentage of Eastern European Population in Ohio
| City | Eastern European | vs State | vs National | |
| 1. | Remington | 10.10% | 0.33%(+9.77)#1 | 0.30%(+9.79)#46 |
| 2. | Thurston | 6.76% | 0.33%(+6.44)#2 | 0.30%(+6.46)#84 |
| 3. | Otway | 6.67% | 0.33%(+6.34)#3 | 0.30%(+6.36)#87 |
| 4. | Valley City | 6.35% | 0.33%(+6.02)#4 | 0.30%(+6.05)#91 |
| 5. | Orange | 6.03% | 0.33%(+5.70)#5 | 0.30%(+5.73)#105 |
| 6. | Gates Mills | 5.24% | 0.33%(+4.91)#6 | 0.30%(+4.93)#141 |
| 7. | Phillipsburg | 5.03% | 0.33%(+4.70)#7 | 0.30%(+4.72)#152 |
| 8. | Moreland Hills | 4.94% | 0.33%(+4.62)#8 | 0.30%(+4.64)#160 |
| 9. | Dunkirk | 4.92% | 0.33%(+4.59)#9 | 0.30%(+4.62)#163 |
| 10. | Delta | 4.73% | 0.33%(+4.40)#10 | 0.30%(+4.42)#175 |
| 11. | Millfield | 4.26% | 0.33%(+3.94)#11 | 0.30%(+3.96)#216 |
| 12. | Lake Buckhorn | 4.11% | 0.33%(+3.79)#12 | 0.30%(+3.81)#229 |
| 13. | West Mansfield | 3.63% | 0.33%(+3.30)#13 | 0.30%(+3.32)#282 |
| 14. | Derby | 3.54% | 0.33%(+3.22)#14 | 0.30%(+3.24)#294 |
| 15. | Waite Hill | 3.43% | 0.33%(+3.10)#15 | 0.30%(+3.13)#310 |
| 16. | Broughton | 3.37% | 0.33%(+3.04)#16 | 0.30%(+3.07)#317 |
| 17. | Wickliffe | 3.08% | 0.33%(+2.75)#17 | 0.30%(+2.78)#363 |
| 18. | Gambier | 3.00% | 0.33%(+2.67)#18 | 0.30%(+2.70)#375 |
| 19. | Bexley | 2.95% | 0.33%(+2.63)#19 | 0.30%(+2.65)#386 |
| 20. | Avon Lake | 2.85% | 0.33%(+2.52)#20 | 0.30%(+2.54)#406 |
| 21. | Stratton | 2.72% | 0.33%(+2.40)#21 | 0.30%(+2.42)#429 |
| 22. | Pepper Pike | 2.54% | 0.33%(+2.21)#22 | 0.30%(+2.23)#477 |
| 23. | Guilford Lake | 2.51% | 0.33%(+2.18)#23 | 0.30%(+2.21)#484 |
| 24. | New Athens | 2.40% | 0.33%(+2.07)#24 | 0.30%(+2.10)#516 |
| 25. | Beachwood | 2.38% | 0.33%(+2.05)#25 | 0.30%(+2.07)#525 |
| 26. | West Alexandria | 2.36% | 0.33%(+2.03)#26 | 0.30%(+2.05)#534 |
| 27. | Mingo Junction | 2.33% | 0.33%(+2.00)#27 | 0.30%(+2.02)#544 |
| 28. | Lucas | 2.33% | 0.33%(+2.00)#28 | 0.30%(+2.02)#546 |
| 29. | Fairfield Beach | 2.32% | 0.33%(+1.99)#29 | 0.30%(+2.02)#548 |
| 30. | Solon | 2.32% | 0.33%(+1.99)#30 | 0.30%(+2.02)#549 |
| 31. | Willoughby Hills | 2.15% | 0.33%(+1.82)#31 | 0.30%(+1.84)#630 |
| 32. | Hunting Valley | 2.13% | 0.33%(+1.80)#32 | 0.30%(+1.82)#639 |
| 33. | Choctaw Lake | 2.06% | 0.33%(+1.74)#33 | 0.30%(+1.76)#671 |
| 34. | Macedonia | 2.06% | 0.33%(+1.73)#34 | 0.30%(+1.76)#674 |
| 35. | Ridgewood | 1.95% | 0.33%(+1.63)#35 | 0.30%(+1.65)#728 |
| 36. | Highland Heights | 1.95% | 0.33%(+1.63)#36 | 0.30%(+1.65)#729 |
| 37. | Belle Valley | 1.95% | 0.33%(+1.62)#37 | 0.30%(+1.64)#737 |
| 38. | Newton Falls | 1.91% | 0.33%(+1.58)#38 | 0.30%(+1.60)#754 |
| 39. | Independence | 1.83% | 0.33%(+1.50)#39 | 0.30%(+1.53)#797 |
| 40. | Blaine | 1.78% | 0.33%(+1.45)#40 | 0.30%(+1.47)#824 |
| 41. | Chardon | 1.73% | 0.33%(+1.41)#41 | 0.30%(+1.43)#843 |
| 42. | Bentleyville | 1.72% | 0.33%(+1.39)#42 | 0.30%(+1.41)#854 |
| 43. | Shaker Heights | 1.70% | 0.33%(+1.38)#43 | 0.30%(+1.40)#857 |
| 44. | Oberlin | 1.68% | 0.33%(+1.36)#44 | 0.30%(+1.38)#869 |
| 45. | Dupont | 1.60% | 0.33%(+1.28)#45 | 0.30%(+1.30)#932 |
| 46. | Yellow Springs | 1.55% | 0.33%(+1.22)#46 | 0.30%(+1.25)#967 |
| 47. | New Albany | 1.54% | 0.33%(+1.21)#47 | 0.30%(+1.24)#981 |
| 48. | Rossmoyne | 1.54% | 0.33%(+1.21)#48 | 0.30%(+1.23)#989 |
| 49. | East Liverpool | 1.52% | 0.33%(+1.20)#49 | 0.30%(+1.22)#1,000 |
| 50. | University Heights | 1.52% | 0.33%(+1.19)#50 | 0.30%(+1.21)#1,009 |
| 51. | East Sparta | 1.51% | 0.33%(+1.18)#51 | 0.30%(+1.20)#1,018 |
| 52. | Roaming Shores | 1.48% | 0.33%(+1.16)#52 | 0.30%(+1.18)#1,035 |
| 53. | Olmsted Falls | 1.45% | 0.33%(+1.13)#53 | 0.30%(+1.15)#1,060 |
| 54. | Lyndhurst | 1.42% | 0.33%(+1.09)#54 | 0.30%(+1.12)#1,080 |
| 55. | Van Buren | 1.38% | 0.33%(+1.05)#55 | 0.30%(+1.07)#1,132 |
| 56. | South Lebanon | 1.36% | 0.33%(+1.04)#56 | 0.30%(+1.06)#1,150 |
| 57. | Haskins | 1.36% | 0.33%(+1.03)#57 | 0.30%(+1.06)#1,153 |
| 58. | Walton Hills | 1.36% | 0.33%(+1.03)#58 | 0.30%(+1.05)#1,158 |
| 59. | Mcdonald | 1.30% | 0.33%(+0.971)#59 | 0.30%(+0.994)#1,224 |
| 60. | Forest | 1.24% | 0.33%(+0.910)#60 | 0.30%(+0.933)#1,304 |
| 61. | Shawnee | 1.22% | 0.33%(+0.890)#61 | 0.30%(+0.913)#1,334 |
| 62. | Forestville | 1.21% | 0.33%(+0.885)#62 | 0.30%(+0.909)#1,347 |
| 63. | Montgomery | 1.21% | 0.33%(+0.884)#63 | 0.30%(+0.907)#1,349 |
| 64. | New California | 1.20% | 0.33%(+0.878)#64 | 0.30%(+0.901)#1,355 |
| 65. | Lindsey | 1.20% | 0.33%(+0.878)#65 | 0.30%(+0.901)#1,356 |
| 66. | Brookside | 1.20% | 0.33%(+0.876)#66 | 0.30%(+0.899)#1,359 |
| 67. | Holmesville | 1.19% | 0.33%(+0.864)#67 | 0.30%(+0.887)#1,373 |
| 68. | Prospect | 1.18% | 0.33%(+0.857)#68 | 0.30%(+0.880)#1,376 |
| 69. | Sheffield | 1.18% | 0.33%(+0.857)#69 | 0.30%(+0.880)#1,377 |
| 70. | Cinnamon Lake | 1.17% | 0.33%(+0.842)#70 | 0.30%(+0.865)#1,400 |
| 71. | Lake Tomahawk | 1.16% | 0.33%(+0.832)#71 | 0.30%(+0.855)#1,415 |
| 72. | Four Bridges | 1.14% | 0.33%(+0.813)#72 | 0.30%(+0.836)#1,436 |
| 73. | Kings Mills | 1.12% | 0.33%(+0.795)#73 | 0.30%(+0.818)#1,464 |
| 74. | Mentor On The Lake | 1.10% | 0.33%(+0.778)#74 | 0.30%(+0.801)#1,498 |
| 75. | Green | 1.08% | 0.33%(+0.753)#75 | 0.30%(+0.776)#1,542 |
| 76. | Summerside | 1.06% | 0.33%(+0.736)#76 | 0.30%(+0.759)#1,571 |
| 77. | Amberley | 1.05% | 0.33%(+0.719)#77 | 0.30%(+0.742)#1,597 |
| 78. | Bay Village | 1.04% | 0.33%(+0.714)#78 | 0.30%(+0.737)#1,605 |
| 79. | Rocky River | 1.04% | 0.33%(+0.713)#79 | 0.30%(+0.736)#1,606 |
| 80. | North Royalton | 1.03% | 0.33%(+0.705)#80 | 0.30%(+0.728)#1,622 |
| 81. | Woodmere | 1.02% | 0.33%(+0.698)#81 | 0.30%(+0.721)#1,635 |
| 82. | Laura | 1.02% | 0.33%(+0.692)#82 | 0.30%(+0.715)#1,644 |
| 83. | Chesterland | 1.01% | 0.33%(+0.685)#83 | 0.30%(+0.708)#1,659 |
| 84. | Broadview Heights | 1.00% | 0.33%(+0.678)#84 | 0.30%(+0.701)#1,673 |
| 85. | Wintersville | 1.00% | 0.33%(+0.678)#85 | 0.30%(+0.701)#1,674 |
| 86. | Pleasant Hills | 0.99% | 0.33%(+0.665)#86 | 0.30%(+0.688)#1,697 |
| 87. | Pigeon Creek | 0.99% | 0.33%(+0.660)#87 | 0.30%(+0.683)#1,709 |
| 88. | Glenmoor | 0.99% | 0.33%(+0.659)#88 | 0.30%(+0.682)#1,712 |
| 89. | Worthington | 0.98% | 0.33%(+0.653)#89 | 0.30%(+0.676)#1,725 |
| 90. | Baltimore | 0.98% | 0.33%(+0.650)#90 | 0.30%(+0.673)#1,735 |
| 91. | Westlake | 0.96% | 0.33%(+0.631)#91 | 0.30%(+0.654)#1,777 |
| 92. | Sixteen Mile Stand | 0.95% | 0.33%(+0.625)#92 | 0.30%(+0.648)#1,791 |
| 93. | Clarington | 0.95% | 0.33%(+0.623)#93 | 0.30%(+0.646)#1,797 |
| 94. | Chagrin Falls | 0.95% | 0.33%(+0.621)#94 | 0.30%(+0.644)#1,800 |
| 95. | Reminderville | 0.94% | 0.33%(+0.616)#95 | 0.30%(+0.639)#1,815 |
| 96. | Woodworth | 0.94% | 0.33%(+0.612)#96 | 0.30%(+0.635)#1,825 |
| 97. | Bloomville | 0.92% | 0.33%(+0.594)#97 | 0.30%(+0.617)#1,860 |
| 98. | Buckeye Lake | 0.91% | 0.33%(+0.587)#98 | 0.30%(+0.610)#1,869 |
| 99. | Bridgeport | 0.90% | 0.33%(+0.570)#99 | 0.30%(+0.593)#1,902 |
| 100. | Medina | 0.90% | 0.33%(+0.570)#100 | 0.30%(+0.593)#1,905 |
Common Questions
What are the Top 10 Cities with the Highest Percentage of Eastern European Population in Ohio?
Top 10 Cities with the Highest Percentage of Eastern European Population in Ohio are:
#1
10.10%
#2
6.76%
#3
6.67%
#4
6.35%
#5
6.03%
#6
5.24%
#7
5.03%
#8
4.94%
#9
4.92%
#10
4.73%
What city has the Highest Percentage of Eastern European Population in Ohio?
Remington has the Highest Percentage of Eastern European Population in Ohio with 10.10%.
What is the Percentage of Eastern European Population in the State of Ohio?
Percentage of Eastern European Population in Ohio is 0.33%.
What is the Percentage of Eastern European Population in the United States?
Percentage of Eastern European Population in the United States is 0.30%.