Cities with the Highest Percentage of Eastern European Population in Missouri
RELATED REPORTS & OPTIONS
Eastern European
Missouri
Compare Cities
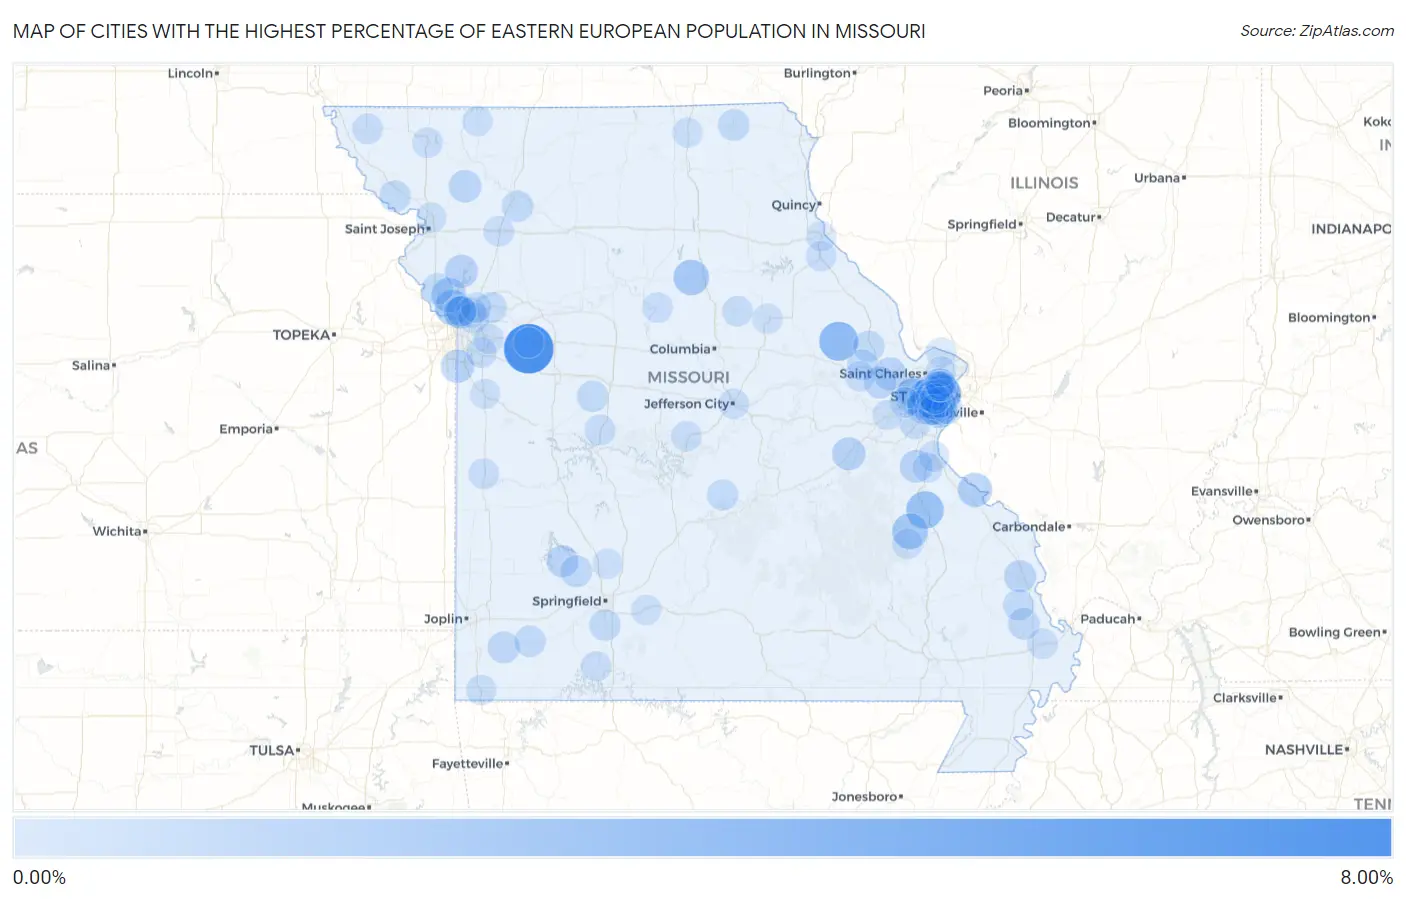
Map of Cities with the Highest Percentage of Eastern European Population in Missouri
0.00%
8.00%
Cities with the Highest Percentage of Eastern European Population in Missouri
| City | Eastern European | vs State | vs National | |
| 1. | Lake Lafayette | 7.85% | 0.20%(+7.65)#1 | 0.30%(+7.55)#67 |
| 2. | Truxton | 3.64% | 0.20%(+3.44)#2 | 0.30%(+3.33)#281 |
| 3. | Clayton | 3.09% | 0.20%(+2.89)#3 | 0.30%(+2.78)#360 |
| 4. | Leadington | 3.02% | 0.20%(+2.82)#4 | 0.30%(+2.72)#371 |
| 5. | Iron Mountain Lake | 2.36% | 0.20%(+2.16)#5 | 0.30%(+2.05)#535 |
| 6. | Huntsville | 2.29% | 0.20%(+2.09)#6 | 0.30%(+1.98)#561 |
| 7. | Lake Waukomis | 2.15% | 0.20%(+1.96)#7 | 0.30%(+1.85)#624 |
| 8. | Country Life Acres | 2.15% | 0.20%(+1.95)#8 | 0.30%(+1.85)#626 |
| 9. | Clarkson Valley | 2.15% | 0.20%(+1.95)#9 | 0.30%(+1.84)#627 |
| 10. | Ferrelview | 1.89% | 0.20%(+1.69)#10 | 0.30%(+1.59)#764 |
| 11. | Grantwood Village | 1.84% | 0.20%(+1.64)#11 | 0.30%(+1.54)#791 |
| 12. | Ste Genevieve | 1.73% | 0.20%(+1.53)#12 | 0.30%(+1.43)#845 |
| 13. | Olivette | 1.64% | 0.20%(+1.44)#13 | 0.30%(+1.33)#908 |
| 14. | Sycamore Hills | 1.61% | 0.20%(+1.41)#14 | 0.30%(+1.31)#927 |
| 15. | Loch Lloyd | 1.40% | 0.20%(+1.21)#15 | 0.30%(+1.10)#1,096 |
| 16. | Valley Park | 1.40% | 0.20%(+1.20)#16 | 0.30%(+1.10)#1,099 |
| 17. | Oak Grove Village | 1.36% | 0.20%(+1.16)#17 | 0.30%(+1.05)#1,159 |
| 18. | University City | 1.34% | 0.20%(+1.14)#18 | 0.30%(+1.04)#1,172 |
| 19. | Trimble | 1.32% | 0.20%(+1.13)#19 | 0.30%(+1.02)#1,195 |
| 20. | Frontenac | 1.26% | 0.20%(+1.07)#20 | 0.30%(+0.960)#1,262 |
| 21. | De Soto | 1.24% | 0.20%(+1.05)#21 | 0.30%(+0.940)#1,290 |
| 22. | Oakwood Park | 1.20% | 0.20%(+0.997)#22 | 0.30%(+0.891)#1,370 |
| 23. | King City | 1.17% | 0.20%(+0.972)#23 | 0.30%(+0.867)#1,392 |
| 24. | Lake St Louis | 1.16% | 0.20%(+0.960)#24 | 0.30%(+0.855)#1,413 |
| 25. | Chesterfield | 1.10% | 0.20%(+0.898)#25 | 0.30%(+0.792)#1,516 |
| 26. | Oaks | 1.09% | 0.20%(+0.895)#26 | 0.30%(+0.789)#1,523 |
| 27. | Jackson | 1.01% | 0.20%(+0.815)#27 | 0.30%(+0.710)#1,654 |
| 28. | Dadeville | 0.97% | 0.20%(+0.768)#28 | 0.30%(+0.662)#1,763 |
| 29. | New Melle | 0.96% | 0.20%(+0.759)#29 | 0.30%(+0.653)#1,782 |
| 30. | Creve Coeur | 0.95% | 0.20%(+0.749)#30 | 0.30%(+0.644)#1,799 |
| 31. | Walnut Grove | 0.95% | 0.20%(+0.747)#31 | 0.30%(+0.641)#1,806 |
| 32. | Newtonia | 0.90% | 0.20%(+0.703)#32 | 0.30%(+0.597)#1,894 |
| 33. | Morley | 0.87% | 0.20%(+0.676)#33 | 0.30%(+0.570)#1,957 |
| 34. | Richmond Heights | 0.86% | 0.20%(+0.662)#34 | 0.30%(+0.556)#1,994 |
| 35. | Oakland | 0.86% | 0.20%(+0.659)#35 | 0.30%(+0.554)#2,002 |
| 36. | Green Park | 0.78% | 0.20%(+0.583)#36 | 0.30%(+0.478)#2,226 |
| 37. | Troy | 0.78% | 0.20%(+0.581)#37 | 0.30%(+0.475)#2,236 |
| 38. | Nixa | 0.77% | 0.20%(+0.575)#38 | 0.30%(+0.470)#2,252 |
| 39. | Oregon | 0.76% | 0.20%(+0.561)#39 | 0.30%(+0.455)#2,307 |
| 40. | Monett | 0.76% | 0.20%(+0.560)#40 | 0.30%(+0.454)#2,310 |
| 41. | Memphis | 0.75% | 0.20%(+0.554)#41 | 0.30%(+0.448)#2,329 |
| 42. | Green Ridge | 0.75% | 0.20%(+0.549)#42 | 0.30%(+0.444)#2,339 |
| 43. | Lake Viking | 0.74% | 0.20%(+0.546)#43 | 0.30%(+0.441)#2,351 |
| 44. | Concord | 0.74% | 0.20%(+0.543)#44 | 0.30%(+0.438)#2,362 |
| 45. | Manchester | 0.73% | 0.20%(+0.536)#45 | 0.30%(+0.431)#2,383 |
| 46. | Chaffee | 0.69% | 0.20%(+0.493)#46 | 0.30%(+0.388)#2,523 |
| 47. | Platte City | 0.69% | 0.20%(+0.492)#47 | 0.30%(+0.386)#2,530 |
| 48. | Missouri City | 0.67% | 0.20%(+0.471)#48 | 0.30%(+0.365)#2,602 |
| 49. | Town And Country | 0.63% | 0.20%(+0.432)#49 | 0.30%(+0.327)#2,745 |
| 50. | Webster Groves | 0.63% | 0.20%(+0.427)#50 | 0.30%(+0.321)#2,771 |
| 51. | Birmingham | 0.62% | 0.20%(+0.423)#51 | 0.30%(+0.317)#2,795 |
| 52. | Crocker | 0.58% | 0.20%(+0.382)#52 | 0.30%(+0.276)#2,962 |
| 53. | Wright City | 0.58% | 0.20%(+0.382)#53 | 0.30%(+0.276)#2,963 |
| 54. | Lincoln | 0.54% | 0.20%(+0.338)#54 | 0.30%(+0.232)#3,167 |
| 55. | Ladue | 0.53% | 0.20%(+0.328)#55 | 0.30%(+0.222)#3,222 |
| 56. | Twin Oaks | 0.48% | 0.20%(+0.286)#56 | 0.30%(+0.181)#3,425 |
| 57. | Byrnes Mill | 0.48% | 0.20%(+0.277)#57 | 0.30%(+0.172)#3,489 |
| 58. | Tarkio | 0.48% | 0.20%(+0.277)#58 | 0.30%(+0.171)#3,492 |
| 59. | Kirkwood | 0.47% | 0.20%(+0.269)#59 | 0.30%(+0.164)#3,535 |
| 60. | Lee S Summit | 0.46% | 0.20%(+0.267)#60 | 0.30%(+0.161)#3,547 |
| 61. | Centralia | 0.46% | 0.20%(+0.261)#61 | 0.30%(+0.156)#3,577 |
| 62. | Wildwood | 0.45% | 0.20%(+0.247)#62 | 0.30%(+0.141)#3,653 |
| 63. | Cameron | 0.44% | 0.20%(+0.241)#63 | 0.30%(+0.136)#3,679 |
| 64. | Fenton | 0.44% | 0.20%(+0.241)#64 | 0.30%(+0.136)#3,680 |
| 65. | Glasgow | 0.44% | 0.20%(+0.239)#65 | 0.30%(+0.134)#3,687 |
| 66. | Crystal Lake Park | 0.43% | 0.20%(+0.237)#66 | 0.30%(+0.131)#3,703 |
| 67. | Rich Hill | 0.43% | 0.20%(+0.235)#67 | 0.30%(+0.130)#3,716 |
| 68. | Bella Villa | 0.43% | 0.20%(+0.233)#68 | 0.30%(+0.128)#3,731 |
| 69. | Ironton | 0.43% | 0.20%(+0.229)#69 | 0.30%(+0.123)#3,754 |
| 70. | Festus | 0.42% | 0.20%(+0.225)#70 | 0.30%(+0.119)#3,780 |
| 71. | Bertrand | 0.40% | 0.20%(+0.206)#71 | 0.30%(+0.100)#3,919 |
| 72. | Claycomo | 0.39% | 0.20%(+0.187)#72 | 0.30%(+0.082)#4,060 |
| 73. | Maryville | 0.38% | 0.20%(+0.185)#73 | 0.30%(+0.080)#4,081 |
| 74. | Eldon | 0.38% | 0.20%(+0.185)#74 | 0.30%(+0.080)#4,082 |
| 75. | New London | 0.36% | 0.20%(+0.165)#75 | 0.30%(+0.060)#4,236 |
| 76. | Sunset Hills | 0.36% | 0.20%(+0.164)#76 | 0.30%(+0.058)#4,248 |
| 77. | Odessa | 0.36% | 0.20%(+0.162)#77 | 0.30%(+0.056)#4,268 |
| 78. | Jefferson City | 0.36% | 0.20%(+0.161)#78 | 0.30%(+0.055)#4,280 |
| 79. | Reeds Spring | 0.36% | 0.20%(+0.159)#79 | 0.30%(+0.053)#4,294 |
| 80. | St John | 0.35% | 0.20%(+0.151)#80 | 0.30%(+0.046)#4,356 |
| 81. | Lake Tapawingo | 0.34% | 0.20%(+0.146)#81 | 0.30%(+0.041)#4,399 |
| 82. | Innsbrook | 0.34% | 0.20%(+0.144)#82 | 0.30%(+0.038)#4,421 |
| 83. | Pineville | 0.34% | 0.20%(+0.137)#83 | 0.30%(+0.031)#4,488 |
| 84. | Warson Woods | 0.33% | 0.20%(+0.134)#84 | 0.30%(+0.028)#4,529 |
| 85. | Liberty | 0.33% | 0.20%(+0.132)#85 | 0.30%(+0.026)#4,561 |
| 86. | Fordland | 0.32% | 0.20%(+0.117)#86 | 0.30%(+0.012)#4,689 |
| 87. | Country Club | 0.31% | 0.20%(+0.115)#87 | 0.30%(+0.010)#4,710 |
| 88. | Mexico | 0.31% | 0.20%(+0.115)#88 | 0.30%(+0.009)#4,712 |
| 89. | Gray Summit | 0.31% | 0.20%(+0.113)#89 | 0.30%(+0.007)#4,730 |
| 90. | Portage Des Sioux | 0.30% | 0.20%(+0.105)#90 | 0.30%(-0.001)#4,812 |
| 91. | Grant City | 0.30% | 0.20%(+0.101)#91 | 0.30%(-0.005)#4,855 |
| 92. | Queen City | 0.28% | 0.20%(+0.084)#92 | 0.30%(-0.021)#5,045 |
| 93. | Florissant | 0.28% | 0.20%(+0.082)#93 | 0.30%(-0.024)#5,089 |
| 94. | Pleasant Hope | 0.28% | 0.20%(+0.077)#94 | 0.30%(-0.028)#5,139 |
| 95. | Overland | 0.27% | 0.20%(+0.073)#95 | 0.30%(-0.032)#5,200 |
| 96. | Vinita Park | 0.27% | 0.20%(+0.071)#96 | 0.30%(-0.034)#5,237 |
| 97. | Harrisonville | 0.26% | 0.20%(+0.061)#97 | 0.30%(-0.044)#5,363 |
| 98. | Gladstone | 0.26% | 0.20%(+0.058)#98 | 0.30%(-0.048)#5,413 |
| 99. | Olympian Village | 0.25% | 0.20%(+0.057)#99 | 0.30%(-0.049)#5,425 |
| 100. | Hannibal | 0.25% | 0.20%(+0.055)#100 | 0.30%(-0.051)#5,447 |
Common Questions
What are the Top 10 Cities with the Highest Percentage of Eastern European Population in Missouri?
Top 10 Cities with the Highest Percentage of Eastern European Population in Missouri are:
#1
7.85%
#2
3.64%
#3
3.09%
#4
3.02%
#5
2.36%
#6
2.29%
#7
2.15%
#8
2.15%
#9
2.15%
#10
1.89%
What city has the Highest Percentage of Eastern European Population in Missouri?
Lake Lafayette has the Highest Percentage of Eastern European Population in Missouri with 7.85%.
What is the Percentage of Eastern European Population in the State of Missouri?
Percentage of Eastern European Population in Missouri is 0.20%.
What is the Percentage of Eastern European Population in the United States?
Percentage of Eastern European Population in the United States is 0.30%.