Los Osos, CA Map & Demographics
Los Osos Map
Los Osos Overview
$44,183
PER CAPITA INCOME
$97,375
AVG FAMILY INCOME
$91,902
AVG HOUSEHOLD INCOME
57.6%
WAGE / INCOME GAP [ % ]
42.4¢/ $1
WAGE / INCOME GAP [ $ ]
0.38
INEQUALITY / GINI INDEX
15,523
TOTAL POPULATION
7,880
MALE POPULATION
7,643
FEMALE POPULATION
103.10
MALES / 100 FEMALES
96.99
FEMALES / 100 MALES
47.6
MEDIAN AGE
2.9
AVG FAMILY SIZE
2.4
AVG HOUSEHOLD SIZE
7,746
LABOR FORCE [ PEOPLE ]
59.5%
PERCENT IN LABOR FORCE
5.6%
UNEMPLOYMENT RATE
Los Osos Zip Codes
Los Osos Area Codes
Income in Los Osos
Income Overview in Los Osos
Per Capita Income in Los Osos is $44,183, while median incomes of families and households are $97,375 and $91,902 respectively.
| Characteristic | Number | Measure |
| Per Capita Income | 15,523 | $44,183 |
| Median Family Income | 4,181 | $97,375 |
| Mean Family Income | 4,181 | $115,419 |
| Median Household Income | 6,374 | $91,902 |
| Mean Household Income | 6,374 | $106,777 |
| Income Deficit | 4,181 | $0 |
| Wage / Income Gap (%) | 15,523 | 57.55% |
| Wage / Income Gap ($) | 15,523 | 42.45¢ per $1 |
| Gini / Inequality Index | 15,523 | 0.38 |
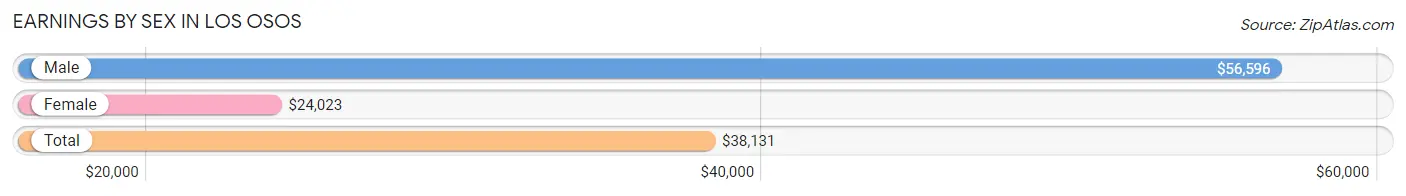
Earnings by Sex in Los Osos
Average Earnings in Los Osos are $38,131, $56,596 for men and $24,023 for women, a difference of 57.6%.
| Sex | Number | Average Earnings |
| Male | 4,497 (54.9%) | $56,596 |
| Female | 3,695 (45.1%) | $24,023 |
| Total | 8,192 (100.0%) | $38,131 |
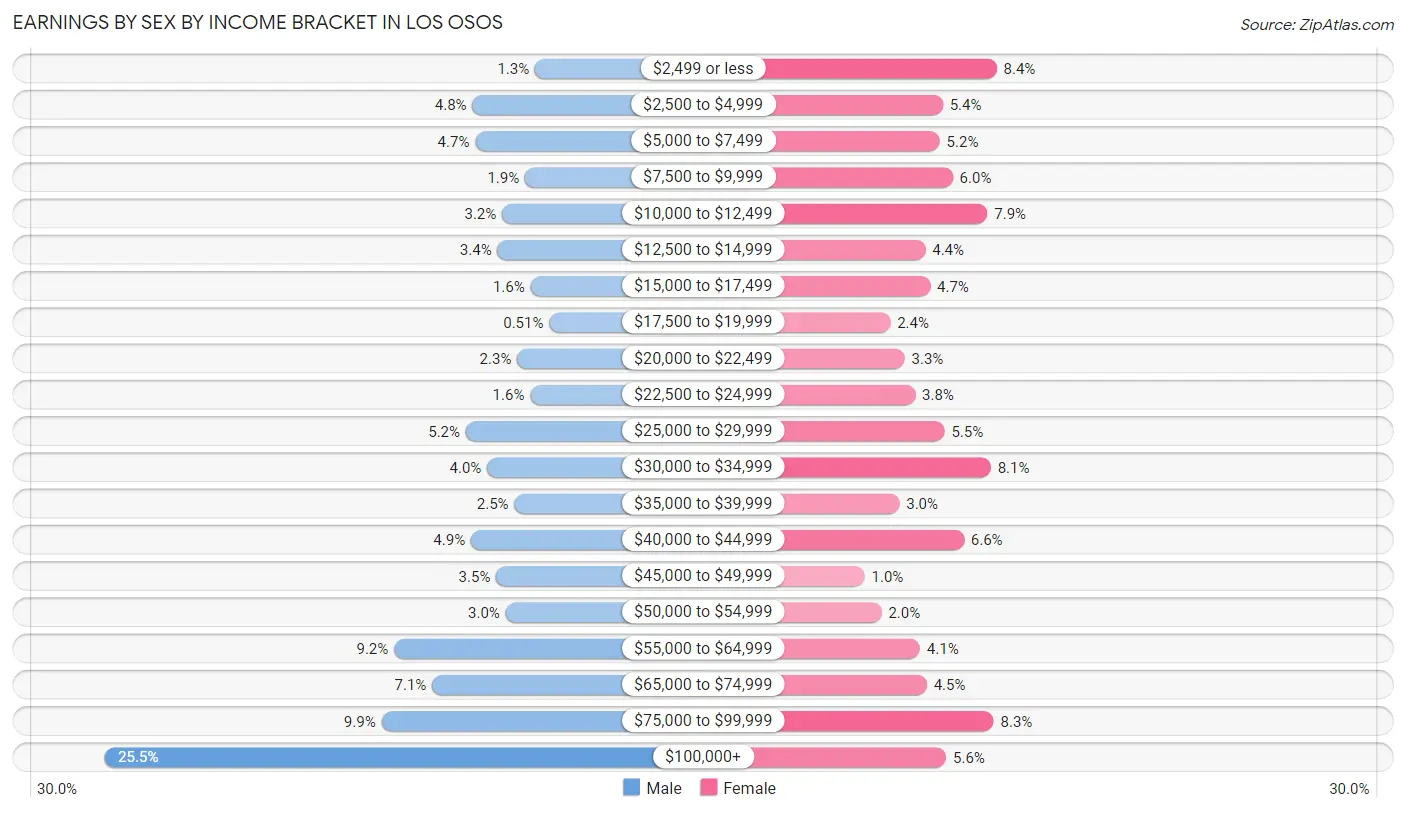
Earnings by Sex by Income Bracket in Los Osos
The most common earnings brackets in Los Osos are $100,000+ for men (1,146 | 25.5%) and $2,499 or less for women (311 | 8.4%).
| Income | Male | Female |
| $2,499 or less | 59 (1.3%) | 311 (8.4%) |
| $2,500 to $4,999 | 217 (4.8%) | 199 (5.4%) |
| $5,000 to $7,499 | 210 (4.7%) | 193 (5.2%) |
| $7,500 to $9,999 | 84 (1.9%) | 220 (5.9%) |
| $10,000 to $12,499 | 142 (3.2%) | 292 (7.9%) |
| $12,500 to $14,999 | 154 (3.4%) | 163 (4.4%) |
| $15,000 to $17,499 | 70 (1.6%) | 173 (4.7%) |
| $17,500 to $19,999 | 23 (0.5%) | 90 (2.4%) |
| $20,000 to $22,499 | 104 (2.3%) | 120 (3.3%) |
| $22,500 to $24,999 | 71 (1.6%) | 142 (3.8%) |
| $25,000 to $29,999 | 234 (5.2%) | 203 (5.5%) |
| $30,000 to $34,999 | 180 (4.0%) | 299 (8.1%) |
| $35,000 to $39,999 | 111 (2.5%) | 109 (2.9%) |
| $40,000 to $44,999 | 221 (4.9%) | 243 (6.6%) |
| $45,000 to $49,999 | 157 (3.5%) | 37 (1.0%) |
| $50,000 to $54,999 | 133 (3.0%) | 72 (1.9%) |
| $55,000 to $64,999 | 415 (9.2%) | 152 (4.1%) |
| $65,000 to $74,999 | 319 (7.1%) | 166 (4.5%) |
| $75,000 to $99,999 | 447 (9.9%) | 305 (8.3%) |
| $100,000+ | 1,146 (25.5%) | 206 (5.6%) |
| Total | 4,497 (100.0%) | 3,695 (100.0%) |
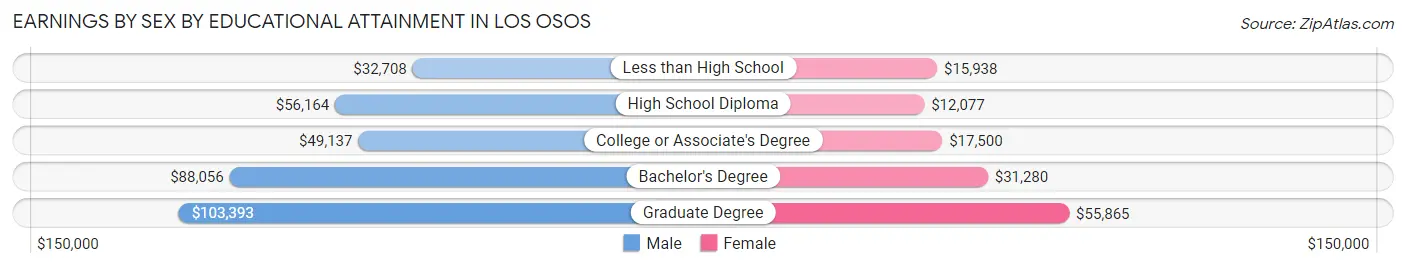
Earnings by Sex by Educational Attainment in Los Osos
Average earnings in Los Osos are $61,086 for men and $28,228 for women, a difference of 53.8%. Men with an educational attainment of graduate degree enjoy the highest average annual earnings of $103,393, while those with less than high school education earn the least with $32,708. Women with an educational attainment of graduate degree earn the most with the average annual earnings of $55,865, while those with high school diploma education have the smallest earnings of $12,077.
| Educational Attainment | Male Income | Female Income |
| Less than High School | $32,708 | $15,938 |
| High School Diploma | $56,164 | $12,077 |
| College or Associate's Degree | $49,137 | $17,500 |
| Bachelor's Degree | $88,056 | $31,280 |
| Graduate Degree | $103,393 | $55,865 |
| Total | $61,086 | $28,228 |
Family Income in Los Osos
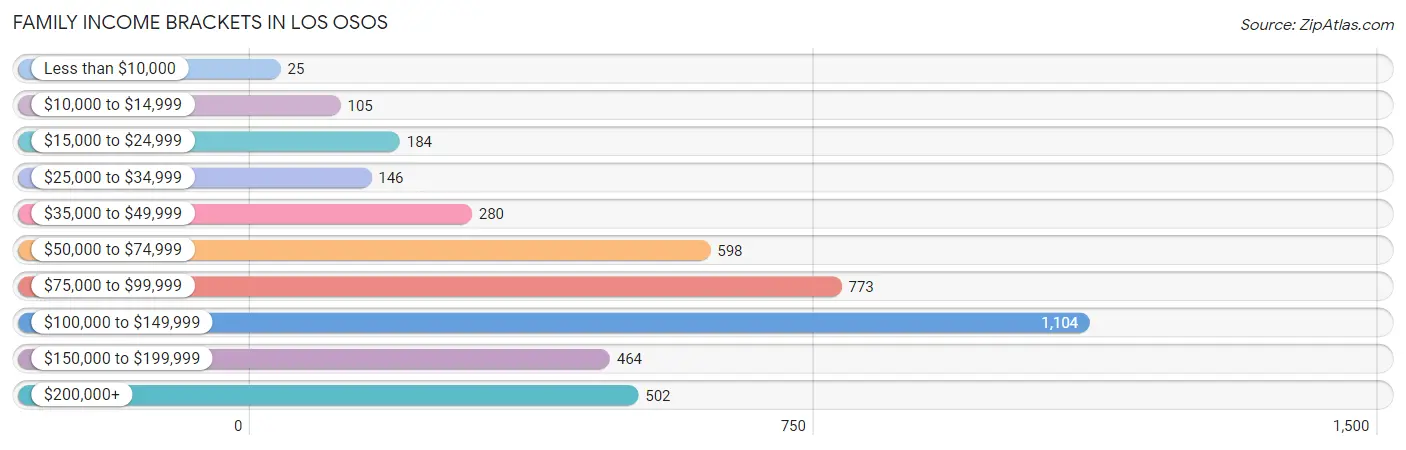
Family Income Brackets in Los Osos
According to the Los Osos family income data, there are 1,104 families falling into the $100,000 to $149,999 income range, which is the most common income bracket and makes up 26.4% of all families. Conversely, the less than $10,000 income bracket is the least frequent group with only 25 families (0.6%) belonging to this category.
| Income Bracket | # Families | % Families |
| Less than $10,000 | 25 | 0.6% |
| $10,000 to $14,999 | 105 | 2.5% |
| $15,000 to $24,999 | 184 | 4.4% |
| $25,000 to $34,999 | 146 | 3.5% |
| $35,000 to $49,999 | 280 | 6.7% |
| $50,000 to $74,999 | 598 | 14.3% |
| $75,000 to $99,999 | 773 | 18.5% |
| $100,000 to $149,999 | 1,104 | 26.4% |
| $150,000 to $199,999 | 464 | 11.1% |
| $200,000+ | 502 | 12.0% |
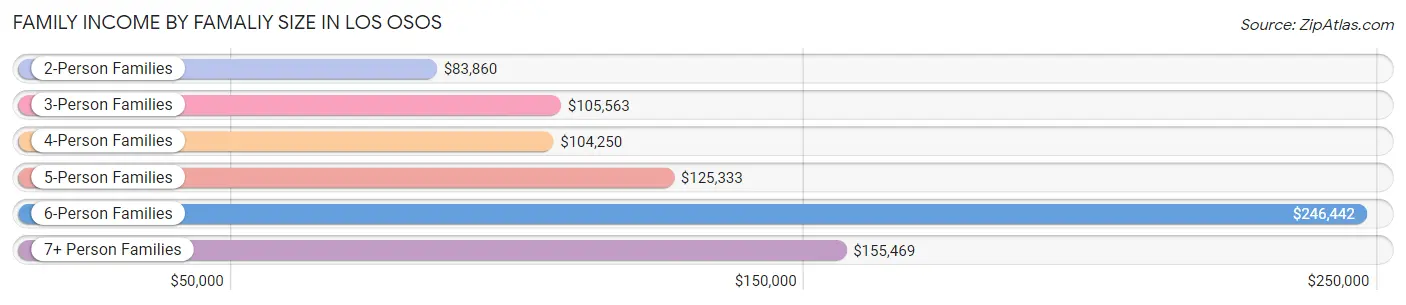
Family Income by Famaliy Size in Los Osos
6-person families (60 | 1.4%) account for the highest median family income in Los Osos with $246,442 per family, while 2-person families (2,416 | 57.8%) have the highest median income of $41,930 per family member.
| Income Bracket | # Families | Median Income |
| 2-Person Families | 2,416 (57.8%) | $83,860 |
| 3-Person Families | 757 (18.1%) | $105,563 |
| 4-Person Families | 692 (16.6%) | $104,250 |
| 5-Person Families | 190 (4.5%) | $125,333 |
| 6-Person Families | 60 (1.4%) | $246,442 |
| 7+ Person Families | 66 (1.6%) | $155,469 |
| Total | 4,181 (100.0%) | $97,375 |
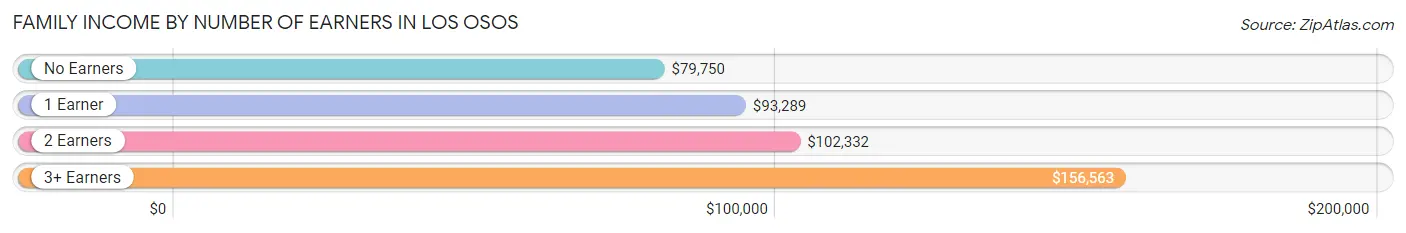
Family Income by Number of Earners in Los Osos
The median family income in Los Osos is $97,375, with families comprising 3+ earners (438) having the highest median family income of $156,563, while families with no earners (842) have the lowest median family income of $79,750, accounting for 10.5% and 20.1% of families, respectively.
| Number of Earners | # Families | Median Income |
| No Earners | 842 (20.1%) | $79,750 |
| 1 Earner | 1,312 (31.4%) | $93,289 |
| 2 Earners | 1,589 (38.0%) | $102,332 |
| 3+ Earners | 438 (10.5%) | $156,563 |
| Total | 4,181 (100.0%) | $97,375 |
Household Income in Los Osos
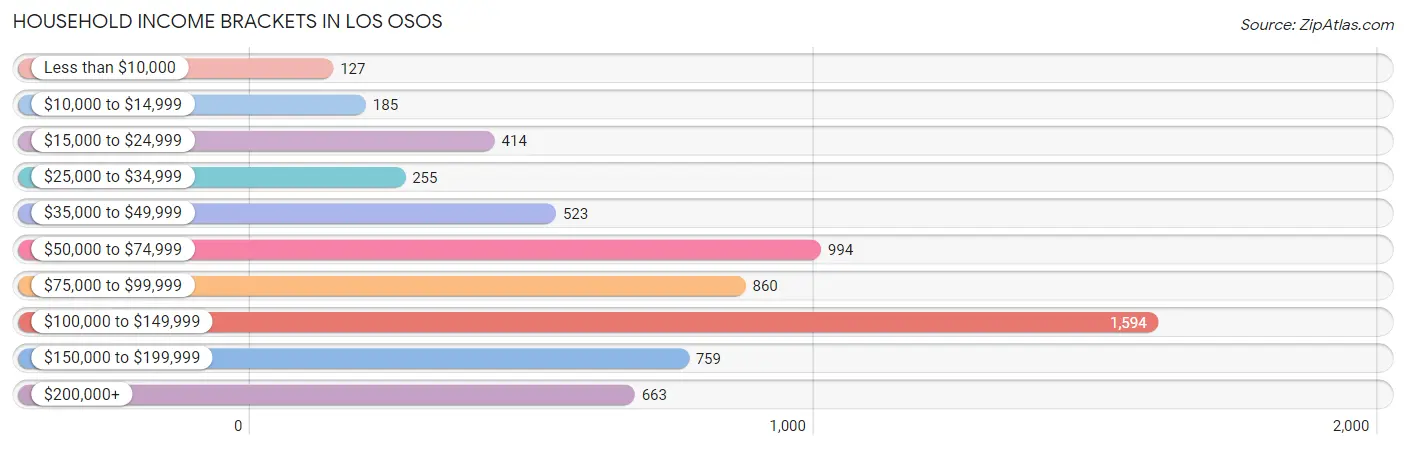
Household Income Brackets in Los Osos
With 1,594 households falling in the category, the $100,000 to $149,999 income range is the most frequent in Los Osos, accounting for 25.0% of all households. In contrast, only 127 households (2.0%) fall into the less than $10,000 income bracket, making it the least populous group.
| Income Bracket | # Households | % Households |
| Less than $10,000 | 127 | 2.0% |
| $10,000 to $14,999 | 185 | 2.9% |
| $15,000 to $24,999 | 414 | 6.5% |
| $25,000 to $34,999 | 255 | 4.0% |
| $35,000 to $49,999 | 523 | 8.2% |
| $50,000 to $74,999 | 994 | 15.6% |
| $75,000 to $99,999 | 860 | 13.5% |
| $100,000 to $149,999 | 1,594 | 25.0% |
| $150,000 to $199,999 | 759 | 11.9% |
| $200,000+ | 663 | 10.4% |
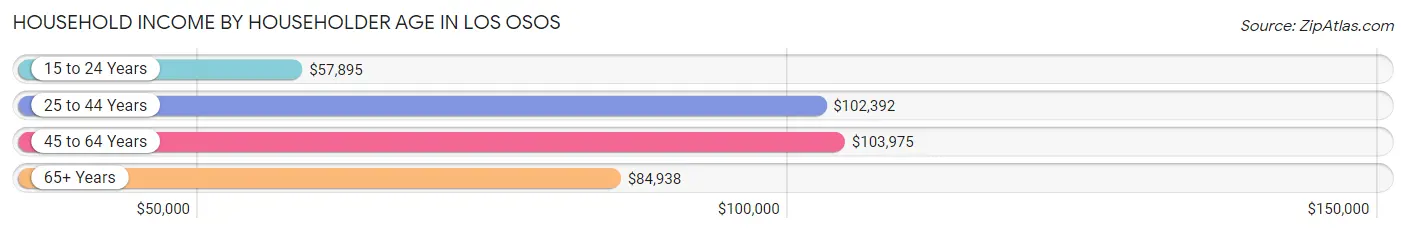
Household Income by Householder Age in Los Osos
The median household income in Los Osos is $91,902, with the highest median household income of $103,975 found in the 45 to 64 years age bracket for the primary householder. A total of 1,957 households (30.7%) fall into this category. Meanwhile, the 15 to 24 years age bracket for the primary householder has the lowest median household income of $57,895, with 130 households (2.0%) in this group.
| Income Bracket | # Households | Median Income |
| 15 to 24 Years | 130 (2.0%) | $57,895 |
| 25 to 44 Years | 1,656 (26.0%) | $102,392 |
| 45 to 64 Years | 1,957 (30.7%) | $103,975 |
| 65+ Years | 2,631 (41.3%) | $84,938 |
| Total | 6,374 (100.0%) | $91,902 |
Poverty in Los Osos
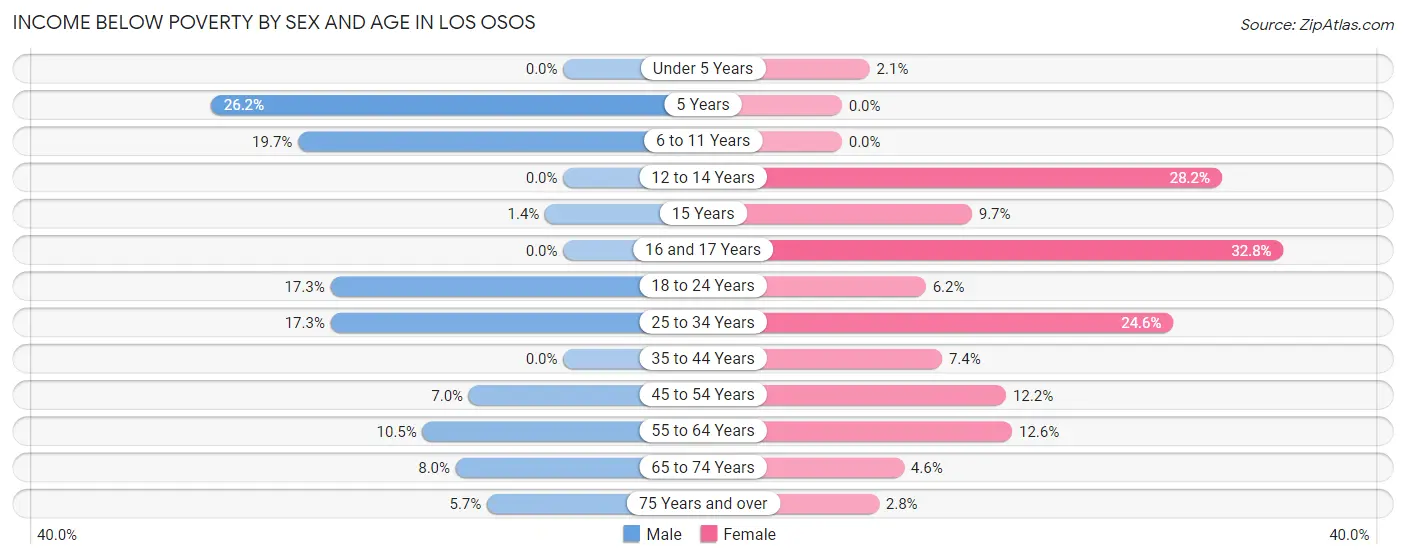
Income Below Poverty by Sex and Age in Los Osos
With 8.9% poverty level for males and 9.8% for females among the residents of Los Osos, 5 year old males and 16 and 17 year old females are the most vulnerable to poverty, with 28 males (26.2%) and 60 females (32.8%) in their respective age groups living below the poverty level.
| Age Bracket | Male | Female |
| Under 5 Years | 0 (0.0%) | 11 (2.1%) |
| 5 Years | 28 (26.2%) | 0 (0.0%) |
| 6 to 11 Years | 77 (19.7%) | 0 (0.0%) |
| 12 to 14 Years | 0 (0.0%) | 55 (28.2%) |
| 15 Years | 1 (1.3%) | 11 (9.7%) |
| 16 and 17 Years | 0 (0.0%) | 60 (32.8%) |
| 18 to 24 Years | 106 (17.3%) | 32 (6.2%) |
| 25 to 34 Years | 161 (17.3%) | 203 (24.6%) |
| 35 to 44 Years | 0 (0.0%) | 64 (7.4%) |
| 45 to 54 Years | 65 (7.0%) | 84 (12.2%) |
| 55 to 64 Years | 117 (10.4%) | 145 (12.6%) |
| 65 to 74 Years | 96 (8.0%) | 61 (4.6%) |
| 75 Years and over | 46 (5.7%) | 21 (2.8%) |
| Total | 697 (8.9%) | 747 (9.8%) |
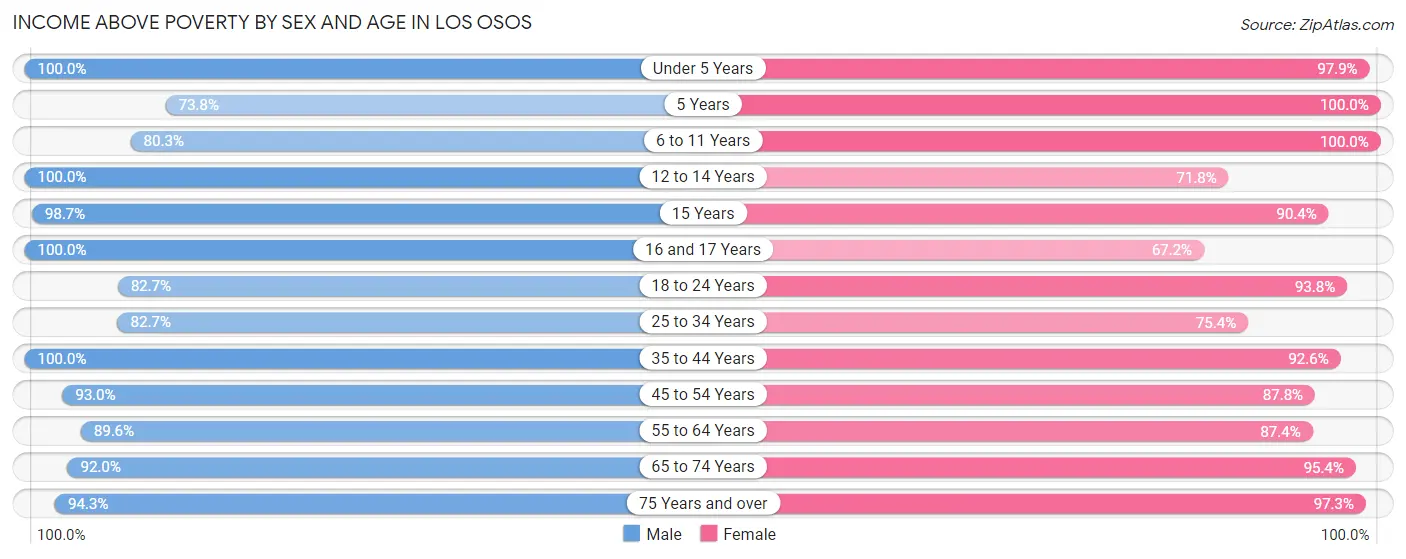
Income Above Poverty by Sex and Age in Los Osos
According to the poverty statistics in Los Osos, males aged under 5 years and females aged 5 years are the age groups that are most secure financially, with 100.0% of males and 100.0% of females in these age groups living above the poverty line.
| Age Bracket | Male | Female |
| Under 5 Years | 343 (100.0%) | 520 (97.9%) |
| 5 Years | 79 (73.8%) | 89 (100.0%) |
| 6 to 11 Years | 314 (80.3%) | 381 (100.0%) |
| 12 to 14 Years | 189 (100.0%) | 140 (71.8%) |
| 15 Years | 73 (98.7%) | 103 (90.3%) |
| 16 and 17 Years | 86 (100.0%) | 123 (67.2%) |
| 18 to 24 Years | 507 (82.7%) | 482 (93.8%) |
| 25 to 34 Years | 771 (82.7%) | 622 (75.4%) |
| 35 to 44 Years | 1,001 (100.0%) | 796 (92.6%) |
| 45 to 54 Years | 862 (93.0%) | 605 (87.8%) |
| 55 to 64 Years | 1,003 (89.5%) | 1,002 (87.4%) |
| 65 to 74 Years | 1,107 (92.0%) | 1,262 (95.4%) |
| 75 Years and over | 767 (94.3%) | 744 (97.3%) |
| Total | 7,102 (91.1%) | 6,869 (90.2%) |
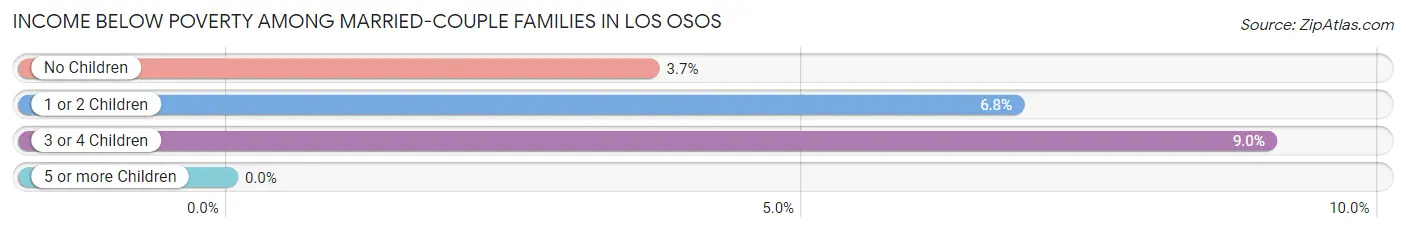
Income Below Poverty Among Married-Couple Families in Los Osos
The poverty statistics for married-couple families in Los Osos show that 4.7% or 160 of the total 3,402 families live below the poverty line. Families with 3 or 4 children have the highest poverty rate of 9.0%, comprising of 16 families. On the other hand, families with 5 or more children have the lowest poverty rate of 0.0%, which includes 0 families.
| Children | Above Poverty | Below Poverty |
| No Children | 2,283 (96.3%) | 87 (3.7%) |
| 1 or 2 Children | 776 (93.2%) | 57 (6.8%) |
| 3 or 4 Children | 161 (91.0%) | 16 (9.0%) |
| 5 or more Children | 22 (100.0%) | 0 (0.0%) |
| Total | 3,242 (95.3%) | 160 (4.7%) |
Income Below Poverty Among Single-Parent Households in Los Osos
According to the poverty data in Los Osos, 12.3% or 35 single-father households and 10.5% or 52 single-mother households are living below the poverty line. Among single-father households, those with no children have the highest poverty rate, with 35 households (33.0%) experiencing poverty. Likewise, among single-mother households, those with no children have the highest poverty rate, with 46 households (15.4%) falling below the poverty line.
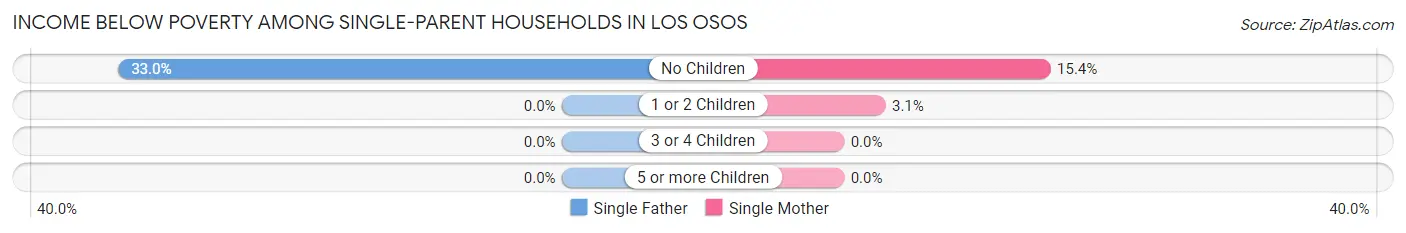
| Children | Single Father | Single Mother |
| No Children | 35 (33.0%) | 46 (15.4%) |
| 1 or 2 Children | 0 (0.0%) | 6 (3.1%) |
| 3 or 4 Children | 0 (0.0%) | 0 (0.0%) |
| 5 or more Children | 0 (0.0%) | 0 (0.0%) |
| Total | 35 (12.3%) | 52 (10.5%) |
Income Below Poverty Among Married-Couple vs Single-Parent Households in Los Osos
The poverty data for Los Osos shows that 160 of the married-couple family households (4.7%) and 87 of the single-parent households (11.2%) are living below the poverty level. Within the married-couple family households, those with 3 or 4 children have the highest poverty rate, with 16 households (9.0%) falling below the poverty line. Among the single-parent households, those with no children have the highest poverty rate, with 81 household (20.0%) living below poverty.
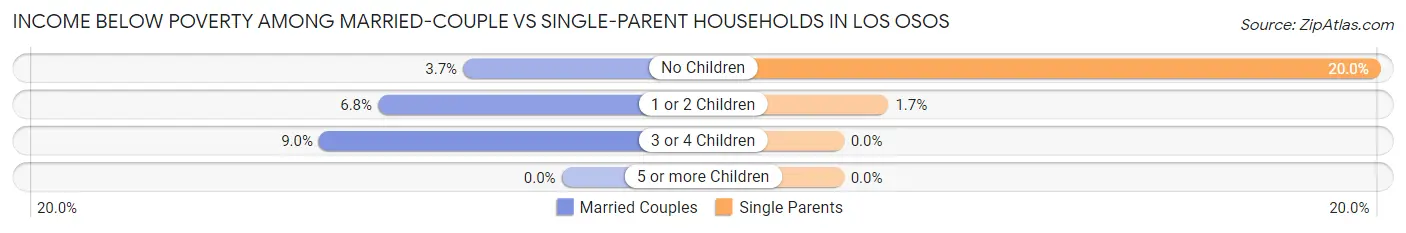
| Children | Married-Couple Families | Single-Parent Households |
| No Children | 87 (3.7%) | 81 (20.0%) |
| 1 or 2 Children | 57 (6.8%) | 6 (1.7%) |
| 3 or 4 Children | 16 (9.0%) | 0 (0.0%) |
| 5 or more Children | 0 (0.0%) | 0 (0.0%) |
| Total | 160 (4.7%) | 87 (11.2%) |
Race in Los Osos
The most populous races in Los Osos are White / Caucasian (12,665 | 81.6%), Hispanic or Latino (2,848 | 18.3%), and Two or more Races (1,395 | 9.0%).
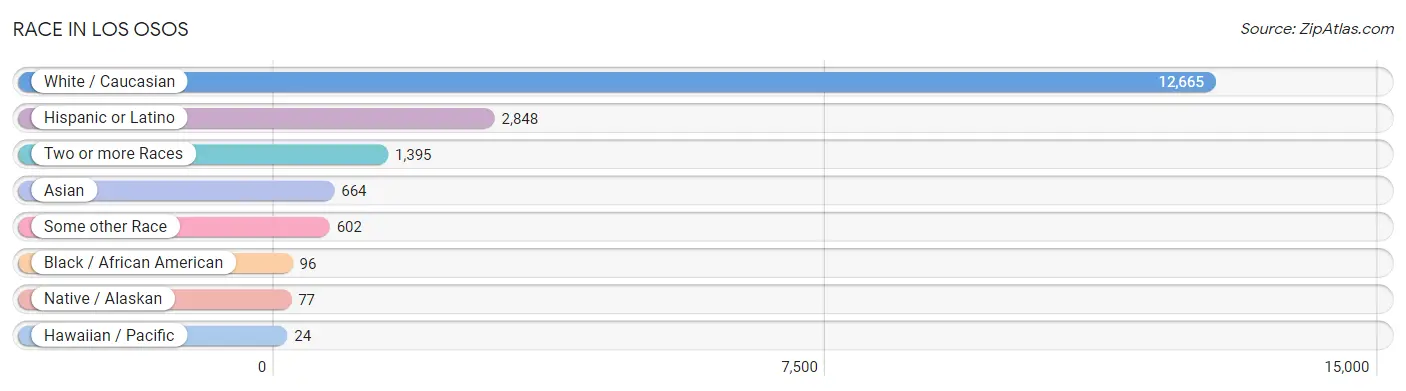
| Race | # Population | % Population |
| Asian | 664 | 4.3% |
| Black / African American | 96 | 0.6% |
| Hawaiian / Pacific | 24 | 0.2% |
| Hispanic or Latino | 2,848 | 18.3% |
| Native / Alaskan | 77 | 0.5% |
| White / Caucasian | 12,665 | 81.6% |
| Two or more Races | 1,395 | 9.0% |
| Some other Race | 602 | 3.9% |
| Total | 15,523 | 100.0% |
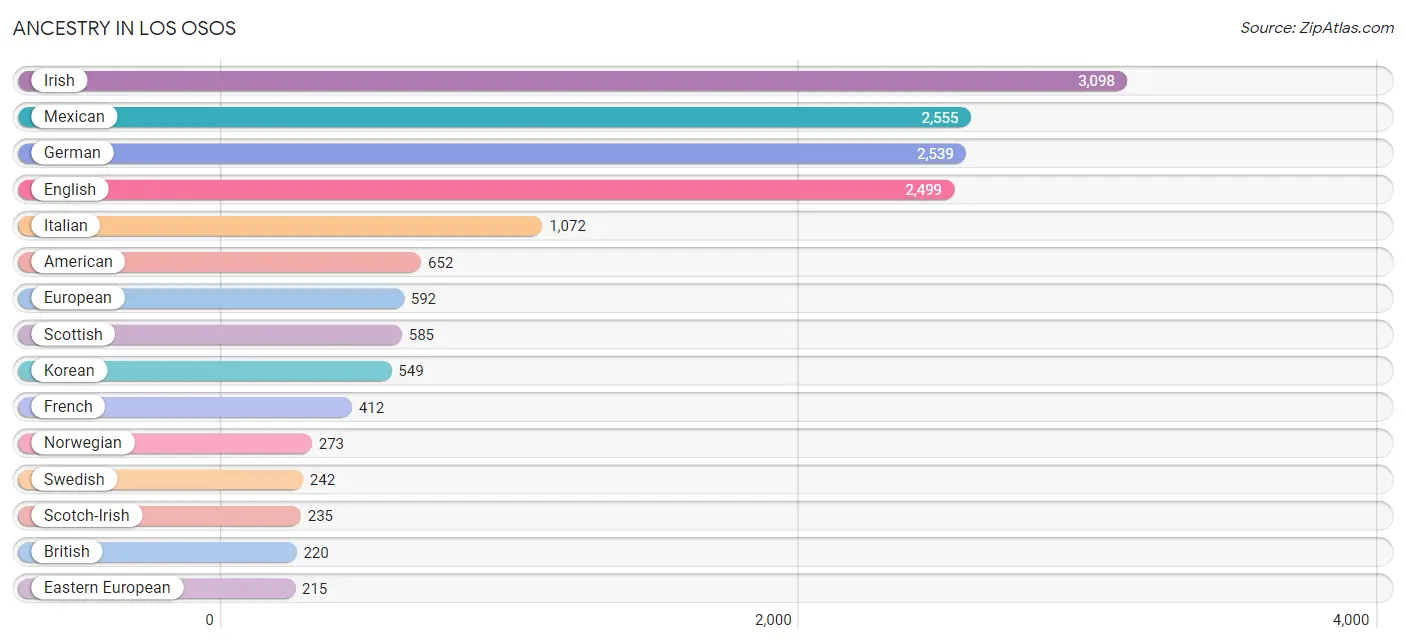
Ancestry in Los Osos
The most populous ancestries reported in Los Osos are Irish (3,098 | 20.0%), Mexican (2,555 | 16.5%), German (2,539 | 16.4%), English (2,499 | 16.1%), and Italian (1,072 | 6.9%), together accounting for 75.8% of all Los Osos residents.
| Ancestry | # Population | % Population |
| Alsatian | 8 | 0.1% |
| American | 652 | 4.2% |
| Apache | 24 | 0.2% |
| Arab | 19 | 0.1% |
| Argentinean | 30 | 0.2% |
| Armenian | 67 | 0.4% |
| Australian | 19 | 0.1% |
| Austrian | 158 | 1.0% |
| Basque | 20 | 0.1% |
| Belgian | 47 | 0.3% |
| Bhutanese | 80 | 0.5% |
| Brazilian | 13 | 0.1% |
| British | 220 | 1.4% |
| Canadian | 16 | 0.1% |
| Celtic | 19 | 0.1% |
| Central American | 41 | 0.3% |
| Cherokee | 26 | 0.2% |
| Chippewa | 18 | 0.1% |
| Colombian | 12 | 0.1% |
| Croatian | 16 | 0.1% |
| Czech | 22 | 0.1% |
| Czechoslovakian | 6 | 0.0% |
| Danish | 58 | 0.4% |
| Dutch | 195 | 1.3% |
| Eastern European | 215 | 1.4% |
| English | 2,499 | 16.1% |
| European | 592 | 3.8% |
| Filipino | 12 | 0.1% |
| Finnish | 46 | 0.3% |
| French | 412 | 2.6% |
| French Canadian | 47 | 0.3% |
| German | 2,539 | 16.4% |
| Greek | 65 | 0.4% |
| Honduran | 8 | 0.1% |
| Hungarian | 8 | 0.1% |
| Indian (Asian) | 160 | 1.0% |
| Iranian | 57 | 0.4% |
| Irish | 3,098 | 20.0% |
| Iroquois | 8 | 0.1% |
| Italian | 1,072 | 6.9% |
| Korean | 549 | 3.5% |
| Latvian | 9 | 0.1% |
| Lebanese | 10 | 0.1% |
| Lithuanian | 37 | 0.2% |
| Mexican | 2,555 | 16.5% |
| Mexican American Indian | 11 | 0.1% |
| Native Hawaiian | 11 | 0.1% |
| Navajo | 8 | 0.1% |
| Nigerian | 40 | 0.3% |
| Northern European | 121 | 0.8% |
| Norwegian | 273 | 1.8% |
| Pennsylvania German | 3 | 0.0% |
| Pima | 11 | 0.1% |
| Polish | 180 | 1.2% |
| Portuguese | 183 | 1.2% |
| Puerto Rican | 21 | 0.1% |
| Romanian | 34 | 0.2% |
| Russian | 143 | 0.9% |
| Salvadoran | 33 | 0.2% |
| Scandinavian | 131 | 0.8% |
| Scotch-Irish | 235 | 1.5% |
| Scottish | 585 | 3.8% |
| Sioux | 10 | 0.1% |
| Slovak | 9 | 0.1% |
| Slovene | 9 | 0.1% |
| South American | 42 | 0.3% |
| Spaniard | 32 | 0.2% |
| Spanish | 79 | 0.5% |
| Sri Lankan | 29 | 0.2% |
| Subsaharan African | 40 | 0.3% |
| Swedish | 242 | 1.6% |
| Swiss | 96 | 0.6% |
| Ukrainian | 49 | 0.3% |
| Ute | 23 | 0.2% |
| Welsh | 196 | 1.3% |
| Yaqui | 14 | 0.1% | View All 76 Rows |
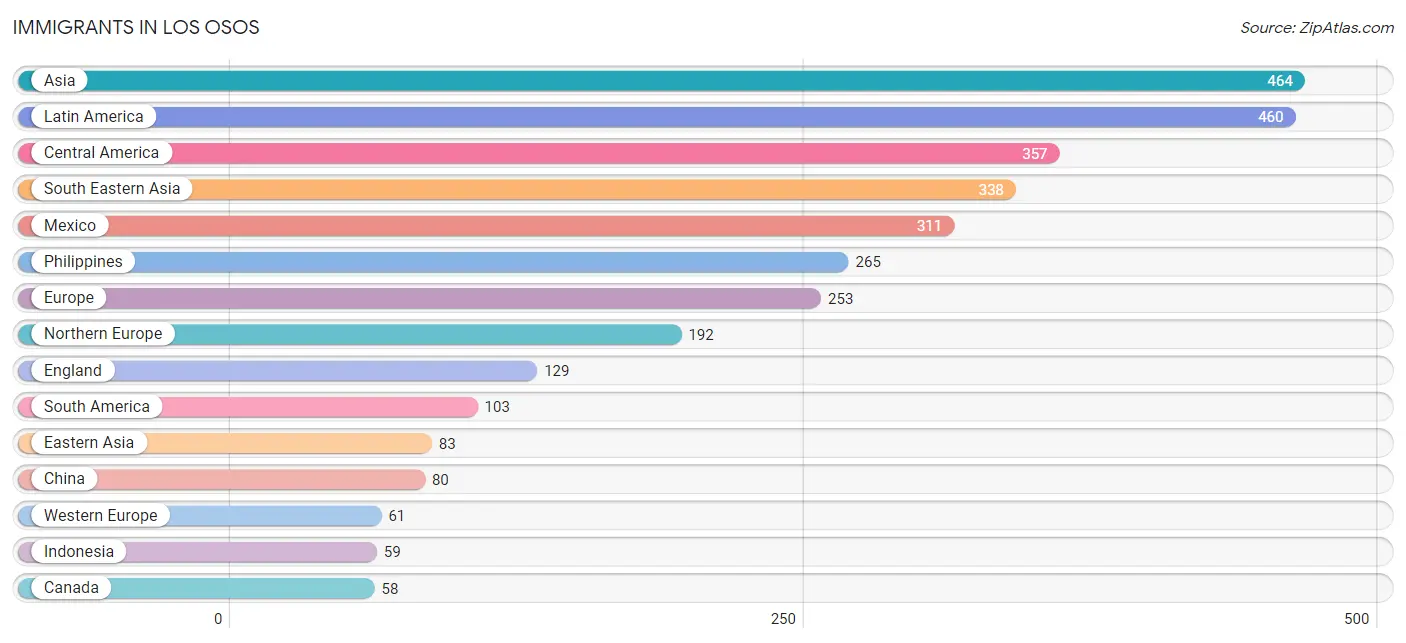
Immigrants in Los Osos
The most numerous immigrant groups reported in Los Osos came from Asia (464 | 3.0%), Latin America (460 | 3.0%), Central America (357 | 2.3%), South Eastern Asia (338 | 2.2%), and Mexico (311 | 2.0%), together accounting for 12.4% of all Los Osos residents.
| Immigration Origin | # Population | % Population |
| Africa | 40 | 0.3% |
| Argentina | 32 | 0.2% |
| Asia | 464 | 3.0% |
| Austria | 29 | 0.2% |
| Brazil | 22 | 0.1% |
| Canada | 58 | 0.4% |
| Central America | 357 | 2.3% |
| China | 80 | 0.5% |
| Colombia | 12 | 0.1% |
| Eastern Asia | 83 | 0.5% |
| Ecuador | 37 | 0.2% |
| El Salvador | 33 | 0.2% |
| England | 129 | 0.8% |
| Europe | 253 | 1.6% |
| Germany | 24 | 0.2% |
| Guatemala | 5 | 0.0% |
| Honduras | 8 | 0.1% |
| Indonesia | 59 | 0.4% |
| Iran | 34 | 0.2% |
| Iraq | 9 | 0.1% |
| Ireland | 50 | 0.3% |
| Japan | 3 | 0.0% |
| Latin America | 460 | 3.0% |
| Mexico | 311 | 2.0% |
| Netherlands | 8 | 0.1% |
| Nigeria | 40 | 0.3% |
| Northern Europe | 192 | 1.2% |
| Philippines | 265 | 1.7% |
| South America | 103 | 0.7% |
| South Central Asia | 34 | 0.2% |
| South Eastern Asia | 338 | 2.2% |
| Taiwan | 10 | 0.1% |
| Vietnam | 14 | 0.1% |
| Western Africa | 40 | 0.3% |
| Western Asia | 9 | 0.1% |
| Western Europe | 61 | 0.4% | View All 36 Rows |
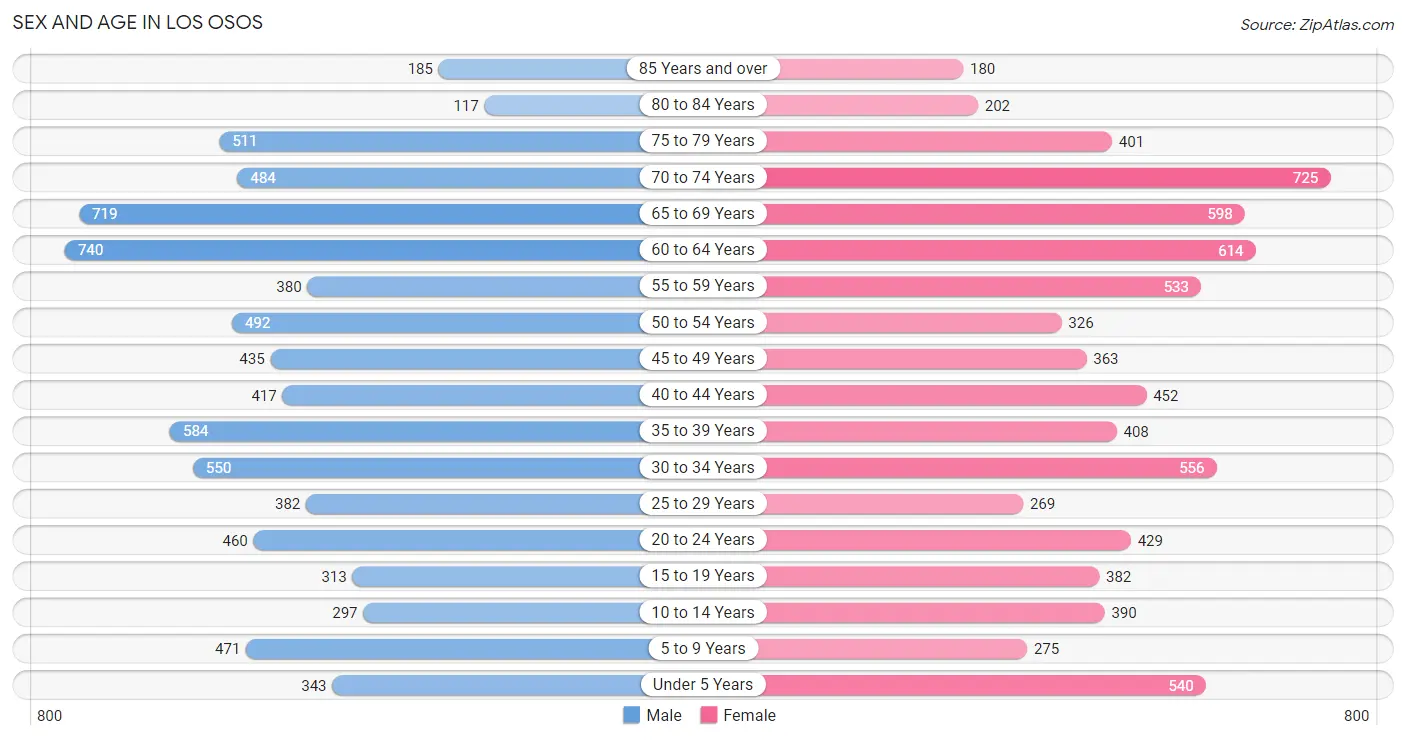
Sex and Age in Los Osos
Sex and Age in Los Osos
The most populous age groups in Los Osos are 60 to 64 Years (740 | 9.4%) for men and 70 to 74 Years (725 | 9.5%) for women.
| Age Bracket | Male | Female |
| Under 5 Years | 343 (4.3%) | 540 (7.1%) |
| 5 to 9 Years | 471 (6.0%) | 275 (3.6%) |
| 10 to 14 Years | 297 (3.8%) | 390 (5.1%) |
| 15 to 19 Years | 313 (4.0%) | 382 (5.0%) |
| 20 to 24 Years | 460 (5.8%) | 429 (5.6%) |
| 25 to 29 Years | 382 (4.9%) | 269 (3.5%) |
| 30 to 34 Years | 550 (7.0%) | 556 (7.3%) |
| 35 to 39 Years | 584 (7.4%) | 408 (5.3%) |
| 40 to 44 Years | 417 (5.3%) | 452 (5.9%) |
| 45 to 49 Years | 435 (5.5%) | 363 (4.8%) |
| 50 to 54 Years | 492 (6.2%) | 326 (4.3%) |
| 55 to 59 Years | 380 (4.8%) | 533 (7.0%) |
| 60 to 64 Years | 740 (9.4%) | 614 (8.0%) |
| 65 to 69 Years | 719 (9.1%) | 598 (7.8%) |
| 70 to 74 Years | 484 (6.1%) | 725 (9.5%) |
| 75 to 79 Years | 511 (6.5%) | 401 (5.2%) |
| 80 to 84 Years | 117 (1.5%) | 202 (2.6%) |
| 85 Years and over | 185 (2.4%) | 180 (2.4%) |
| Total | 7,880 (100.0%) | 7,643 (100.0%) |
Families and Households in Los Osos
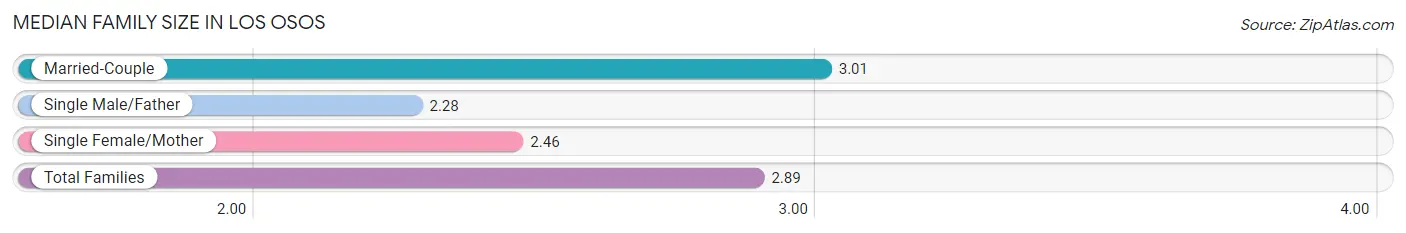
Median Family Size in Los Osos
The median family size in Los Osos is 2.89 persons per family, with married-couple families (3,402 | 81.4%) accounting for the largest median family size of 3.01 persons per family. On the other hand, single male/father families (285 | 6.8%) represent the smallest median family size with 2.28 persons per family.
| Family Type | # Families | Family Size |
| Married-Couple | 3,402 (81.4%) | 3.01 |
| Single Male/Father | 285 (6.8%) | 2.28 |
| Single Female/Mother | 494 (11.8%) | 2.46 |
| Total Families | 4,181 (100.0%) | 2.89 |
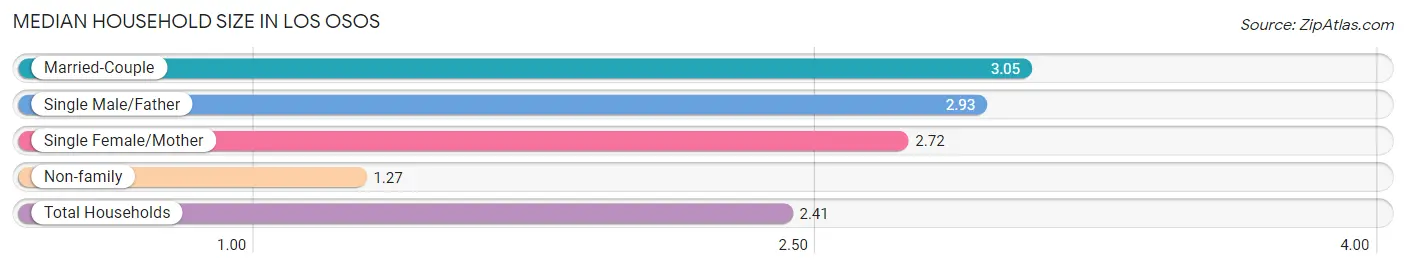
Median Household Size in Los Osos
The median household size in Los Osos is 2.41 persons per household, with married-couple households (3,402 | 53.4%) accounting for the largest median household size of 3.05 persons per household. non-family households (2,193 | 34.4%) represent the smallest median household size with 1.27 persons per household.
| Household Type | # Households | Household Size |
| Married-Couple | 3,402 (53.4%) | 3.05 |
| Single Male/Father | 285 (4.5%) | 2.93 |
| Single Female/Mother | 494 (7.7%) | 2.72 |
| Non-family | 2,193 (34.4%) | 1.27 |
| Total Households | 6,374 (100.0%) | 2.41 |
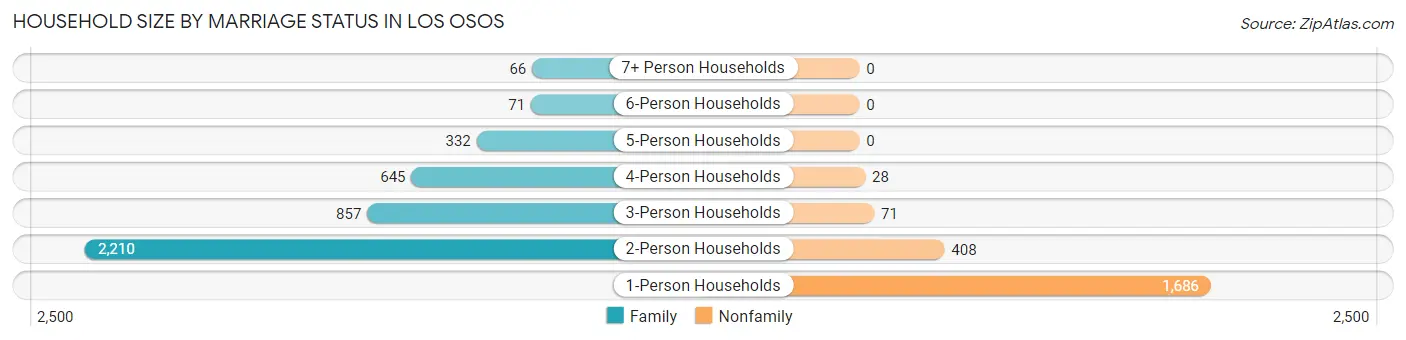
Household Size by Marriage Status in Los Osos
Out of a total of 6,374 households in Los Osos, 4,181 (65.6%) are family households, while 2,193 (34.4%) are nonfamily households. The most numerous type of family households are 2-person households, comprising 2,210, and the most common type of nonfamily households are 1-person households, comprising 1,686.
| Household Size | Family Households | Nonfamily Households |
| 1-Person Households | - | 1,686 (26.5%) |
| 2-Person Households | 2,210 (34.7%) | 408 (6.4%) |
| 3-Person Households | 857 (13.5%) | 71 (1.1%) |
| 4-Person Households | 645 (10.1%) | 28 (0.4%) |
| 5-Person Households | 332 (5.2%) | 0 (0.0%) |
| 6-Person Households | 71 (1.1%) | 0 (0.0%) |
| 7+ Person Households | 66 (1.0%) | 0 (0.0%) |
| Total | 4,181 (65.6%) | 2,193 (34.4%) |
Female Fertility in Los Osos
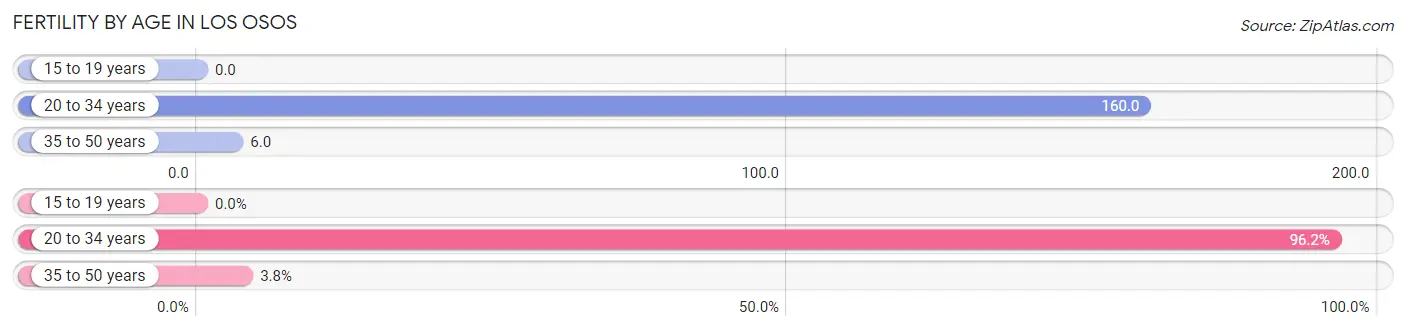
Fertility by Age in Los Osos
Average fertility rate in Los Osos is 72.0 births per 1,000 women. Women in the age bracket of 20 to 34 years have the highest fertility rate with 160.0 births per 1,000 women. Women in the age bracket of 20 to 34 years acount for 96.2% of all women with births.
| Age Bracket | Women with Births | Births / 1,000 Women |
| 15 to 19 years | 0 (0.0%) | 0.0 |
| 20 to 34 years | 201 (96.2%) | 160.0 |
| 35 to 50 years | 8 (3.8%) | 6.0 |
| Total | 209 (100.0%) | 72.0 |
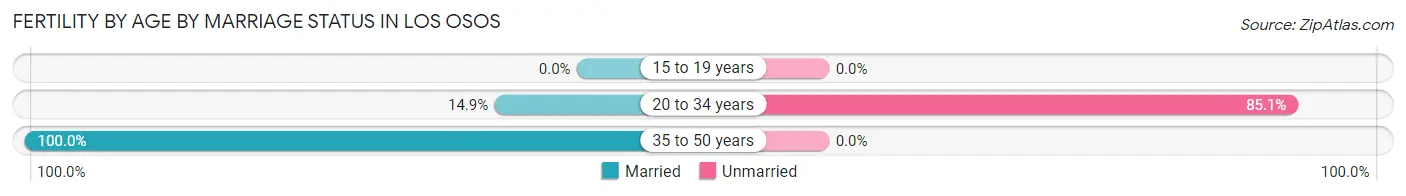
Fertility by Age by Marriage Status in Los Osos
18.2% of women with births (209) in Los Osos are married. The highest percentage of unmarried women with births falls into 20 to 34 years age bracket with 85.1% of them unmarried at the time of birth, while the lowest percentage of unmarried women with births belong to 35 to 50 years age bracket with 0.0% of them unmarried.
| Age Bracket | Married | Unmarried |
| 15 to 19 years | 0 (0.0%) | 0 (0.0%) |
| 20 to 34 years | 30 (14.9%) | 171 (85.1%) |
| 35 to 50 years | 8 (100.0%) | 0 (0.0%) |
| Total | 38 (18.2%) | 171 (81.8%) |
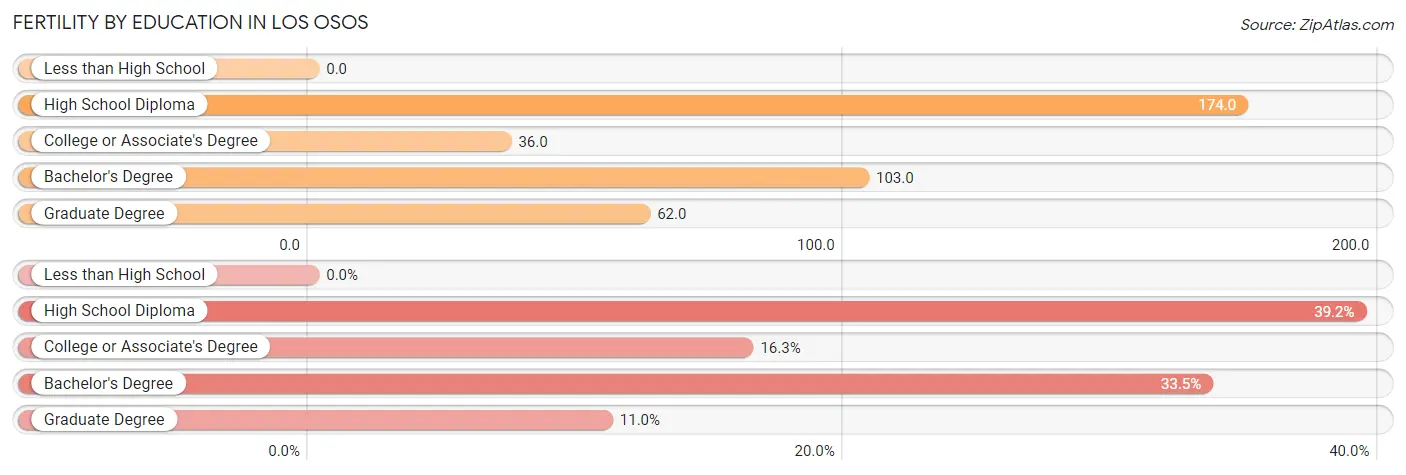
Fertility by Education in Los Osos
| Educational Attainment | Women with Births | Births / 1,000 Women |
| Less than High School | 0 (0.0%) | 0.0 |
| High School Diploma | 82 (39.2%) | 174.0 |
| College or Associate's Degree | 34 (16.3%) | 36.0 |
| Bachelor's Degree | 70 (33.5%) | 103.0 |
| Graduate Degree | 23 (11.0%) | 62.0 |
| Total | 209 (100.0%) | 72.0 |
Fertility by Education by Marriage Status in Los Osos
81.8% of women with births in Los Osos are unmarried. Women with the educational attainment of bachelor's degree are most likely to be married with 54.3% of them married at childbirth, while women with the educational attainment of high school diploma are least likely to be married with 100.0% of them unmarried at childbirth.
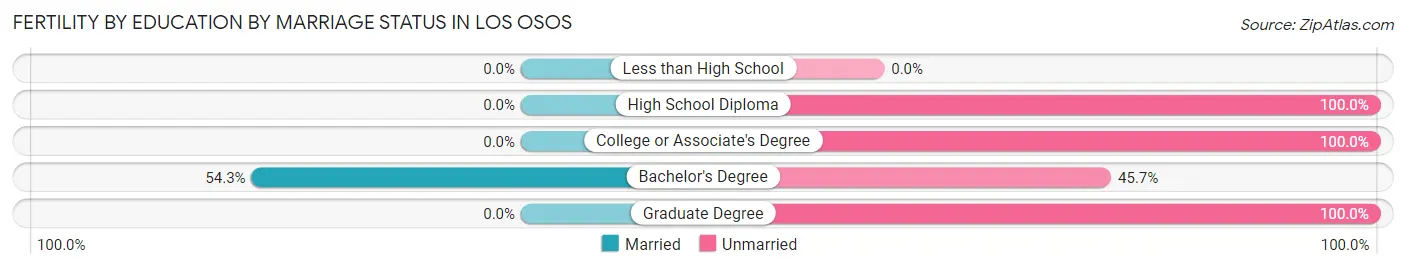
| Educational Attainment | Married | Unmarried |
| Less than High School | 0 (0.0%) | 0 (0.0%) |
| High School Diploma | 0 (0.0%) | 82 (100.0%) |
| College or Associate's Degree | 0 (0.0%) | 34 (100.0%) |
| Bachelor's Degree | 38 (54.3%) | 32 (45.7%) |
| Graduate Degree | 0 (0.0%) | 23 (100.0%) |
| Total | 38 (18.2%) | 171 (81.8%) |
Employment Characteristics in Los Osos
Employment by Class of Employer in Los Osos
Among the 7,224 employed individuals in Los Osos, private company employees (3,837 | 53.1%), self-employed (not incorporated) (1,031 | 14.3%), and state government employees (786 | 10.9%) make up the most common classes of employment.
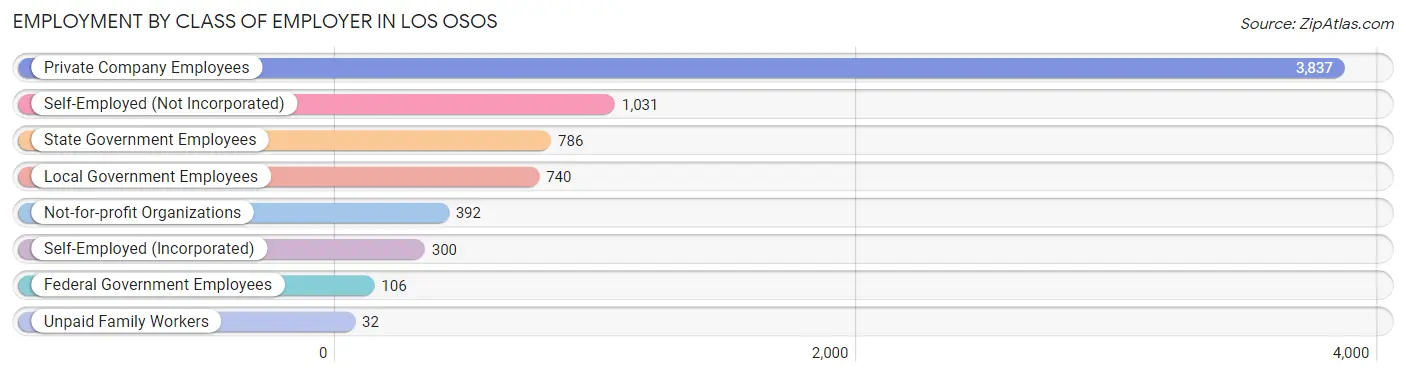
| Employer Class | # Employees | % Employees |
| Private Company Employees | 3,837 | 53.1% |
| Self-Employed (Incorporated) | 300 | 4.2% |
| Self-Employed (Not Incorporated) | 1,031 | 14.3% |
| Not-for-profit Organizations | 392 | 5.4% |
| Local Government Employees | 740 | 10.2% |
| State Government Employees | 786 | 10.9% |
| Federal Government Employees | 106 | 1.5% |
| Unpaid Family Workers | 32 | 0.4% |
| Total | 7,224 | 100.0% |
Employment Status by Age in Los Osos
According to the labor force statistics for Los Osos, out of the total population over 16 years of age (13,019), 59.5% or 7,746 individuals are in the labor force, with 5.6% or 434 of them unemployed. The age group with the highest labor force participation rate is 25 to 29 years, with 91.1% or 593 individuals in the labor force. Within the labor force, the 16 to 19 years age range has the highest percentage of unemployed individuals, with 23.0% or 60 of them being unemployed.
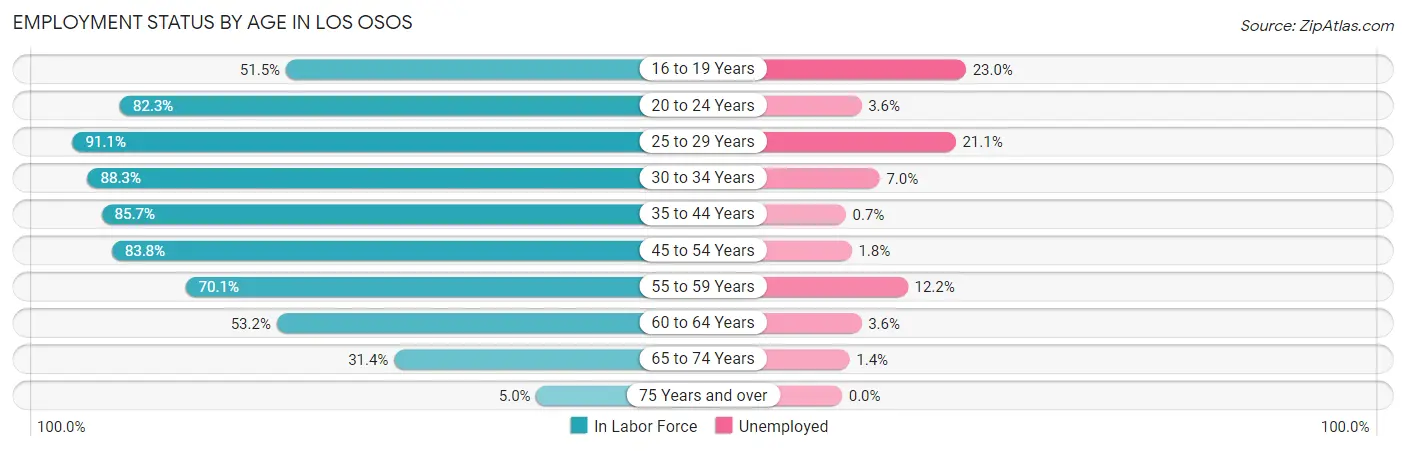
| Age Bracket | In Labor Force | Unemployed |
| 16 to 19 Years | 261 (51.5%) | 60 (23.0%) |
| 20 to 24 Years | 732 (82.3%) | 26 (3.6%) |
| 25 to 29 Years | 593 (91.1%) | 125 (21.1%) |
| 30 to 34 Years | 977 (88.3%) | 68 (7.0%) |
| 35 to 44 Years | 1,595 (85.7%) | 11 (0.7%) |
| 45 to 54 Years | 1,354 (83.8%) | 24 (1.8%) |
| 55 to 59 Years | 640 (70.1%) | 78 (12.2%) |
| 60 to 64 Years | 720 (53.2%) | 26 (3.6%) |
| 65 to 74 Years | 793 (31.4%) | 11 (1.4%) |
| 75 Years and over | 80 (5.0%) | 0 (0.0%) |
| Total | 7,746 (59.5%) | 434 (5.6%) |
Employment Status by Educational Attainment in Los Osos
According to labor force statistics for Los Osos, 78.4% of individuals (5,881) out of the total population between 25 and 64 years of age (7,501) are in the labor force, with 5.7% or 335 of them being unemployed. The group with the highest labor force participation rate are those with the educational attainment of bachelor's degree or higher, with 84.1% or 2,807 individuals in the labor force. Within the labor force, individuals with high school diploma education have the highest percentage of unemployment, with 11.9% or 105 of them being unemployed.
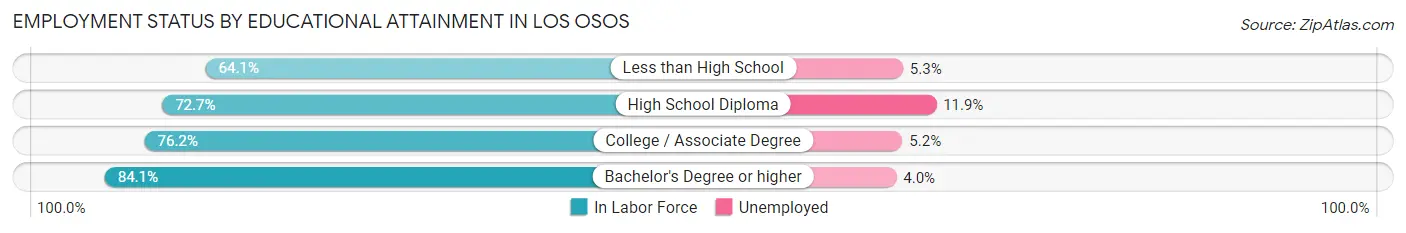
| Educational Attainment | In Labor Force | Unemployed |
| Less than High School | 300 (64.1%) | 25 (5.3%) |
| High School Diploma | 883 (72.7%) | 144 (11.9%) |
| College / Associate Degree | 1,891 (76.2%) | 129 (5.2%) |
| Bachelor's Degree or higher | 2,807 (84.1%) | 134 (4.0%) |
| Total | 5,881 (78.4%) | 428 (5.7%) |
Employment Occupations by Sex in Los Osos
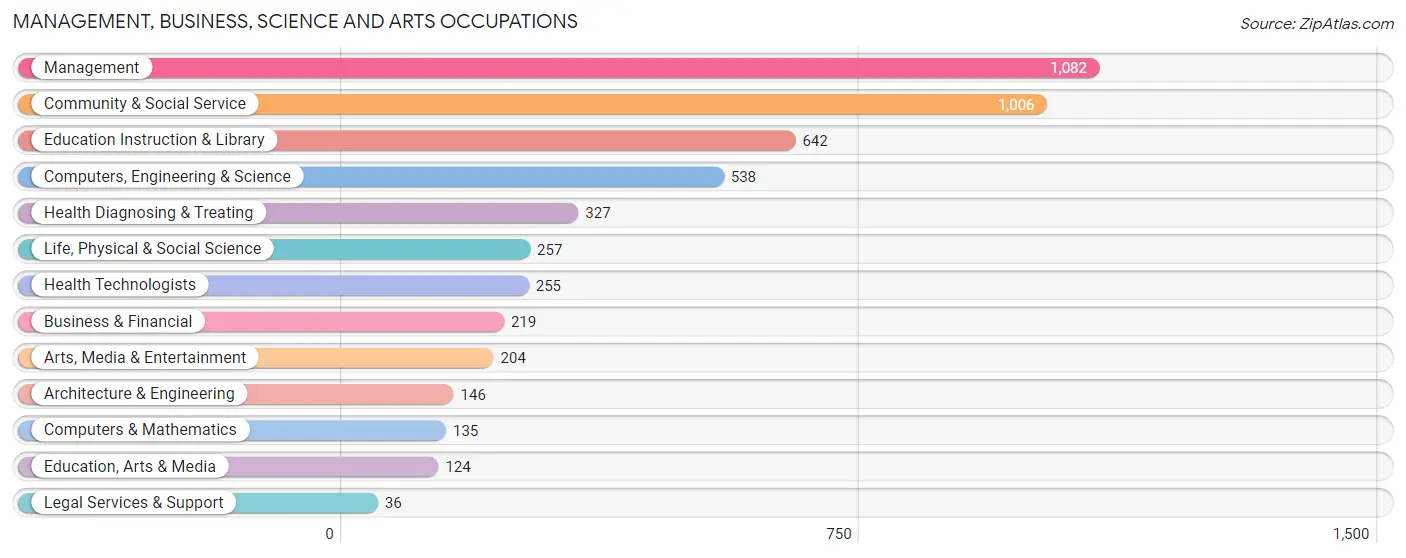
Management, Business, Science and Arts Occupations
The most common Management, Business, Science and Arts occupations in Los Osos are Management (1,082 | 14.8%), Community & Social Service (1,006 | 13.8%), Education Instruction & Library (642 | 8.8%), Computers, Engineering & Science (538 | 7.4%), and Health Diagnosing & Treating (327 | 4.5%).
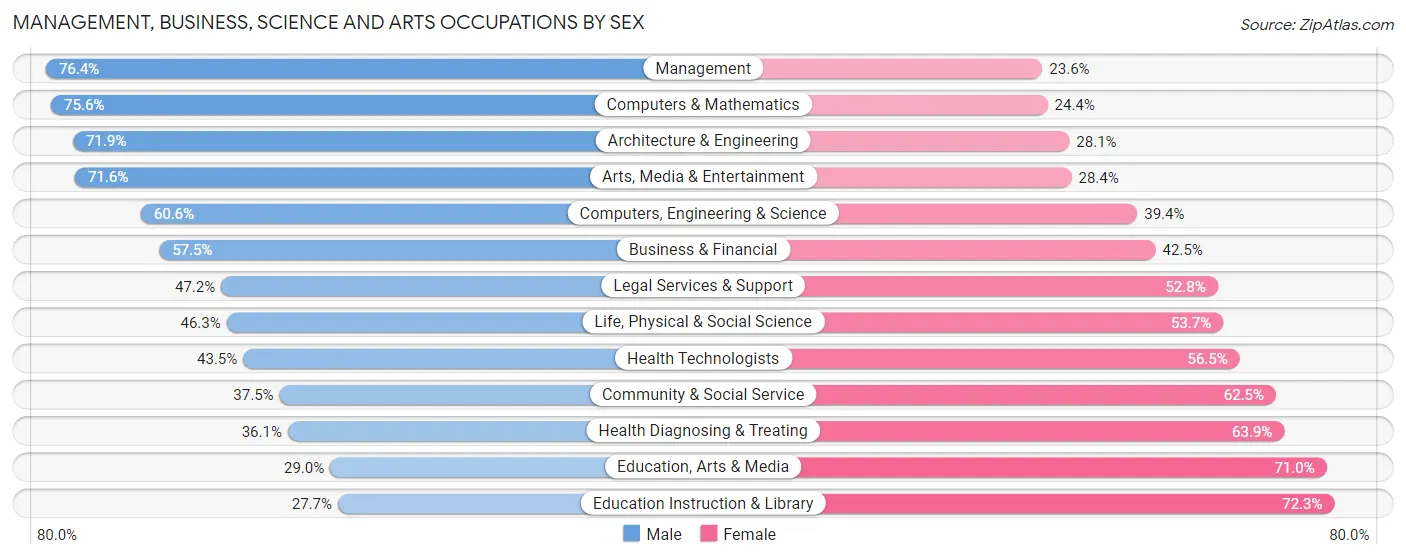
Management, Business, Science and Arts Occupations by Sex
Within the Management, Business, Science and Arts occupations in Los Osos, the most male-oriented occupations are Management (76.4%), Computers & Mathematics (75.6%), and Architecture & Engineering (71.9%), while the most female-oriented occupations are Education Instruction & Library (72.3%), Education, Arts & Media (71.0%), and Health Diagnosing & Treating (63.9%).
| Occupation | Male | Female |
| Management | 827 (76.4%) | 255 (23.6%) |
| Business & Financial | 126 (57.5%) | 93 (42.5%) |
| Computers, Engineering & Science | 326 (60.6%) | 212 (39.4%) |
| Computers & Mathematics | 102 (75.6%) | 33 (24.4%) |
| Architecture & Engineering | 105 (71.9%) | 41 (28.1%) |
| Life, Physical & Social Science | 119 (46.3%) | 138 (53.7%) |
| Community & Social Service | 377 (37.5%) | 629 (62.5%) |
| Education, Arts & Media | 36 (29.0%) | 88 (71.0%) |
| Legal Services & Support | 17 (47.2%) | 19 (52.8%) |
| Education Instruction & Library | 178 (27.7%) | 464 (72.3%) |
| Arts, Media & Entertainment | 146 (71.6%) | 58 (28.4%) |
| Health Diagnosing & Treating | 118 (36.1%) | 209 (63.9%) |
| Health Technologists | 111 (43.5%) | 144 (56.5%) |
| Total (Category) | 1,774 (55.9%) | 1,398 (44.1%) |
| Total (Overall) | 4,036 (55.2%) | 3,278 (44.8%) |
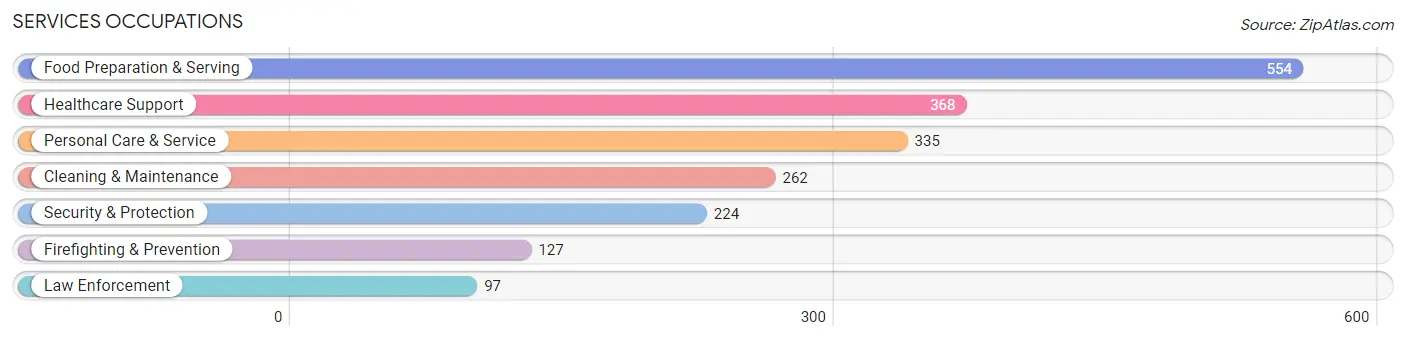
Services Occupations
The most common Services occupations in Los Osos are Food Preparation & Serving (554 | 7.6%), Healthcare Support (368 | 5.0%), Personal Care & Service (335 | 4.6%), Cleaning & Maintenance (262 | 3.6%), and Security & Protection (224 | 3.1%).
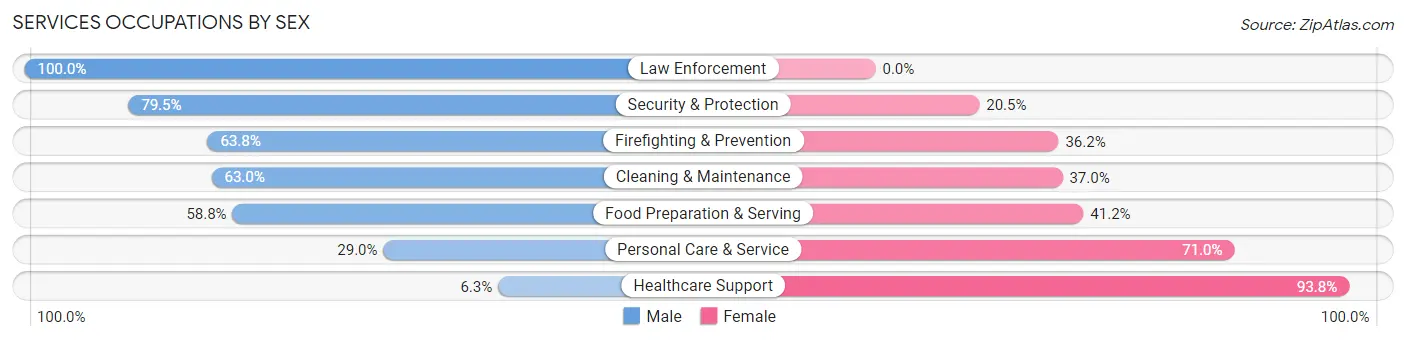
Services Occupations by Sex
Within the Services occupations in Los Osos, the most male-oriented occupations are Law Enforcement (100.0%), Security & Protection (79.5%), and Firefighting & Prevention (63.8%), while the most female-oriented occupations are Healthcare Support (93.8%), Personal Care & Service (71.0%), and Food Preparation & Serving (41.2%).
| Occupation | Male | Female |
| Healthcare Support | 23 (6.2%) | 345 (93.8%) |
| Security & Protection | 178 (79.5%) | 46 (20.5%) |
| Firefighting & Prevention | 81 (63.8%) | 46 (36.2%) |
| Law Enforcement | 97 (100.0%) | 0 (0.0%) |
| Food Preparation & Serving | 326 (58.8%) | 228 (41.2%) |
| Cleaning & Maintenance | 165 (63.0%) | 97 (37.0%) |
| Personal Care & Service | 97 (29.0%) | 238 (71.0%) |
| Total (Category) | 789 (45.3%) | 954 (54.7%) |
| Total (Overall) | 4,036 (55.2%) | 3,278 (44.8%) |
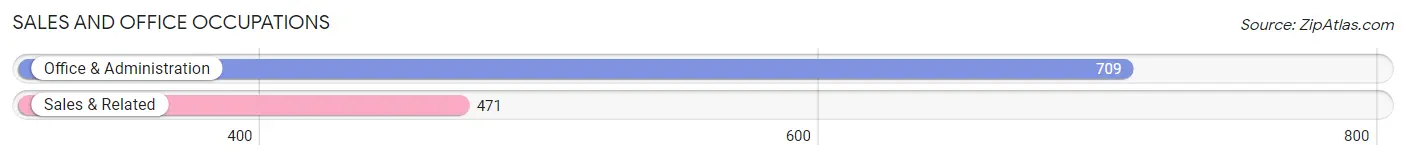
Sales and Office Occupations
The most common Sales and Office occupations in Los Osos are Office & Administration (709 | 9.7%), and Sales & Related (471 | 6.4%).
Sales and Office Occupations by Sex
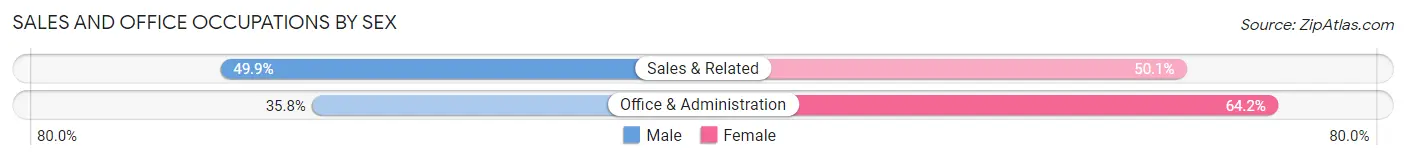
| Occupation | Male | Female |
| Sales & Related | 235 (49.9%) | 236 (50.1%) |
| Office & Administration | 254 (35.8%) | 455 (64.2%) |
| Total (Category) | 489 (41.4%) | 691 (58.6%) |
| Total (Overall) | 4,036 (55.2%) | 3,278 (44.8%) |
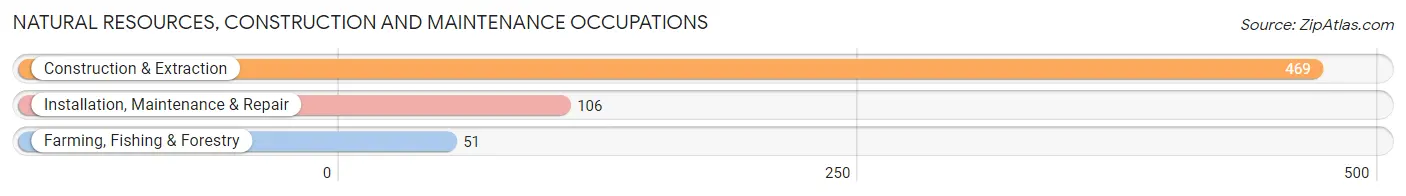
Natural Resources, Construction and Maintenance Occupations
The most common Natural Resources, Construction and Maintenance occupations in Los Osos are Construction & Extraction (469 | 6.4%), Installation, Maintenance & Repair (106 | 1.5%), and Farming, Fishing & Forestry (51 | 0.7%).
Natural Resources, Construction and Maintenance Occupations by Sex
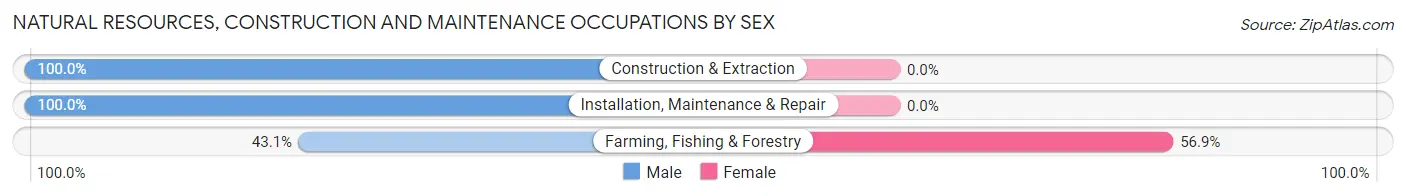
| Occupation | Male | Female |
| Farming, Fishing & Forestry | 22 (43.1%) | 29 (56.9%) |
| Construction & Extraction | 469 (100.0%) | 0 (0.0%) |
| Installation, Maintenance & Repair | 106 (100.0%) | 0 (0.0%) |
| Total (Category) | 597 (95.4%) | 29 (4.6%) |
| Total (Overall) | 4,036 (55.2%) | 3,278 (44.8%) |
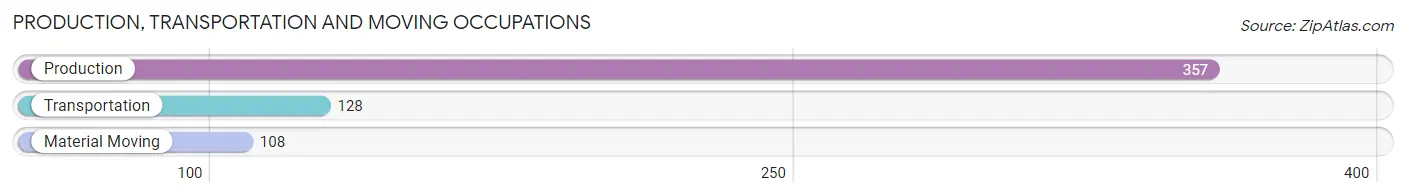
Production, Transportation and Moving Occupations
The most common Production, Transportation and Moving occupations in Los Osos are Production (357 | 4.9%), Transportation (128 | 1.8%), and Material Moving (108 | 1.5%).
Production, Transportation and Moving Occupations by Sex
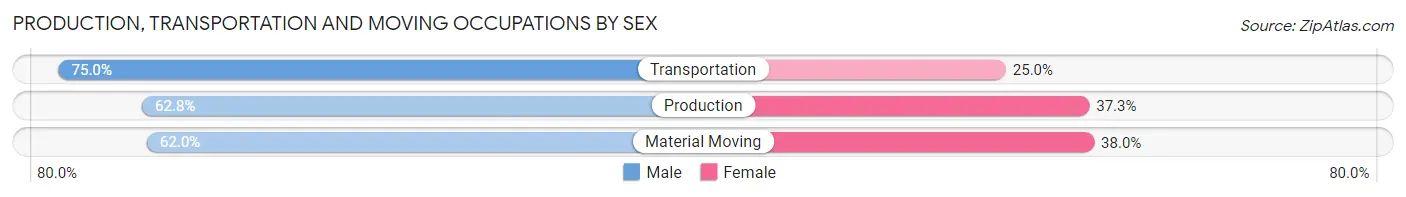
| Occupation | Male | Female |
| Production | 224 (62.7%) | 133 (37.2%) |
| Transportation | 96 (75.0%) | 32 (25.0%) |
| Material Moving | 67 (62.0%) | 41 (38.0%) |
| Total (Category) | 387 (65.3%) | 206 (34.7%) |
| Total (Overall) | 4,036 (55.2%) | 3,278 (44.8%) |
Employment Industries by Sex in Los Osos
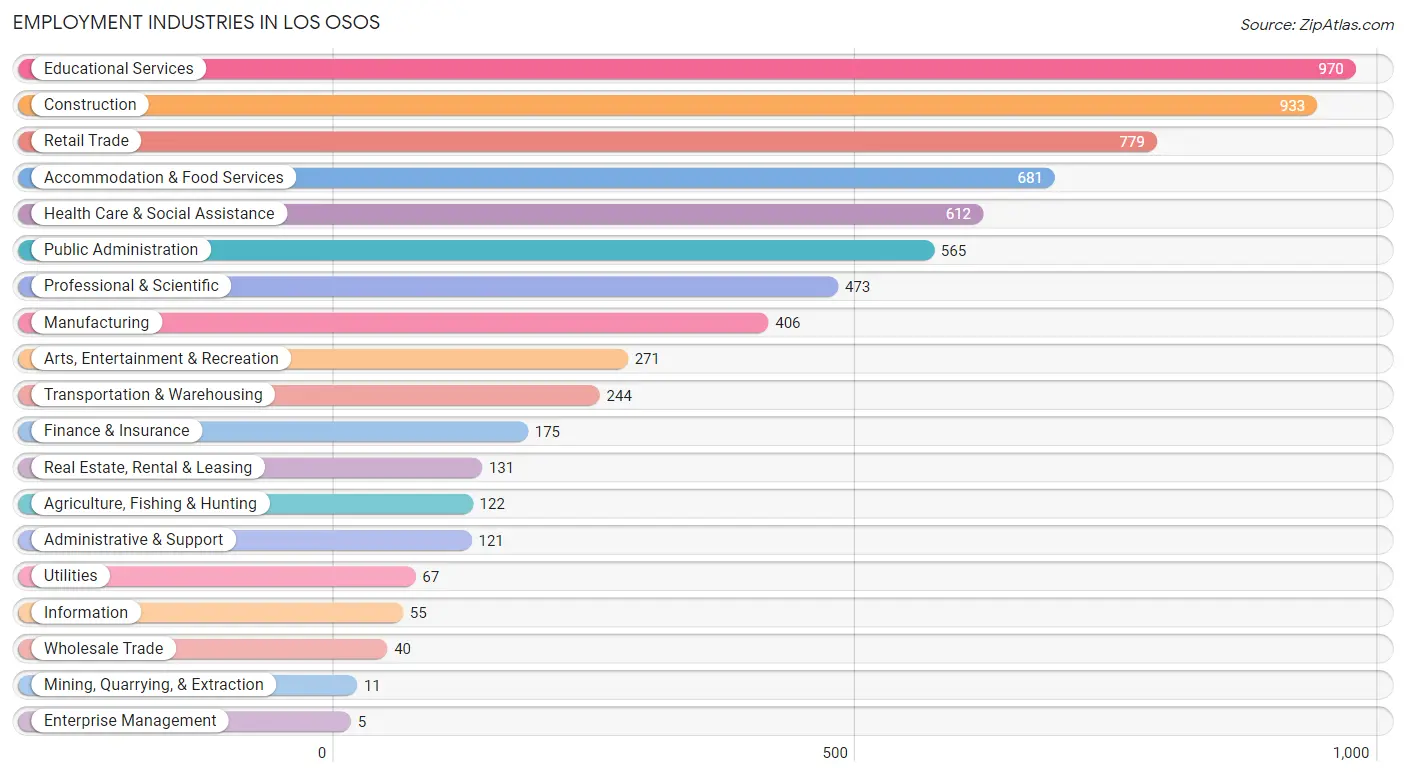
Employment Industries in Los Osos
The major employment industries in Los Osos include Educational Services (970 | 13.3%), Construction (933 | 12.8%), Retail Trade (779 | 10.6%), Accommodation & Food Services (681 | 9.3%), and Health Care & Social Assistance (612 | 8.4%).
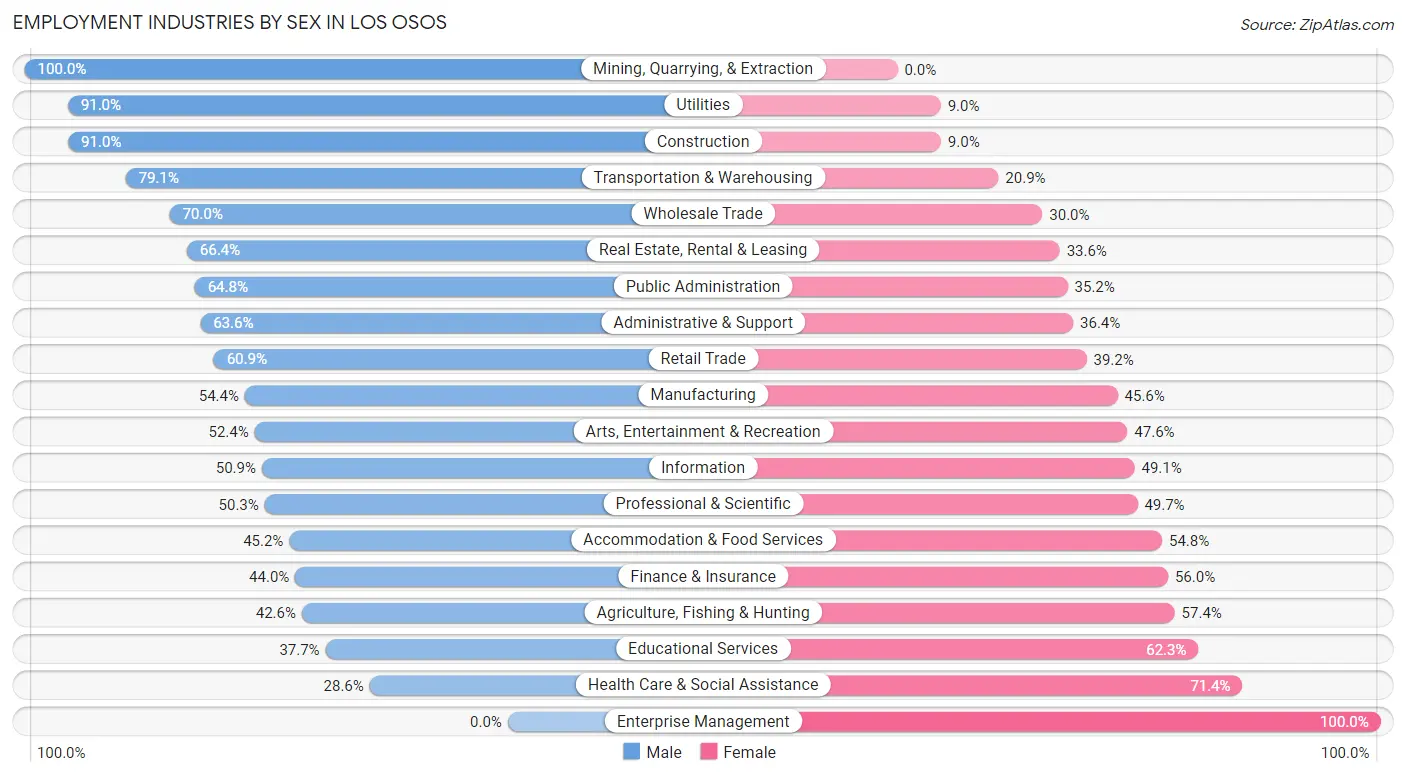
Employment Industries by Sex in Los Osos
The Los Osos industries that see more men than women are Mining, Quarrying, & Extraction (100.0%), Utilities (91.0%), and Construction (91.0%), whereas the industries that tend to have a higher number of women are Enterprise Management (100.0%), Health Care & Social Assistance (71.4%), and Educational Services (62.3%).
| Industry | Male | Female |
| Agriculture, Fishing & Hunting | 52 (42.6%) | 70 (57.4%) |
| Mining, Quarrying, & Extraction | 11 (100.0%) | 0 (0.0%) |
| Construction | 849 (91.0%) | 84 (9.0%) |
| Manufacturing | 221 (54.4%) | 185 (45.6%) |
| Wholesale Trade | 28 (70.0%) | 12 (30.0%) |
| Retail Trade | 474 (60.9%) | 305 (39.2%) |
| Transportation & Warehousing | 193 (79.1%) | 51 (20.9%) |
| Utilities | 61 (91.0%) | 6 (9.0%) |
| Information | 28 (50.9%) | 27 (49.1%) |
| Finance & Insurance | 77 (44.0%) | 98 (56.0%) |
| Real Estate, Rental & Leasing | 87 (66.4%) | 44 (33.6%) |
| Professional & Scientific | 238 (50.3%) | 235 (49.7%) |
| Enterprise Management | 0 (0.0%) | 5 (100.0%) |
| Administrative & Support | 77 (63.6%) | 44 (36.4%) |
| Educational Services | 366 (37.7%) | 604 (62.3%) |
| Health Care & Social Assistance | 175 (28.6%) | 437 (71.4%) |
| Arts, Entertainment & Recreation | 142 (52.4%) | 129 (47.6%) |
| Accommodation & Food Services | 308 (45.2%) | 373 (54.8%) |
| Public Administration | 366 (64.8%) | 199 (35.2%) |
| Total | 4,036 (55.2%) | 3,278 (44.8%) |
Education in Los Osos
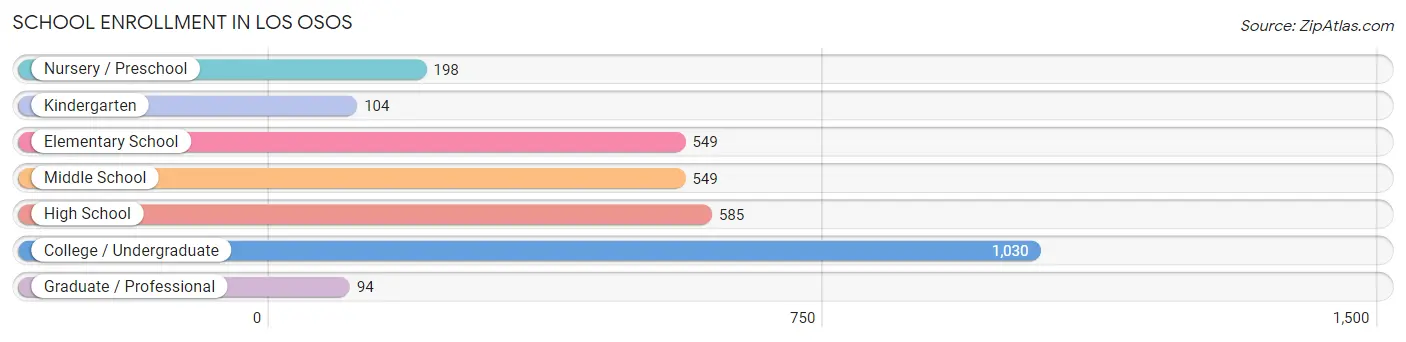
School Enrollment in Los Osos
The most common levels of schooling among the 3,109 students in Los Osos are college / undergraduate (1,030 | 33.1%), high school (585 | 18.8%), and elementary school (549 | 17.7%).
| School Level | # Students | % Students |
| Nursery / Preschool | 198 | 6.4% |
| Kindergarten | 104 | 3.4% |
| Elementary School | 549 | 17.7% |
| Middle School | 549 | 17.7% |
| High School | 585 | 18.8% |
| College / Undergraduate | 1,030 | 33.1% |
| Graduate / Professional | 94 | 3.0% |
| Total | 3,109 | 100.0% |
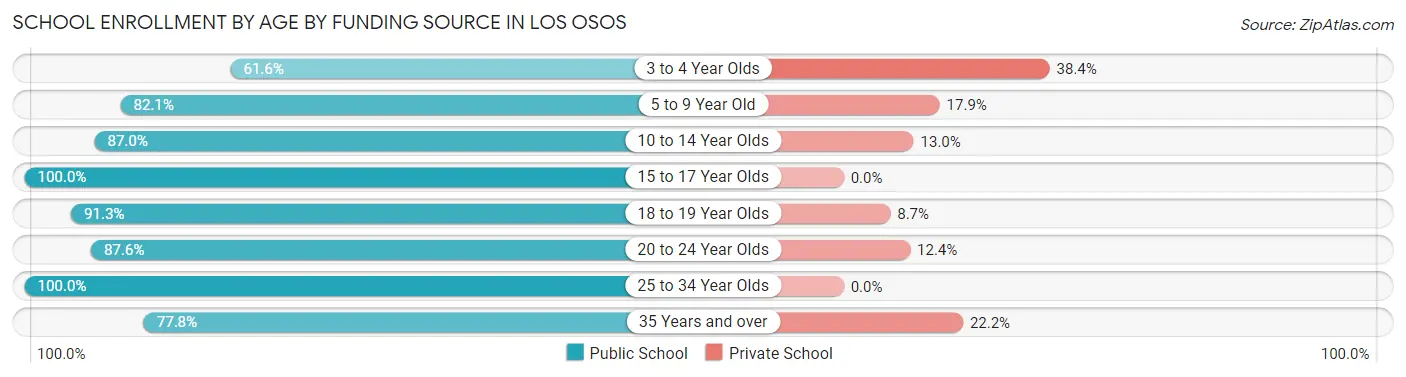
School Enrollment by Age by Funding Source in Los Osos
Out of a total of 3,109 students who are enrolled in schools in Los Osos, 398 (12.8%) attend a private institution, while the remaining 2,711 (87.2%) are enrolled in public schools. The age group of 3 to 4 year olds has the highest likelihood of being enrolled in private schools, with 56 (38.4% in the age bracket) enrolled. Conversely, the age group of 15 to 17 year olds has the lowest likelihood of being enrolled in a private school, with 457 (100.0% in the age bracket) attending a public institution.
| Age Bracket | Public School | Private School |
| 3 to 4 Year Olds | 90 (61.6%) | 56 (38.4%) |
| 5 to 9 Year Old | 551 (82.1%) | 120 (17.9%) |
| 10 to 14 Year Olds | 594 (87.0%) | 89 (13.0%) |
| 15 to 17 Year Olds | 457 (100.0%) | 0 (0.0%) |
| 18 to 19 Year Olds | 200 (91.3%) | 19 (8.7%) |
| 20 to 24 Year Olds | 510 (87.6%) | 72 (12.4%) |
| 25 to 34 Year Olds | 162 (100.0%) | 0 (0.0%) |
| 35 Years and over | 147 (77.8%) | 42 (22.2%) |
| Total | 2,711 (87.2%) | 398 (12.8%) |
Educational Attainment by Field of Study in Los Osos
Business (803 | 13.6%), science & technology (678 | 11.5%), bio, nature & agricultural (601 | 10.2%), social sciences (547 | 9.3%), and psychology (537 | 9.1%) are the most common fields of study among 5,893 individuals in Los Osos who have obtained a bachelor's degree or higher.
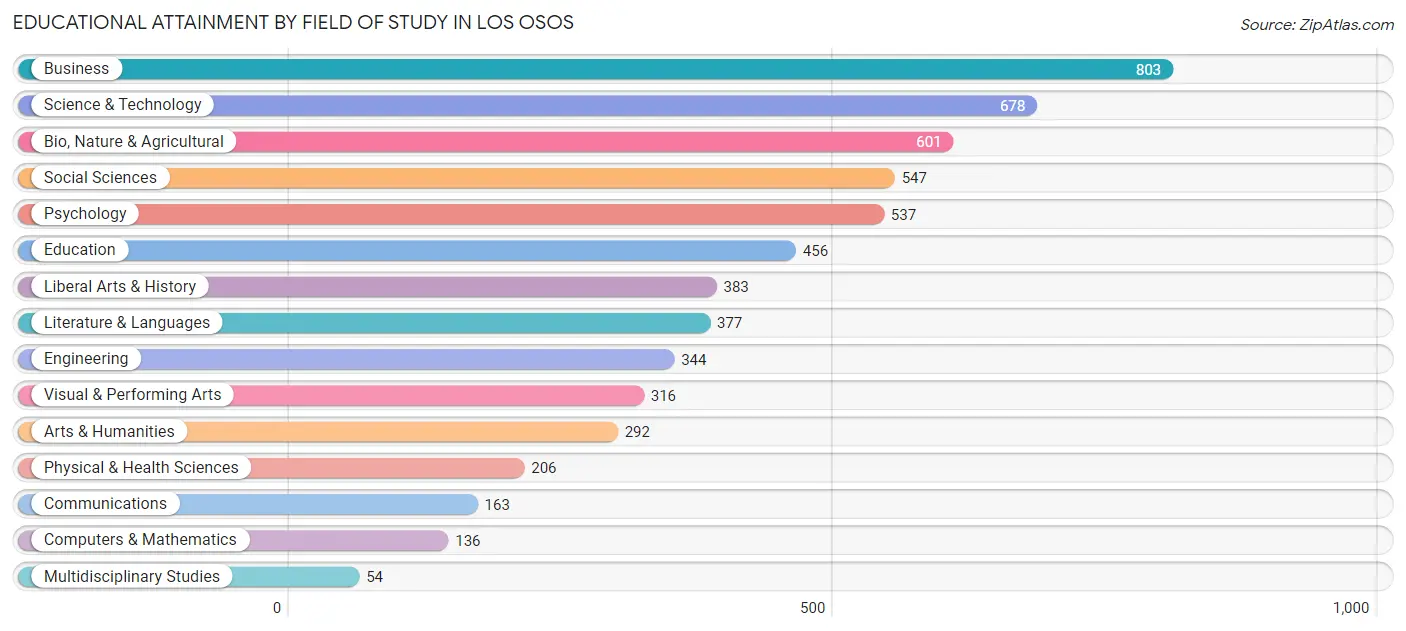
| Field of Study | # Graduates | % Graduates |
| Computers & Mathematics | 136 | 2.3% |
| Bio, Nature & Agricultural | 601 | 10.2% |
| Physical & Health Sciences | 206 | 3.5% |
| Psychology | 537 | 9.1% |
| Social Sciences | 547 | 9.3% |
| Engineering | 344 | 5.8% |
| Multidisciplinary Studies | 54 | 0.9% |
| Science & Technology | 678 | 11.5% |
| Business | 803 | 13.6% |
| Education | 456 | 7.7% |
| Literature & Languages | 377 | 6.4% |
| Liberal Arts & History | 383 | 6.5% |
| Visual & Performing Arts | 316 | 5.4% |
| Communications | 163 | 2.8% |
| Arts & Humanities | 292 | 5.0% |
| Total | 5,893 | 100.0% |
Transportation & Commute in Los Osos
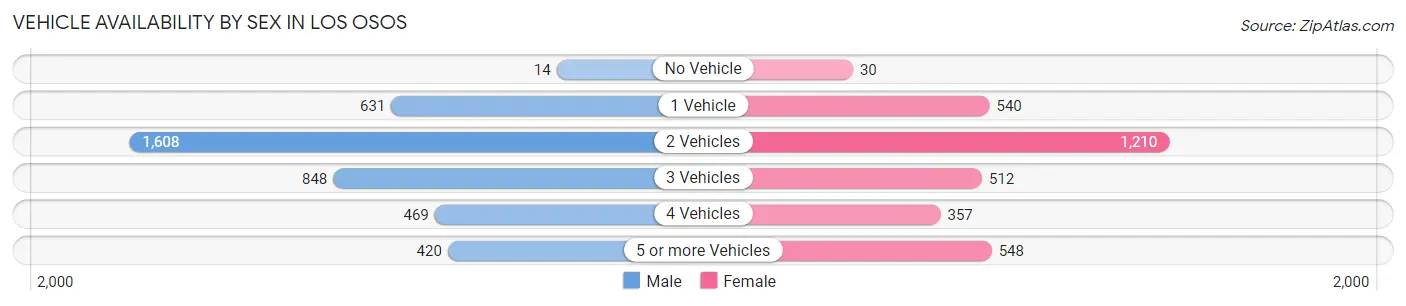
Vehicle Availability by Sex in Los Osos
The most prevalent vehicle ownership categories in Los Osos are males with 2 vehicles (1,608, accounting for 40.3%) and females with 2 vehicles (1,210, making up 50.3%).
| Vehicles Available | Male | Female |
| No Vehicle | 14 (0.4%) | 30 (0.9%) |
| 1 Vehicle | 631 (15.8%) | 540 (16.9%) |
| 2 Vehicles | 1,608 (40.3%) | 1,210 (37.9%) |
| 3 Vehicles | 848 (21.2%) | 512 (16.0%) |
| 4 Vehicles | 469 (11.7%) | 357 (11.2%) |
| 5 or more Vehicles | 420 (10.5%) | 548 (17.1%) |
| Total | 3,990 (100.0%) | 3,197 (100.0%) |
Commute Time in Los Osos
The most frequently occuring commute durations in Los Osos are 15 to 19 minutes (1,254 commuters, 20.1%), 20 to 24 minutes (1,226 commuters, 19.7%), and 5 to 9 minutes (934 commuters, 15.0%).
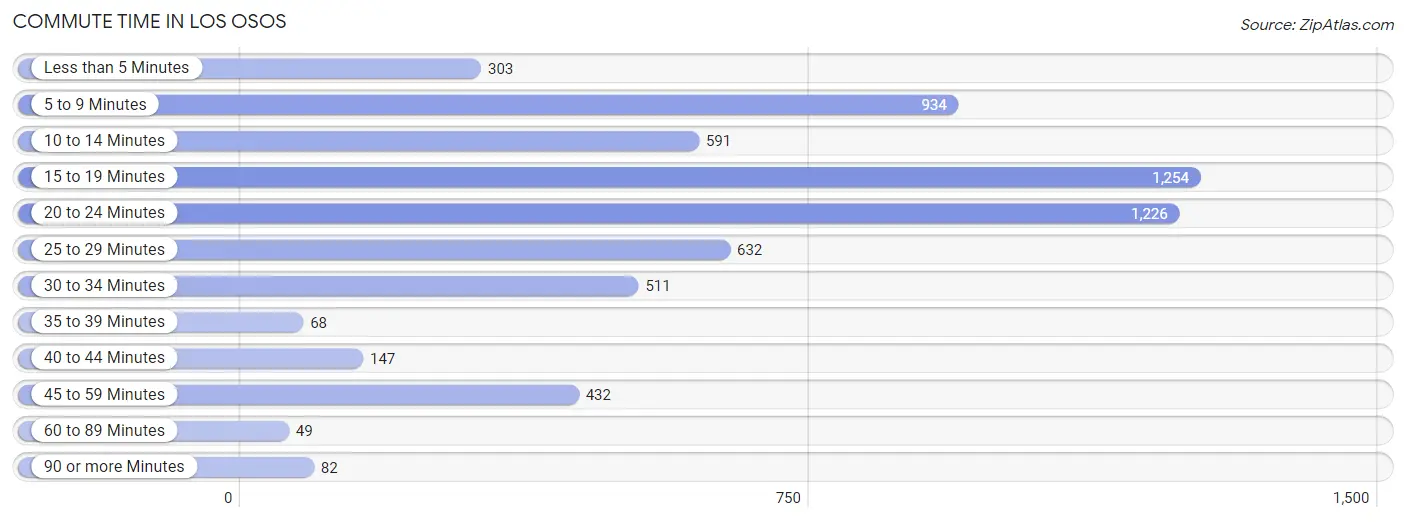
| Commute Time | # Commuters | % Commuters |
| Less than 5 Minutes | 303 | 4.9% |
| 5 to 9 Minutes | 934 | 15.0% |
| 10 to 14 Minutes | 591 | 9.5% |
| 15 to 19 Minutes | 1,254 | 20.1% |
| 20 to 24 Minutes | 1,226 | 19.7% |
| 25 to 29 Minutes | 632 | 10.2% |
| 30 to 34 Minutes | 511 | 8.2% |
| 35 to 39 Minutes | 68 | 1.1% |
| 40 to 44 Minutes | 147 | 2.4% |
| 45 to 59 Minutes | 432 | 6.9% |
| 60 to 89 Minutes | 49 | 0.8% |
| 90 or more Minutes | 82 | 1.3% |
Commute Time by Sex in Los Osos
The most common commute times in Los Osos are 20 to 24 minutes (819 commuters, 23.5%) for males and 15 to 19 minutes (489 commuters, 17.8%) for females.
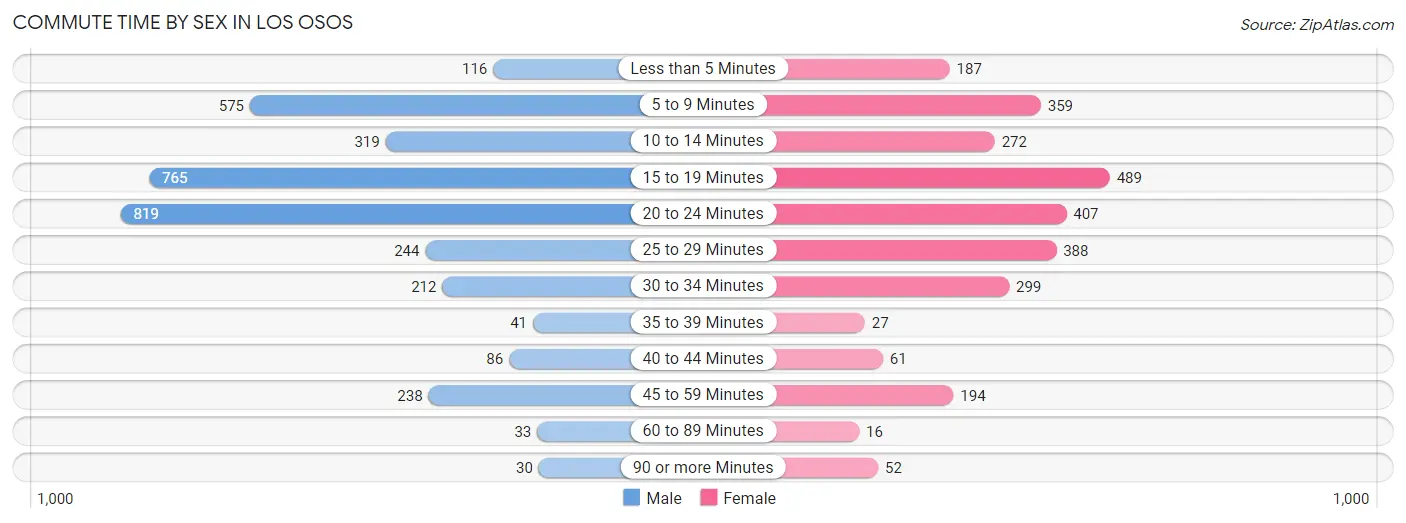
| Commute Time | Male | Female |
| Less than 5 Minutes | 116 (3.3%) | 187 (6.8%) |
| 5 to 9 Minutes | 575 (16.5%) | 359 (13.1%) |
| 10 to 14 Minutes | 319 (9.2%) | 272 (9.9%) |
| 15 to 19 Minutes | 765 (22.0%) | 489 (17.8%) |
| 20 to 24 Minutes | 819 (23.5%) | 407 (14.8%) |
| 25 to 29 Minutes | 244 (7.0%) | 388 (14.1%) |
| 30 to 34 Minutes | 212 (6.1%) | 299 (10.9%) |
| 35 to 39 Minutes | 41 (1.2%) | 27 (1.0%) |
| 40 to 44 Minutes | 86 (2.5%) | 61 (2.2%) |
| 45 to 59 Minutes | 238 (6.8%) | 194 (7.0%) |
| 60 to 89 Minutes | 33 (0.9%) | 16 (0.6%) |
| 90 or more Minutes | 30 (0.9%) | 52 (1.9%) |
Time of Departure to Work by Sex in Los Osos
The most frequent times of departure to work in Los Osos are 6:30 AM to 6:59 AM (536, 15.4%) for males and 8:00 AM to 8:29 AM (481, 17.5%) for females.
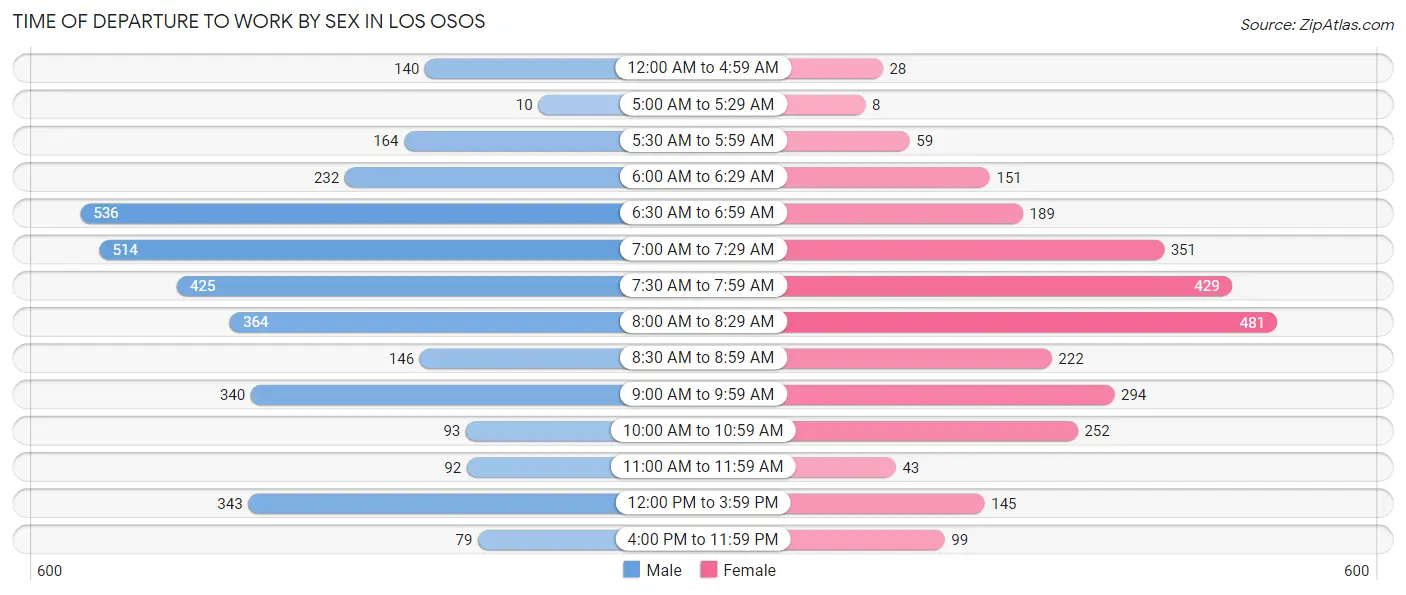
| Time of Departure | Male | Female |
| 12:00 AM to 4:59 AM | 140 (4.0%) | 28 (1.0%) |
| 5:00 AM to 5:29 AM | 10 (0.3%) | 8 (0.3%) |
| 5:30 AM to 5:59 AM | 164 (4.7%) | 59 (2.1%) |
| 6:00 AM to 6:29 AM | 232 (6.7%) | 151 (5.5%) |
| 6:30 AM to 6:59 AM | 536 (15.4%) | 189 (6.9%) |
| 7:00 AM to 7:29 AM | 514 (14.8%) | 351 (12.8%) |
| 7:30 AM to 7:59 AM | 425 (12.2%) | 429 (15.6%) |
| 8:00 AM to 8:29 AM | 364 (10.5%) | 481 (17.5%) |
| 8:30 AM to 8:59 AM | 146 (4.2%) | 222 (8.1%) |
| 9:00 AM to 9:59 AM | 340 (9.8%) | 294 (10.7%) |
| 10:00 AM to 10:59 AM | 93 (2.7%) | 252 (9.2%) |
| 11:00 AM to 11:59 AM | 92 (2.6%) | 43 (1.6%) |
| 12:00 PM to 3:59 PM | 343 (9.9%) | 145 (5.3%) |
| 4:00 PM to 11:59 PM | 79 (2.3%) | 99 (3.6%) |
| Total | 3,478 (100.0%) | 2,751 (100.0%) |
Housing Occupancy in Los Osos
Occupancy by Ownership in Los Osos
Of the total 6,374 dwellings in Los Osos, owner-occupied units account for 4,379 (68.7%), while renter-occupied units make up 1,995 (31.3%).
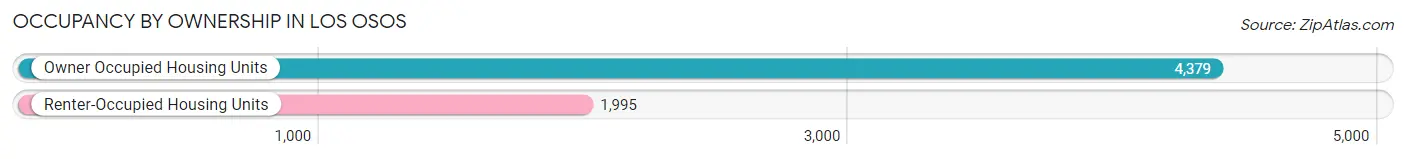
| Occupancy | # Housing Units | % Housing Units |
| Owner Occupied Housing Units | 4,379 | 68.7% |
| Renter-Occupied Housing Units | 1,995 | 31.3% |
| Total Occupied Housing Units | 6,374 | 100.0% |
Occupancy by Household Size in Los Osos
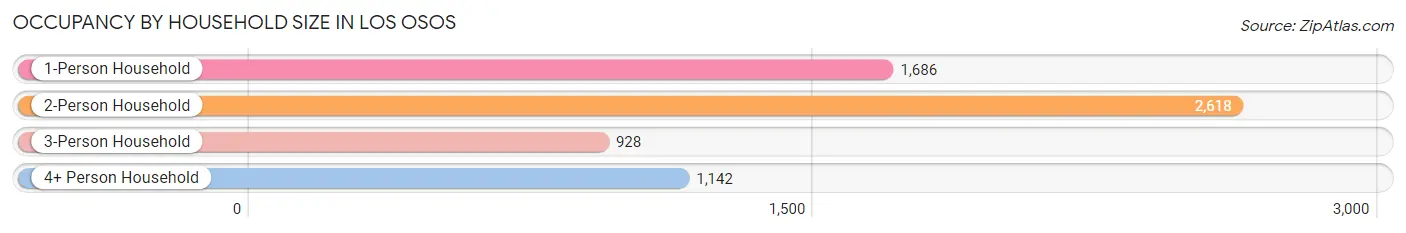
| Household Size | # Housing Units | % Housing Units |
| 1-Person Household | 1,686 | 26.5% |
| 2-Person Household | 2,618 | 41.1% |
| 3-Person Household | 928 | 14.6% |
| 4+ Person Household | 1,142 | 17.9% |
| Total Housing Units | 6,374 | 100.0% |
Occupancy by Ownership by Household Size in Los Osos
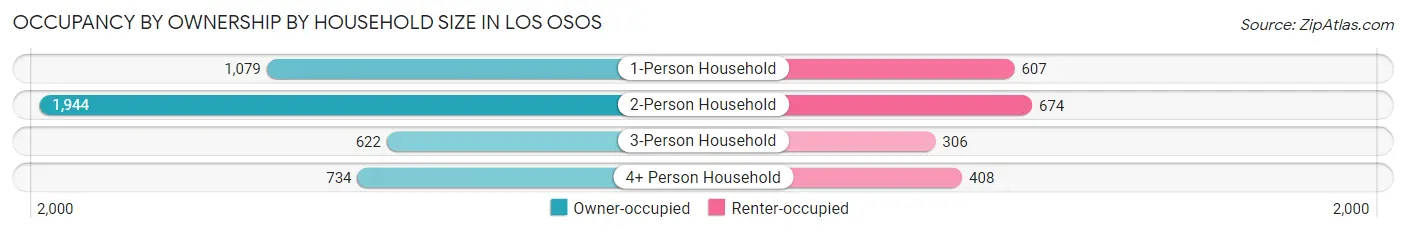
| Household Size | Owner-occupied | Renter-occupied |
| 1-Person Household | 1,079 (64.0%) | 607 (36.0%) |
| 2-Person Household | 1,944 (74.3%) | 674 (25.7%) |
| 3-Person Household | 622 (67.0%) | 306 (33.0%) |
| 4+ Person Household | 734 (64.3%) | 408 (35.7%) |
| Total Housing Units | 4,379 (68.7%) | 1,995 (31.3%) |
Occupancy by Educational Attainment in Los Osos
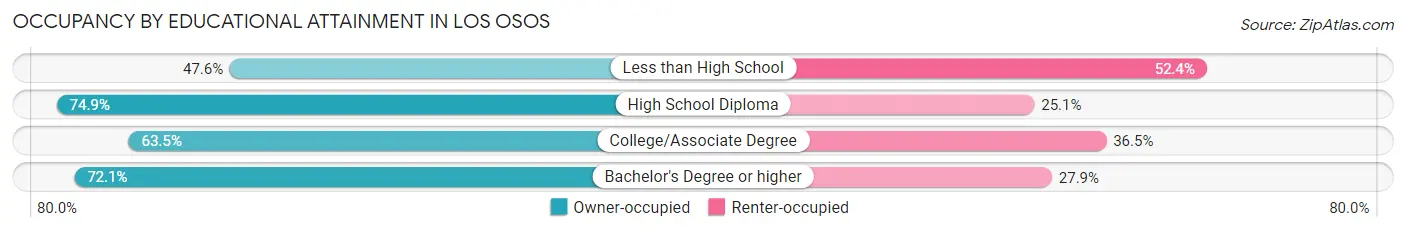
| Household Size | Owner-occupied | Renter-occupied |
| Less than High School | 88 (47.6%) | 97 (52.4%) |
| High School Diploma | 487 (74.9%) | 163 (25.1%) |
| College/Associate Degree | 1,410 (63.5%) | 810 (36.5%) |
| Bachelor's Degree or higher | 2,394 (72.1%) | 925 (27.9%) |
Occupancy by Age of Householder in Los Osos
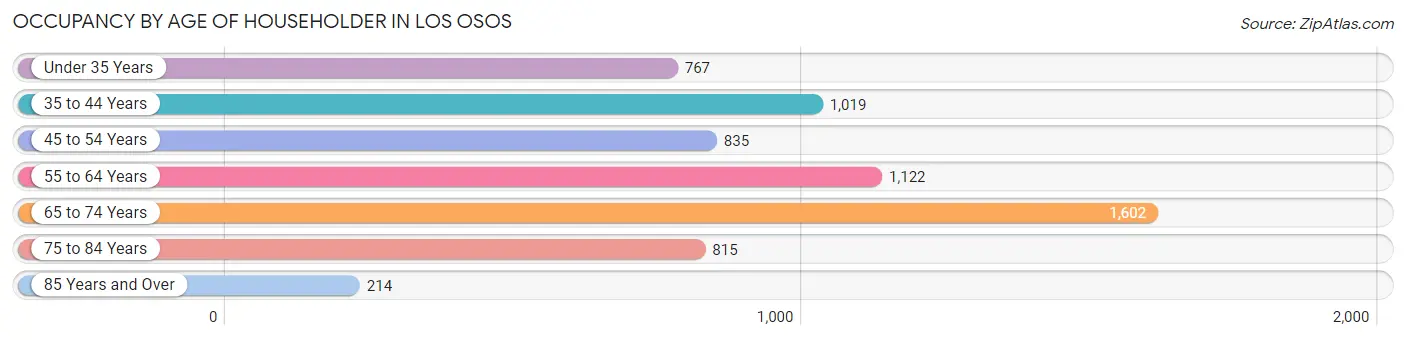
| Age Bracket | # Households | % Households |
| Under 35 Years | 767 | 12.0% |
| 35 to 44 Years | 1,019 | 16.0% |
| 45 to 54 Years | 835 | 13.1% |
| 55 to 64 Years | 1,122 | 17.6% |
| 65 to 74 Years | 1,602 | 25.1% |
| 75 to 84 Years | 815 | 12.8% |
| 85 Years and Over | 214 | 3.4% |
| Total | 6,374 | 100.0% |
Housing Finances in Los Osos
Median Income by Occupancy in Los Osos
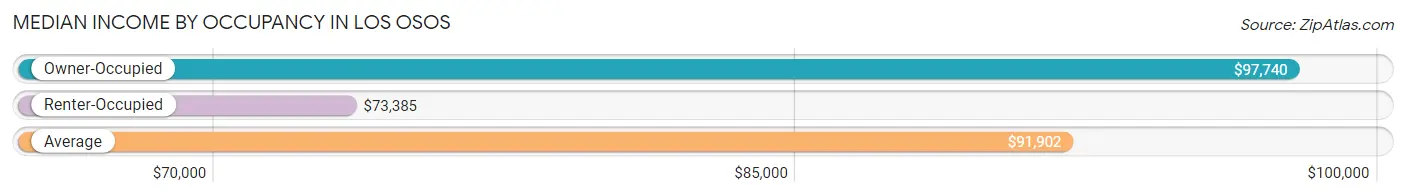
| Occupancy Type | # Households | Median Income |
| Owner-Occupied | 4,379 (68.7%) | $97,740 |
| Renter-Occupied | 1,995 (31.3%) | $73,385 |
| Average | 6,374 (100.0%) | $91,902 |
Occupancy by Householder Income Bracket in Los Osos
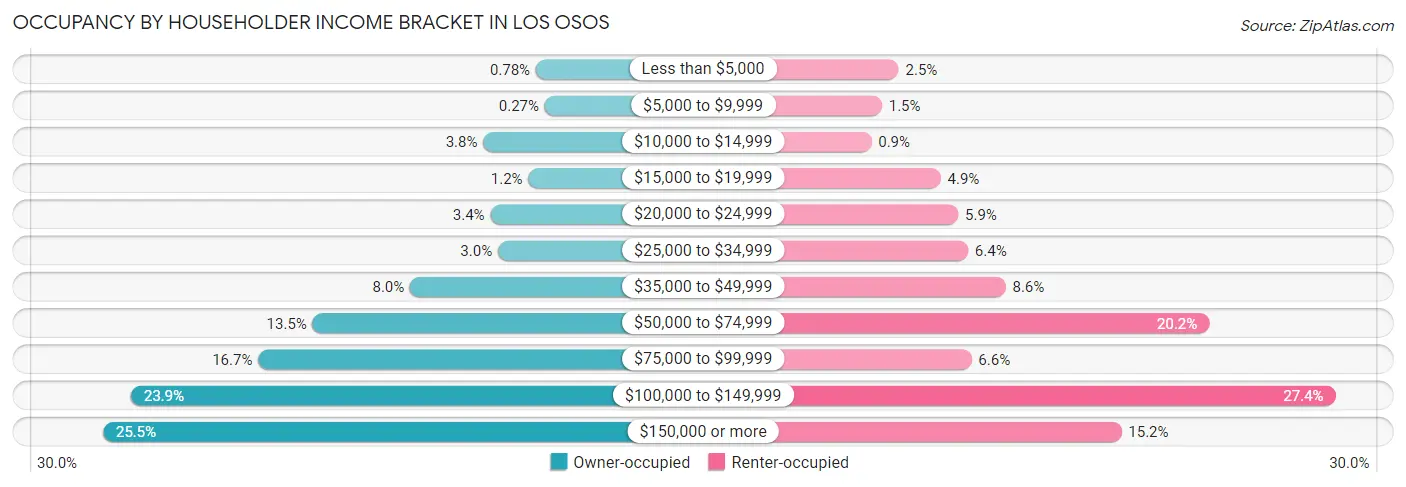
| Income Bracket | Owner-occupied | Renter-occupied |
| Less than $5,000 | 34 (0.8%) | 49 (2.5%) |
| $5,000 to $9,999 | 12 (0.3%) | 30 (1.5%) |
| $10,000 to $14,999 | 166 (3.8%) | 18 (0.9%) |
| $15,000 to $19,999 | 53 (1.2%) | 97 (4.9%) |
| $20,000 to $24,999 | 148 (3.4%) | 117 (5.9%) |
| $25,000 to $34,999 | 129 (2.9%) | 128 (6.4%) |
| $35,000 to $49,999 | 349 (8.0%) | 171 (8.6%) |
| $50,000 to $74,999 | 593 (13.5%) | 403 (20.2%) |
| $75,000 to $99,999 | 729 (16.7%) | 132 (6.6%) |
| $100,000 to $149,999 | 1,048 (23.9%) | 547 (27.4%) |
| $150,000 or more | 1,118 (25.5%) | 303 (15.2%) |
| Total | 4,379 (100.0%) | 1,995 (100.0%) |
Monthly Housing Cost Tiers in Los Osos
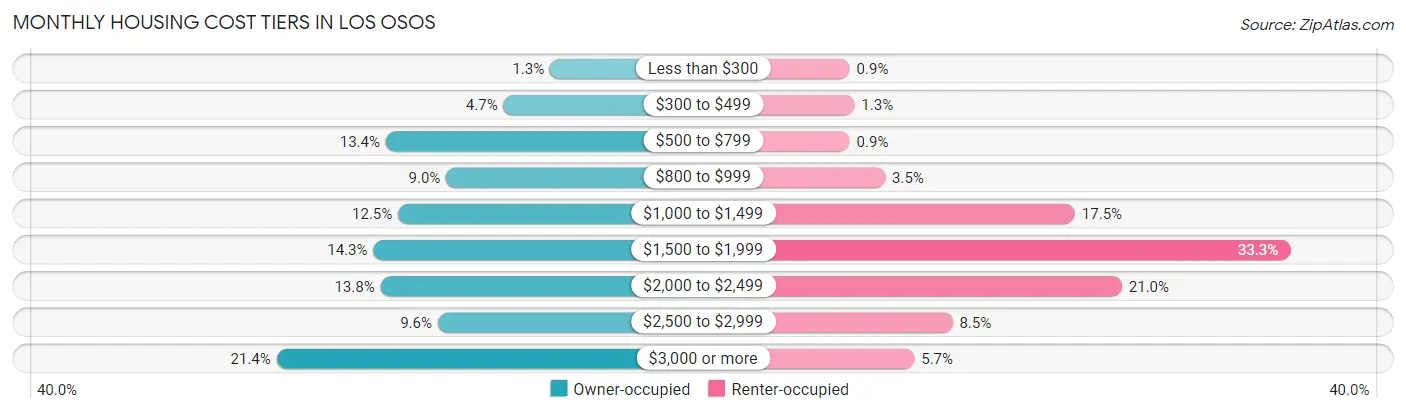
| Monthly Cost | Owner-occupied | Renter-occupied |
| Less than $300 | 57 (1.3%) | 18 (0.9%) |
| $300 to $499 | 207 (4.7%) | 25 (1.3%) |
| $500 to $799 | 587 (13.4%) | 18 (0.9%) |
| $800 to $999 | 392 (8.9%) | 70 (3.5%) |
| $1,000 to $1,499 | 547 (12.5%) | 349 (17.5%) |
| $1,500 to $1,999 | 627 (14.3%) | 665 (33.3%) |
| $2,000 to $2,499 | 604 (13.8%) | 418 (20.9%) |
| $2,500 to $2,999 | 419 (9.6%) | 169 (8.5%) |
| $3,000 or more | 939 (21.4%) | 113 (5.7%) |
| Total | 4,379 (100.0%) | 1,995 (100.0%) |
Physical Housing Characteristics in Los Osos
Housing Structures in Los Osos
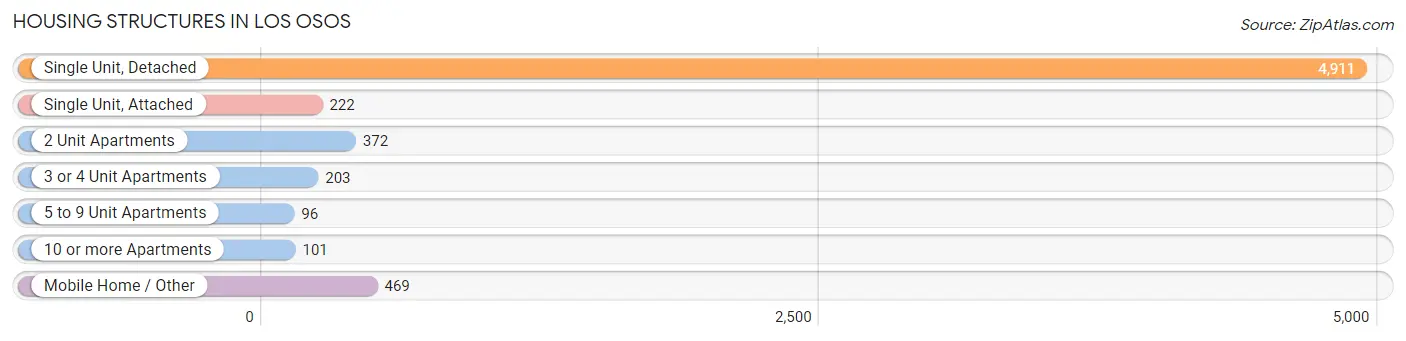
| Structure Type | # Housing Units | % Housing Units |
| Single Unit, Detached | 4,911 | 77.0% |
| Single Unit, Attached | 222 | 3.5% |
| 2 Unit Apartments | 372 | 5.8% |
| 3 or 4 Unit Apartments | 203 | 3.2% |
| 5 to 9 Unit Apartments | 96 | 1.5% |
| 10 or more Apartments | 101 | 1.6% |
| Mobile Home / Other | 469 | 7.4% |
| Total | 6,374 | 100.0% |
Housing Structures by Occupancy in Los Osos
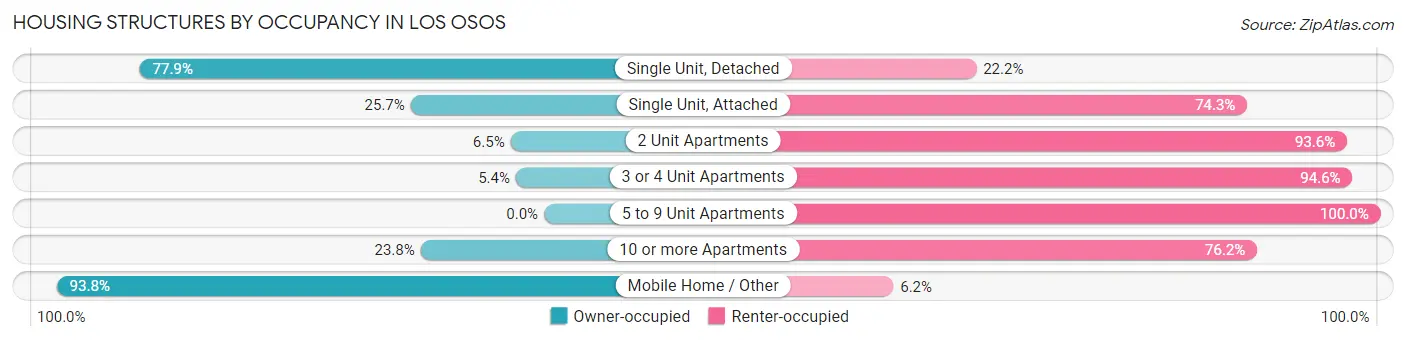
| Structure Type | Owner-occupied | Renter-occupied |
| Single Unit, Detached | 3,823 (77.8%) | 1,088 (22.2%) |
| Single Unit, Attached | 57 (25.7%) | 165 (74.3%) |
| 2 Unit Apartments | 24 (6.5%) | 348 (93.5%) |
| 3 or 4 Unit Apartments | 11 (5.4%) | 192 (94.6%) |
| 5 to 9 Unit Apartments | 0 (0.0%) | 96 (100.0%) |
| 10 or more Apartments | 24 (23.8%) | 77 (76.2%) |
| Mobile Home / Other | 440 (93.8%) | 29 (6.2%) |
| Total | 4,379 (68.7%) | 1,995 (31.3%) |
Housing Structures by Number of Rooms in Los Osos
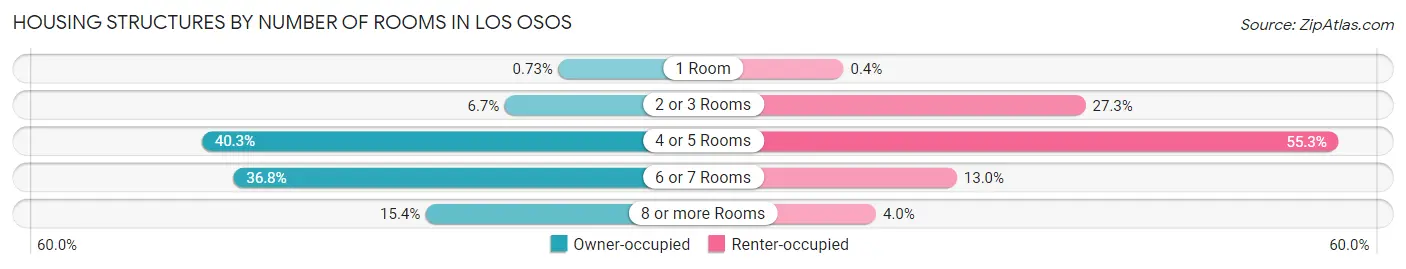
| Number of Rooms | Owner-occupied | Renter-occupied |
| 1 Room | 32 (0.7%) | 8 (0.4%) |
| 2 or 3 Rooms | 292 (6.7%) | 544 (27.3%) |
| 4 or 5 Rooms | 1,766 (40.3%) | 1,104 (55.3%) |
| 6 or 7 Rooms | 1,613 (36.8%) | 259 (13.0%) |
| 8 or more Rooms | 676 (15.4%) | 80 (4.0%) |
| Total | 4,379 (100.0%) | 1,995 (100.0%) |
Housing Structure by Heating Type in Los Osos
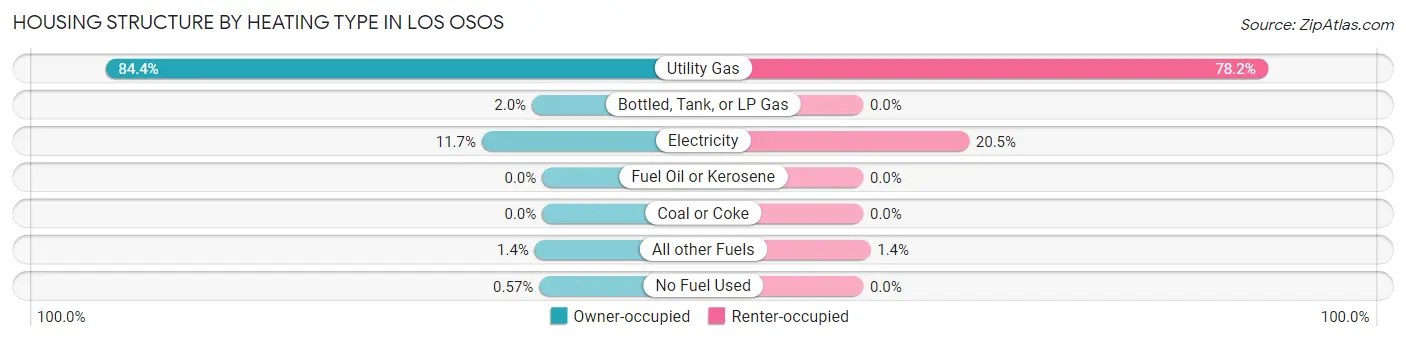
| Heating Type | Owner-occupied | Renter-occupied |
| Utility Gas | 3,695 (84.4%) | 1,559 (78.1%) |
| Bottled, Tank, or LP Gas | 86 (2.0%) | 0 (0.0%) |
| Electricity | 510 (11.7%) | 408 (20.4%) |
| Fuel Oil or Kerosene | 0 (0.0%) | 0 (0.0%) |
| Coal or Coke | 0 (0.0%) | 0 (0.0%) |
| All other Fuels | 63 (1.4%) | 28 (1.4%) |
| No Fuel Used | 25 (0.6%) | 0 (0.0%) |
| Total | 4,379 (100.0%) | 1,995 (100.0%) |
Household Vehicle Usage in Los Osos
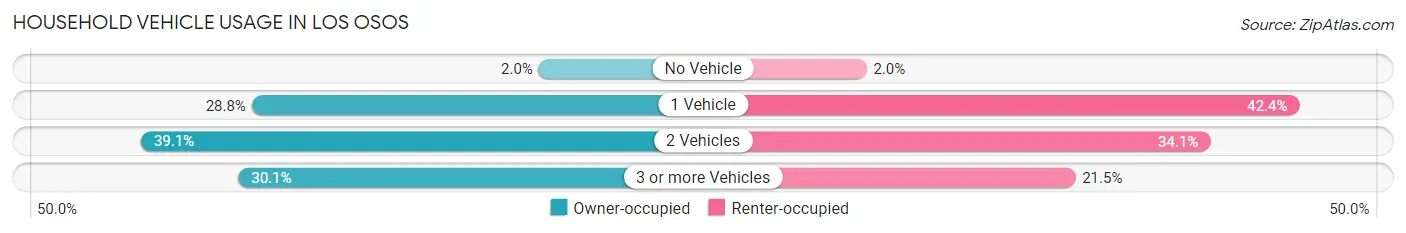
| Vehicles per Household | Owner-occupied | Renter-occupied |
| No Vehicle | 88 (2.0%) | 40 (2.0%) |
| 1 Vehicle | 1,261 (28.8%) | 846 (42.4%) |
| 2 Vehicles | 1,714 (39.1%) | 680 (34.1%) |
| 3 or more Vehicles | 1,316 (30.0%) | 429 (21.5%) |
| Total | 4,379 (100.0%) | 1,995 (100.0%) |
Real Estate & Mortgages in Los Osos
Real Estate and Mortgage Overview in Los Osos
| Characteristic | Without Mortgage | With Mortgage |
| Housing Units | 1,656 | 2,723 |
| Median Property Value | $687,900 | $707,200 |
| Median Household Income | $89,531 | $761 |
| Monthly Housing Costs | $806 | $932 |
| Real Estate Taxes | $5,054 | $79 |
Property Value by Mortgage Status in Los Osos
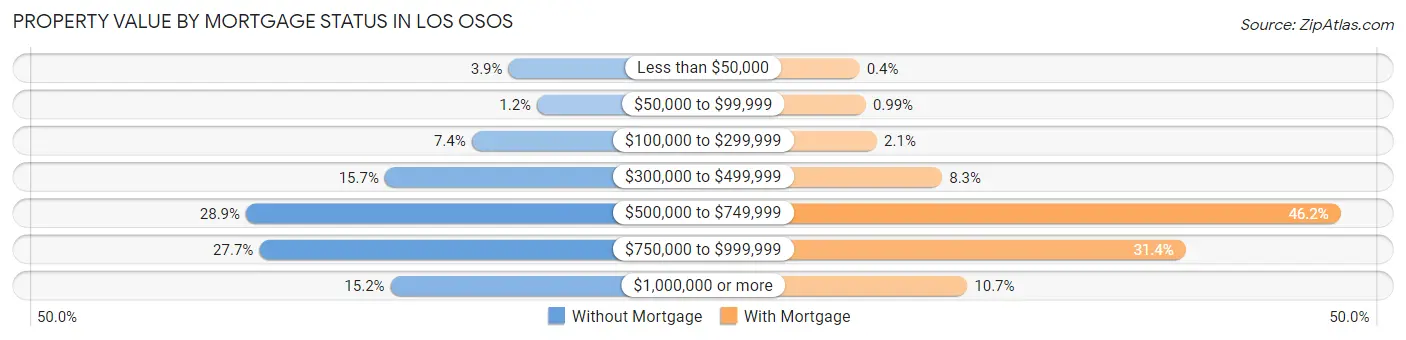
| Property Value | Without Mortgage | With Mortgage |
| Less than $50,000 | 65 (3.9%) | 11 (0.4%) |
| $50,000 to $99,999 | 20 (1.2%) | 27 (1.0%) |
| $100,000 to $299,999 | 123 (7.4%) | 56 (2.1%) |
| $300,000 to $499,999 | 260 (15.7%) | 225 (8.3%) |
| $500,000 to $749,999 | 479 (28.9%) | 1,258 (46.2%) |
| $750,000 to $999,999 | 458 (27.7%) | 856 (31.4%) |
| $1,000,000 or more | 251 (15.2%) | 290 (10.6%) |
| Total | 1,656 (100.0%) | 2,723 (100.0%) |
Household Income by Mortgage Status in Los Osos
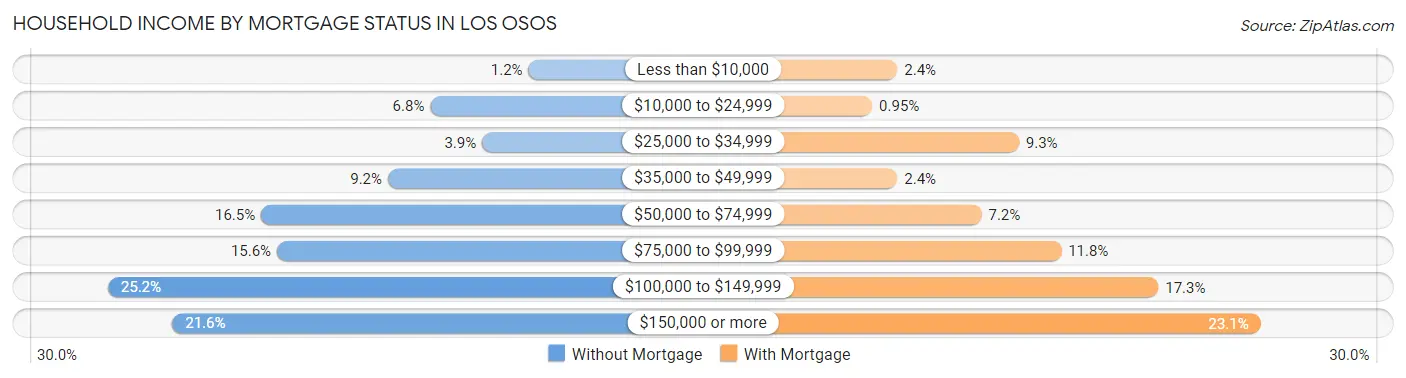
| Household Income | Without Mortgage | With Mortgage |
| Less than $10,000 | 20 (1.2%) | 65 (2.4%) |
| $10,000 to $24,999 | 113 (6.8%) | 26 (0.9%) |
| $25,000 to $34,999 | 64 (3.9%) | 254 (9.3%) |
| $35,000 to $49,999 | 153 (9.2%) | 65 (2.4%) |
| $50,000 to $74,999 | 273 (16.5%) | 196 (7.2%) |
| $75,000 to $99,999 | 258 (15.6%) | 320 (11.7%) |
| $100,000 to $149,999 | 418 (25.2%) | 471 (17.3%) |
| $150,000 or more | 357 (21.6%) | 630 (23.1%) |
| Total | 1,656 (100.0%) | 2,723 (100.0%) |
Property Value to Household Income Ratio in Los Osos
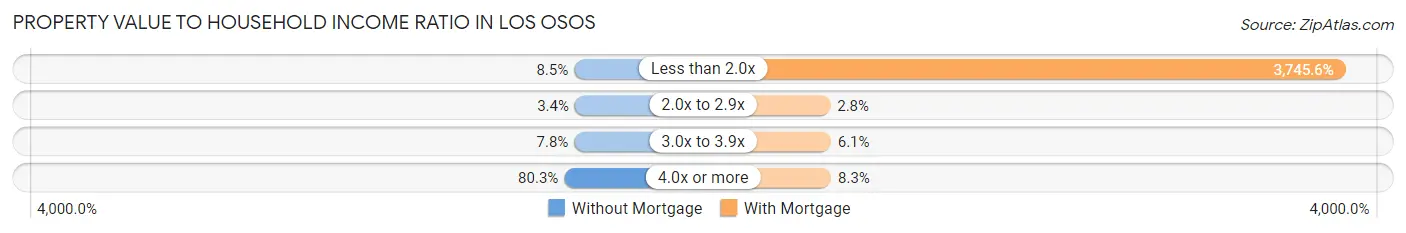
| Value-to-Income Ratio | Without Mortgage | With Mortgage |
| Less than 2.0x | 141 (8.5%) | 101,993 (3,745.6%) |
| 2.0x to 2.9x | 56 (3.4%) | 75 (2.8%) |
| 3.0x to 3.9x | 129 (7.8%) | 167 (6.1%) |
| 4.0x or more | 1,330 (80.3%) | 227 (8.3%) |
| Total | 1,656 (100.0%) | 2,723 (100.0%) |
Real Estate Taxes by Mortgage Status in Los Osos
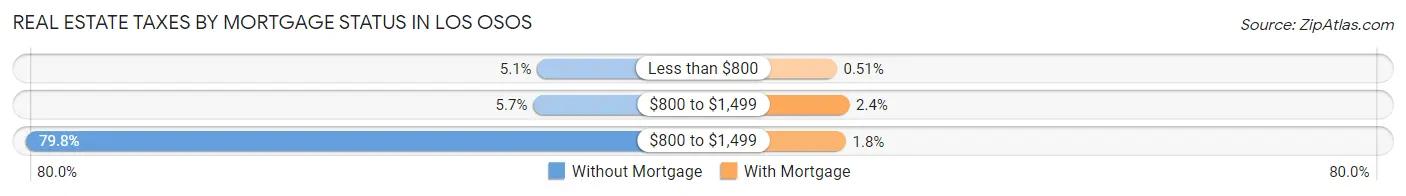
| Property Taxes | Without Mortgage | With Mortgage |
| Less than $800 | 84 (5.1%) | 14 (0.5%) |
| $800 to $1,499 | 94 (5.7%) | 64 (2.4%) |
| $800 to $1,499 | 1,321 (79.8%) | 50 (1.8%) |
| Total | 1,656 (100.0%) | 2,723 (100.0%) |
Health & Disability in Los Osos
Health Insurance Coverage by Age in Los Osos
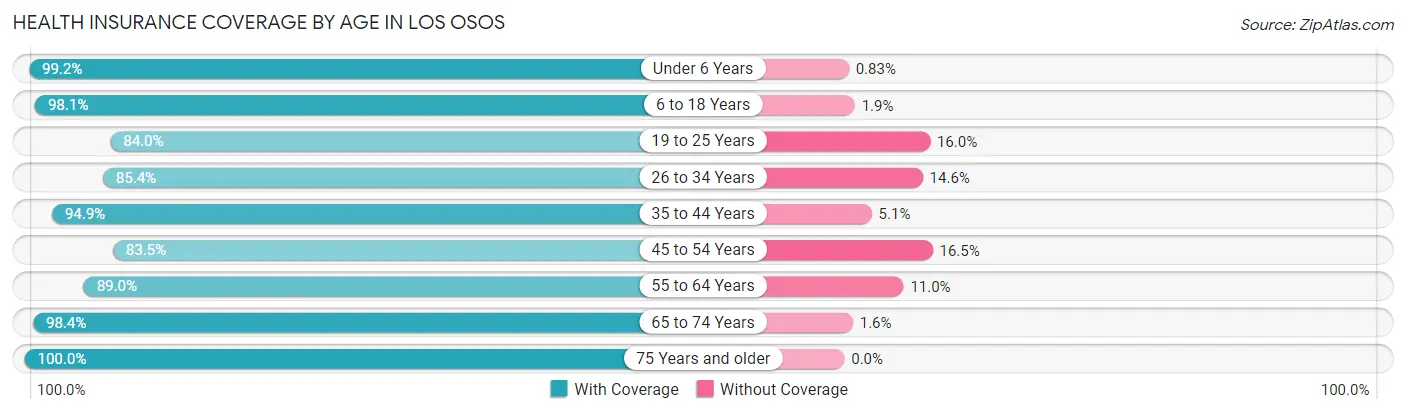
| Age Bracket | With Coverage | Without Coverage |
| Under 6 Years | 1,070 (99.2%) | 9 (0.8%) |
| 6 to 18 Years | 1,722 (98.1%) | 34 (1.9%) |
| 19 to 25 Years | 1,025 (84.0%) | 195 (16.0%) |
| 26 to 34 Years | 1,368 (85.4%) | 234 (14.6%) |
| 35 to 44 Years | 1,766 (94.9%) | 95 (5.1%) |
| 45 to 54 Years | 1,350 (83.5%) | 266 (16.5%) |
| 55 to 64 Years | 2,017 (89.0%) | 250 (11.0%) |
| 65 to 74 Years | 2,486 (98.4%) | 40 (1.6%) |
| 75 Years and older | 1,578 (100.0%) | 0 (0.0%) |
| Total | 14,382 (92.8%) | 1,123 (7.2%) |
Health Insurance Coverage by Citizenship Status in Los Osos
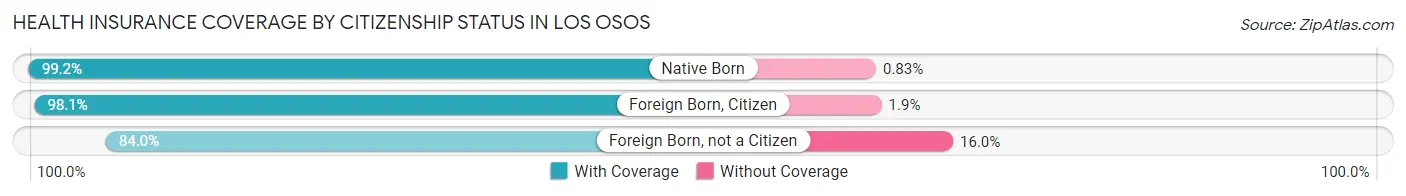
| Citizenship Status | With Coverage | Without Coverage |
| Native Born | 1,070 (99.2%) | 9 (0.8%) |
| Foreign Born, Citizen | 1,722 (98.1%) | 34 (1.9%) |
| Foreign Born, not a Citizen | 1,025 (84.0%) | 195 (16.0%) |
Health Insurance Coverage by Household Income in Los Osos
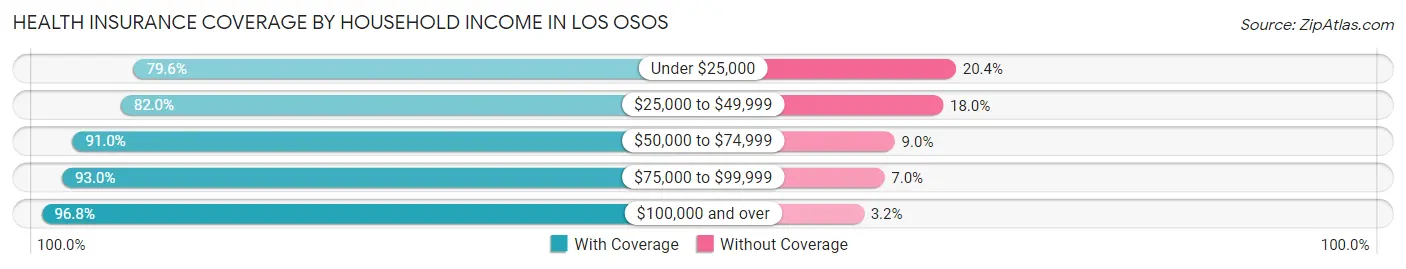
| Household Income | With Coverage | Without Coverage |
| Under $25,000 | 978 (79.6%) | 251 (20.4%) |
| $25,000 to $49,999 | 1,200 (82.0%) | 264 (18.0%) |
| $50,000 to $74,999 | 1,990 (91.0%) | 196 (9.0%) |
| $75,000 to $99,999 | 1,915 (93.0%) | 145 (7.0%) |
| $100,000 and over | 8,145 (96.8%) | 267 (3.2%) |
Public vs Private Health Insurance Coverage by Age in Los Osos
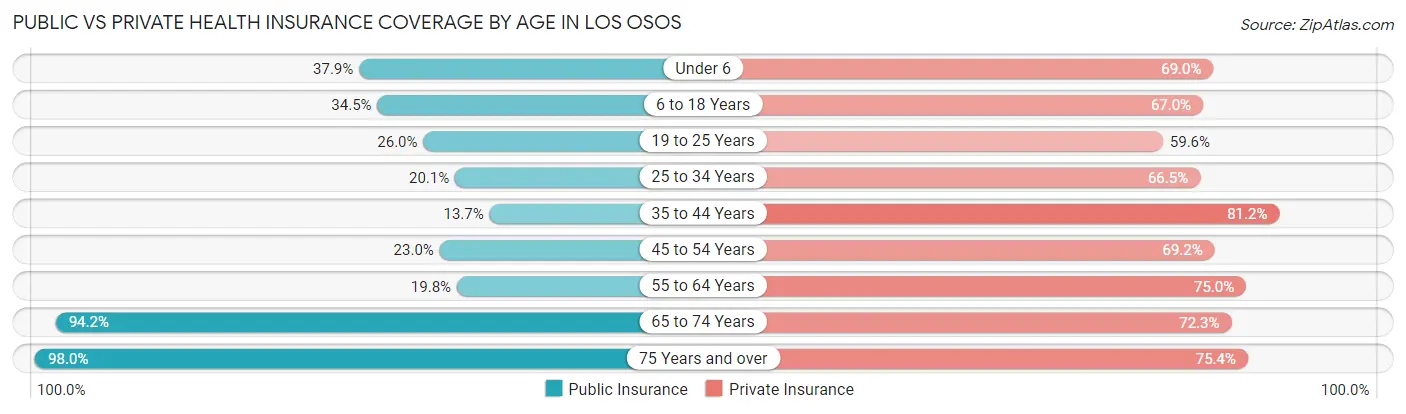
| Age Bracket | Public Insurance | Private Insurance |
| Under 6 | 409 (37.9%) | 744 (69.0%) |
| 6 to 18 Years | 606 (34.5%) | 1,177 (67.0%) |
| 19 to 25 Years | 317 (26.0%) | 727 (59.6%) |
| 25 to 34 Years | 322 (20.1%) | 1,065 (66.5%) |
| 35 to 44 Years | 255 (13.7%) | 1,511 (81.2%) |
| 45 to 54 Years | 371 (23.0%) | 1,118 (69.2%) |
| 55 to 64 Years | 448 (19.8%) | 1,701 (75.0%) |
| 65 to 74 Years | 2,380 (94.2%) | 1,826 (72.3%) |
| 75 Years and over | 1,547 (98.0%) | 1,189 (75.3%) |
| Total | 6,655 (42.9%) | 11,058 (71.3%) |
Disability Status by Sex by Age in Los Osos
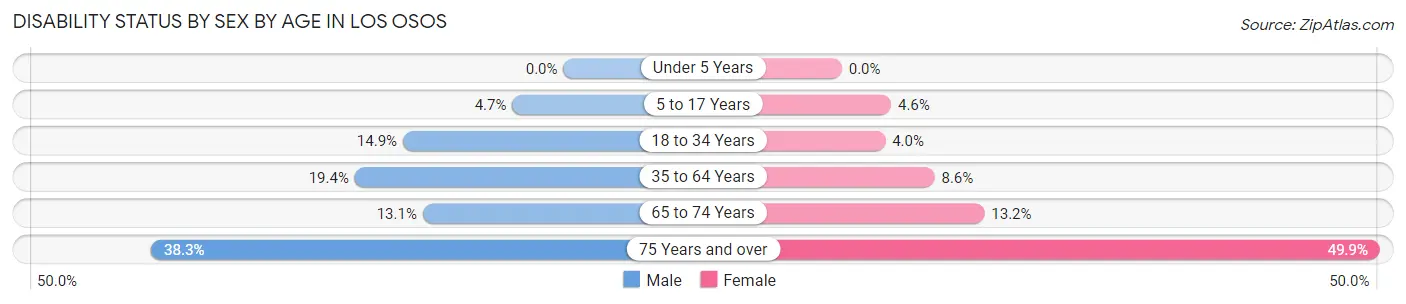
| Age Bracket | Male | Female |
| Under 5 Years | 0 (0.0%) | 0 (0.0%) |
| 5 to 17 Years | 44 (4.7%) | 44 (4.6%) |
| 18 to 34 Years | 230 (14.9%) | 54 (4.0%) |
| 35 to 64 Years | 590 (19.4%) | 232 (8.6%) |
| 65 to 74 Years | 157 (13.1%) | 175 (13.2%) |
| 75 Years and over | 311 (38.3%) | 382 (49.9%) |
Disability Class by Sex by Age in Los Osos
Disability Class: Hearing Difficulty
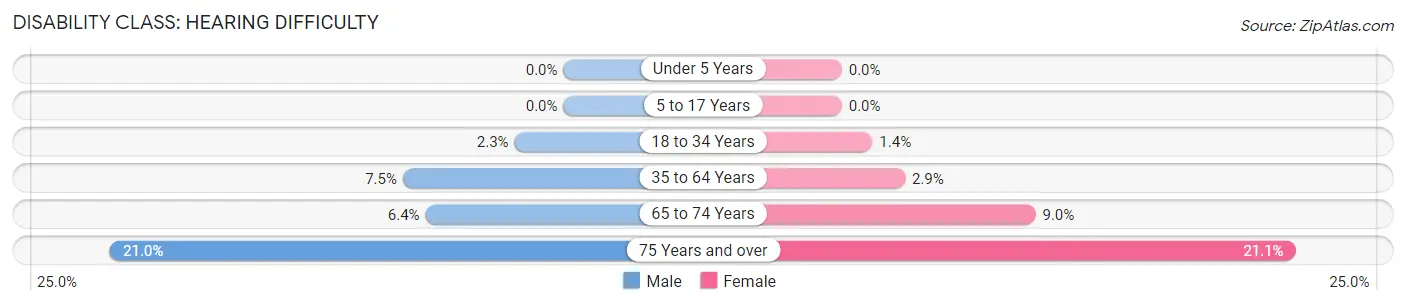
| Age Bracket | Male | Female |
| Under 5 Years | 0 (0.0%) | 0 (0.0%) |
| 5 to 17 Years | 0 (0.0%) | 0 (0.0%) |
| 18 to 34 Years | 35 (2.3%) | 19 (1.4%) |
| 35 to 64 Years | 227 (7.4%) | 79 (2.9%) |
| 65 to 74 Years | 77 (6.4%) | 119 (9.0%) |
| 75 Years and over | 171 (21.0%) | 161 (21.0%) |
Disability Class: Vision Difficulty
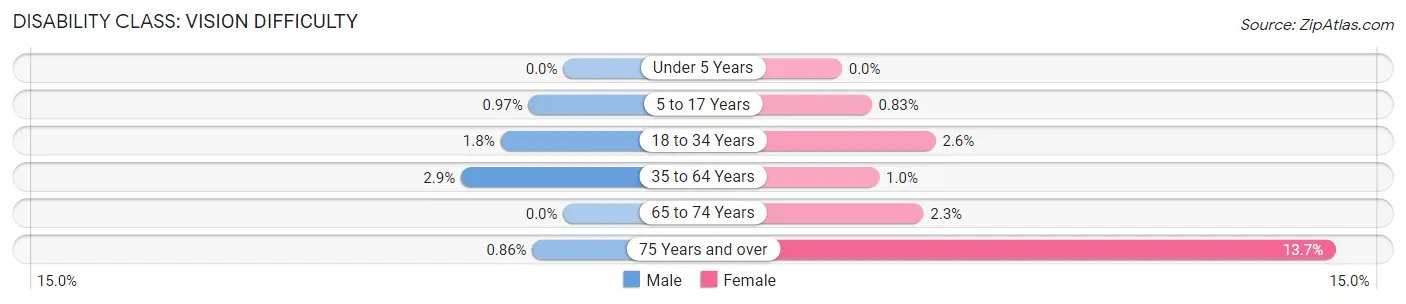
| Age Bracket | Male | Female |
| Under 5 Years | 0 (0.0%) | 0 (0.0%) |
| 5 to 17 Years | 9 (1.0%) | 8 (0.8%) |
| 18 to 34 Years | 27 (1.8%) | 35 (2.6%) |
| 35 to 64 Years | 87 (2.9%) | 28 (1.0%) |
| 65 to 74 Years | 0 (0.0%) | 30 (2.3%) |
| 75 Years and over | 7 (0.9%) | 105 (13.7%) |
Disability Class: Cognitive Difficulty
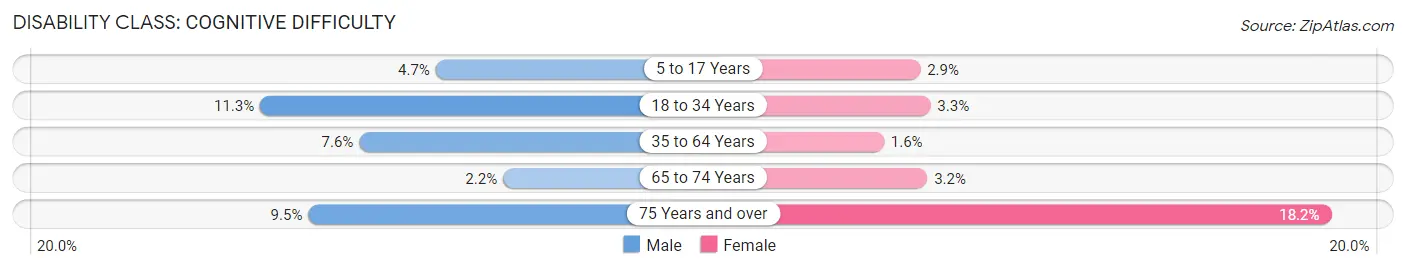
| Age Bracket | Male | Female |
| 5 to 17 Years | 44 (4.7%) | 28 (2.9%) |
| 18 to 34 Years | 174 (11.3%) | 44 (3.3%) |
| 35 to 64 Years | 231 (7.6%) | 42 (1.6%) |
| 65 to 74 Years | 27 (2.2%) | 42 (3.2%) |
| 75 Years and over | 77 (9.5%) | 139 (18.2%) |
Disability Class: Ambulatory Difficulty
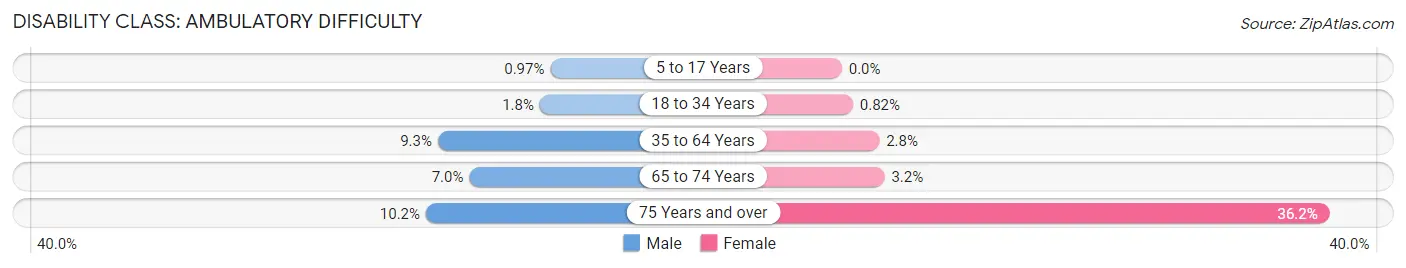
| Age Bracket | Male | Female |
| 5 to 17 Years | 9 (1.0%) | 0 (0.0%) |
| 18 to 34 Years | 27 (1.8%) | 11 (0.8%) |
| 35 to 64 Years | 284 (9.3%) | 75 (2.8%) |
| 65 to 74 Years | 84 (7.0%) | 42 (3.2%) |
| 75 Years and over | 83 (10.2%) | 277 (36.2%) |
Disability Class: Self-Care Difficulty
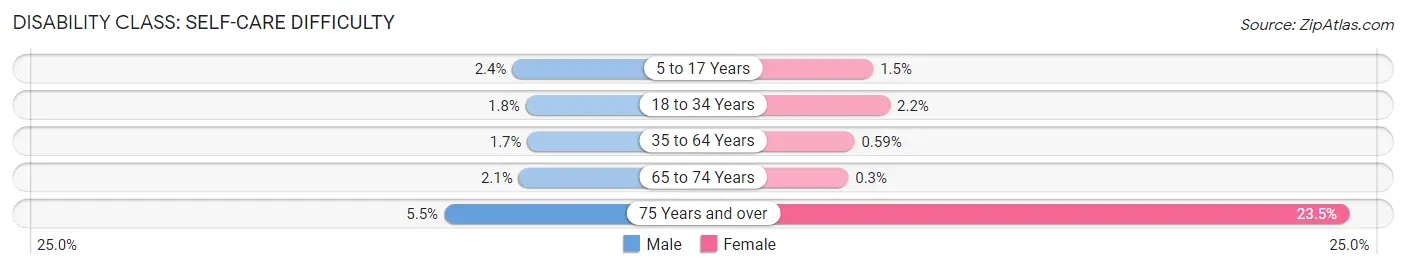
| Age Bracket | Male | Female |
| 5 to 17 Years | 22 (2.4%) | 14 (1.5%) |
| 18 to 34 Years | 27 (1.8%) | 30 (2.2%) |
| 35 to 64 Years | 51 (1.7%) | 16 (0.6%) |
| 65 to 74 Years | 25 (2.1%) | 4 (0.3%) |
| 75 Years and over | 45 (5.5%) | 180 (23.5%) |
Technology Access in Los Osos
Computing Device Access in Los Osos
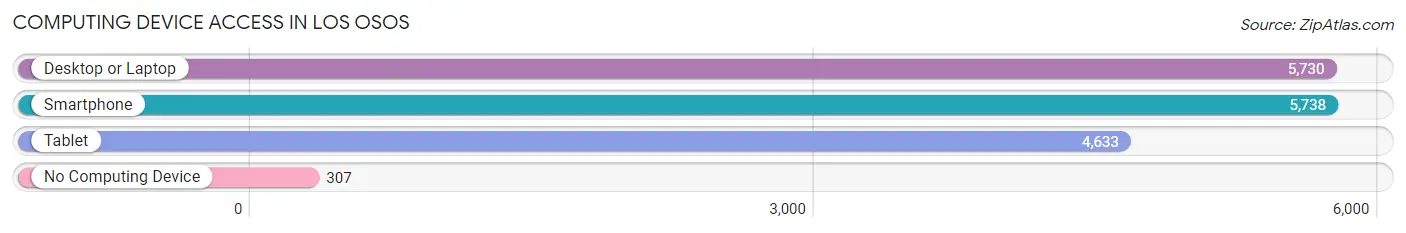
| Device Type | # Households | % Households |
| Desktop or Laptop | 5,730 | 89.9% |
| Smartphone | 5,738 | 90.0% |
| Tablet | 4,633 | 72.7% |
| No Computing Device | 307 | 4.8% |
| Total | 6,374 | 100.0% |
Internet Access in Los Osos
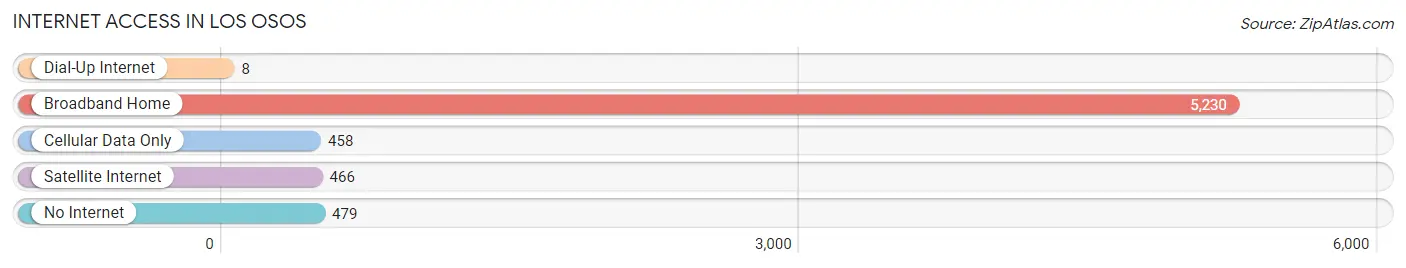
| Internet Type | # Households | % Households |
| Dial-Up Internet | 8 | 0.1% |
| Broadband Home | 5,230 | 82.1% |
| Cellular Data Only | 458 | 7.2% |
| Satellite Internet | 466 | 7.3% |
| No Internet | 479 | 7.5% |
| Total | 6,374 | 100.0% |
Los Osos Summary
Los Osos is a census-designated place located in San Luis Obispo County, California. It is situated on the northern edge of Morro Bay, a large estuary and bay located on the central coast of California. The population of Los Osos was estimated to be 14,276 in 2019.
History
The area now known as Los Osos was originally inhabited by the Chumash people, who lived in the area for thousands of years before the arrival of Europeans. The first Europeans to settle in the area were Spanish missionaries, who established a mission in nearby San Luis Obispo in 1772. The area remained largely undeveloped until the late 19th century, when settlers began to arrive in the area. The town of Los Osos was officially established in 1887, and the first post office was opened in 1888.
Geography
Los Osos is located in San Luis Obispo County, California, on the northern edge of Morro Bay. It is situated at an elevation of approximately 200 feet (61 meters) above sea level. The town covers an area of approximately 8.5 square miles (22 square kilometers). The climate in Los Osos is generally mild, with temperatures ranging from the mid-50s to the mid-70s Fahrenheit (10-24 Celsius) throughout the year.
Economy
The economy of Los Osos is largely based on tourism and services. The town is home to a variety of restaurants, shops, and other businesses catering to visitors and locals alike. The town is also home to a number of small businesses, including a winery, a brewery, and a distillery. Additionally, the town is home to a number of art galleries and other cultural attractions.
Demographics
As of the 2019 census, the population of Los Osos was estimated to be 14,276. The racial makeup of the town was 79.2% White, 0.7% African American, 0.7% Native American, 8.2% Asian, 0.2% Pacific Islander, 8.2% from other races, and 2.9% from two or more races. The median household income in Los Osos was $63,945, and the median age was 44.7 years. The town has a higher-than-average percentage of residents with a college degree, with 36.2% of the population having a bachelor's degree or higher.
Los Osos is a small but vibrant community located on the central coast of California. The town is home to a variety of businesses and attractions, and its population is diverse and well-educated. The town is a popular destination for tourists and locals alike, and its economy is largely based on tourism and services.
Common Questions
What is Per Capita Income in Los Osos?
Per Capita income in Los Osos is $44,183.
What is the Median Family Income in Los Osos?
Median Family Income in Los Osos is $97,375.
What is the Median Household income in Los Osos?
Median Household Income in Los Osos is $91,902.
What is Income or Wage Gap in Los Osos?
Income or Wage Gap in Los Osos is 57.6%.
Women in Los Osos earn 42.4 cents for every dollar earned by a man.
What is Inequality or Gini Index in Los Osos?
Inequality or Gini Index in Los Osos is 0.38.
What is the Total Population of Los Osos?
Total Population of Los Osos is 15,523.
What is the Total Male Population of Los Osos?
Total Male Population of Los Osos is 7,880.
What is the Total Female Population of Los Osos?
Total Female Population of Los Osos is 7,643.
What is the Ratio of Males per 100 Females in Los Osos?
There are 103.10 Males per 100 Females in Los Osos.
What is the Ratio of Females per 100 Males in Los Osos?
There are 96.99 Females per 100 Males in Los Osos.
What is the Median Population Age in Los Osos?
Median Population Age in Los Osos is 47.6 Years.
What is the Average Family Size in Los Osos
Average Family Size in Los Osos is 2.9 People.
What is the Average Household Size in Los Osos
Average Household Size in Los Osos is 2.4 People.
How Large is the Labor Force in Los Osos?
There are 7,746 People in the Labor Forcein in Los Osos.
What is the Percentage of People in the Labor Force in Los Osos?
59.5% of People are in the Labor Force in Los Osos.
What is the Unemployment Rate in Los Osos?
Unemployment Rate in Los Osos is 5.6%.