Encinitas, CA Map & Demographics
Encinitas Map
Encinitas Overview
$77,874
PER CAPITA INCOME
$170,000
AVG FAMILY INCOME
$142,506
AVG HOUSEHOLD INCOME
38.3%
WAGE / INCOME GAP [ % ]
61.7¢/ $1
WAGE / INCOME GAP [ $ ]
$9,355
FAMILY INCOME DEFICIT
0.48
INEQUALITY / GINI INDEX
61,942
TOTAL POPULATION
30,469
MALE POPULATION
31,473
FEMALE POPULATION
96.81
MALES / 100 FEMALES
103.30
FEMALES / 100 MALES
42.9
MEDIAN AGE
3.1
AVG FAMILY SIZE
2.6
AVG HOUSEHOLD SIZE
32,769
LABOR FORCE [ PEOPLE ]
64.7%
PERCENT IN LABOR FORCE
4.6%
UNEMPLOYMENT RATE
Encinitas Zip Codes
Encinitas Area Codes
Income in Encinitas
Income Overview in Encinitas
Per Capita Income in Encinitas is $77,874, while median incomes of families and households are $170,000 and $142,506 respectively.
| Characteristic | Number | Measure |
| Per Capita Income | 61,942 | $77,874 |
| Median Family Income | 16,018 | $170,000 |
| Mean Family Income | 16,018 | $233,348 |
| Median Household Income | 23,837 | $142,506 |
| Mean Household Income | 23,837 | $198,797 |
| Income Deficit | 16,018 | $9,355 |
| Wage / Income Gap (%) | 61,942 | 38.30% |
| Wage / Income Gap ($) | 61,942 | 61.70¢ per $1 |
| Gini / Inequality Index | 61,942 | 0.48 |
Earnings by Sex in Encinitas
Average Earnings in Encinitas are $67,937, $86,172 for men and $53,172 for women, a difference of 38.3%.
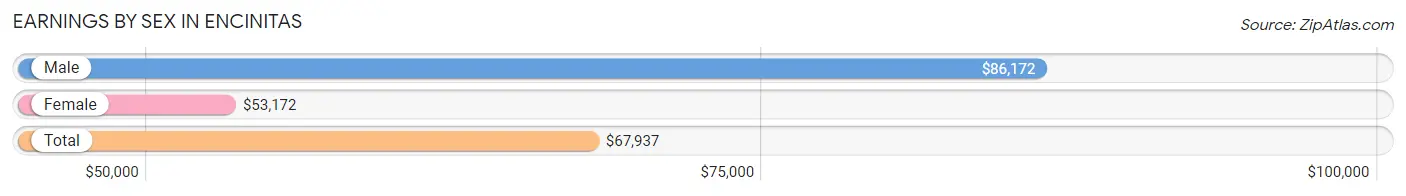
| Sex | Number | Average Earnings |
| Male | 18,506 (54.3%) | $86,172 |
| Female | 15,584 (45.7%) | $53,172 |
| Total | 34,090 (100.0%) | $67,937 |
Earnings by Sex by Income Bracket in Encinitas
The most common earnings brackets in Encinitas are $100,000+ for men (8,193 | 44.3%) and $100,000+ for women (3,844 | 24.7%).
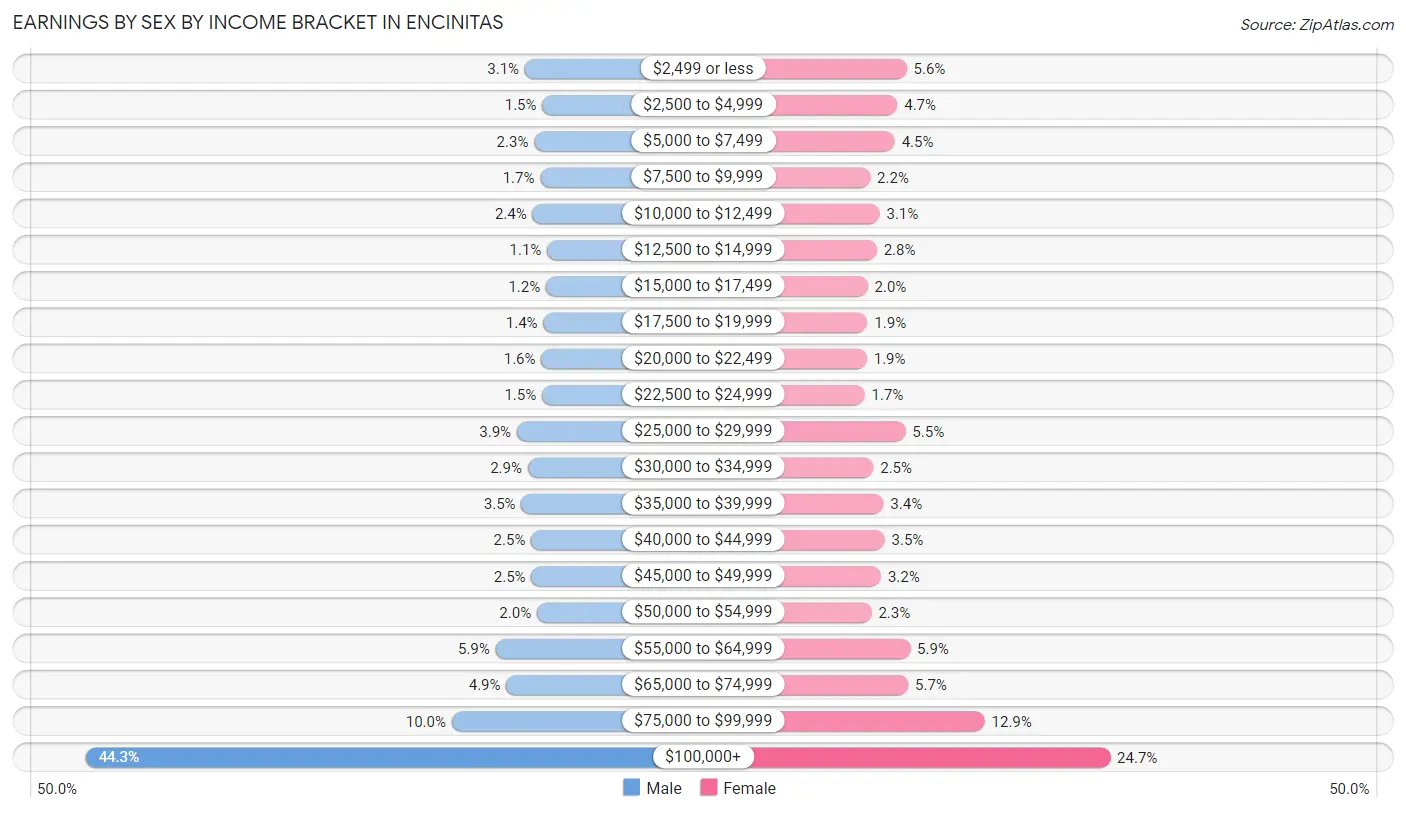
| Income | Male | Female |
| $2,499 or less | 580 (3.1%) | 872 (5.6%) |
| $2,500 to $4,999 | 278 (1.5%) | 737 (4.7%) |
| $5,000 to $7,499 | 419 (2.3%) | 700 (4.5%) |
| $7,500 to $9,999 | 312 (1.7%) | 342 (2.2%) |
| $10,000 to $12,499 | 448 (2.4%) | 478 (3.1%) |
| $12,500 to $14,999 | 195 (1.1%) | 437 (2.8%) |
| $15,000 to $17,499 | 212 (1.1%) | 304 (1.9%) |
| $17,500 to $19,999 | 260 (1.4%) | 301 (1.9%) |
| $20,000 to $22,499 | 295 (1.6%) | 292 (1.9%) |
| $22,500 to $24,999 | 284 (1.5%) | 260 (1.7%) |
| $25,000 to $29,999 | 718 (3.9%) | 856 (5.5%) |
| $30,000 to $34,999 | 529 (2.9%) | 386 (2.5%) |
| $35,000 to $39,999 | 640 (3.5%) | 535 (3.4%) |
| $40,000 to $44,999 | 470 (2.5%) | 551 (3.5%) |
| $45,000 to $49,999 | 467 (2.5%) | 498 (3.2%) |
| $50,000 to $54,999 | 370 (2.0%) | 360 (2.3%) |
| $55,000 to $64,999 | 1,089 (5.9%) | 924 (5.9%) |
| $65,000 to $74,999 | 901 (4.9%) | 895 (5.7%) |
| $75,000 to $99,999 | 1,846 (10.0%) | 2,012 (12.9%) |
| $100,000+ | 8,193 (44.3%) | 3,844 (24.7%) |
| Total | 18,506 (100.0%) | 15,584 (100.0%) |
Earnings by Sex by Educational Attainment in Encinitas
Average earnings in Encinitas are $94,993 for men and $62,822 for women, a difference of 33.9%. Men with an educational attainment of graduate degree enjoy the highest average annual earnings of $132,206, while those with less than high school education earn the least with $30,052. Women with an educational attainment of graduate degree earn the most with the average annual earnings of $82,179, while those with high school diploma education have the smallest earnings of $29,336.
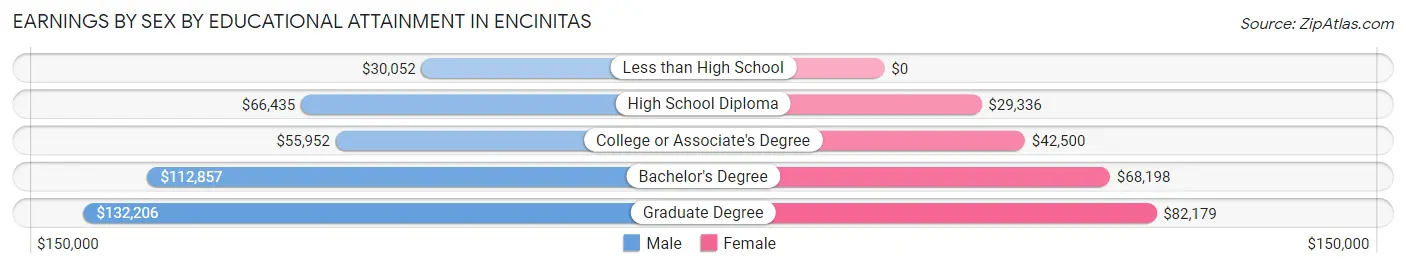
| Educational Attainment | Male Income | Female Income |
| Less than High School | $30,052 | $0 |
| High School Diploma | $66,435 | $29,336 |
| College or Associate's Degree | $55,952 | $42,500 |
| Bachelor's Degree | $112,857 | $68,198 |
| Graduate Degree | $132,206 | $82,179 |
| Total | $94,993 | $62,822 |
Family Income in Encinitas
Family Income Brackets in Encinitas
According to the Encinitas family income data, there are 6,872 families falling into the $200,000+ income range, which is the most common income bracket and makes up 42.9% of all families. Conversely, the $10,000 to $14,999 income bracket is the least frequent group with only 160 families (1.0%) belonging to this category.
| Income Bracket | # Families | % Families |
| Less than $10,000 | 304 | 1.9% |
| $10,000 to $14,999 | 160 | 1.0% |
| $15,000 to $24,999 | 192 | 1.2% |
| $25,000 to $34,999 | 705 | 4.4% |
| $35,000 to $49,999 | 577 | 3.6% |
| $50,000 to $74,999 | 977 | 6.1% |
| $75,000 to $99,999 | 1,426 | 8.9% |
| $100,000 to $149,999 | 2,579 | 16.1% |
| $150,000 to $199,999 | 2,259 | 14.1% |
| $200,000+ | 6,872 | 42.9% |
Family Income by Famaliy Size in Encinitas
4-person families (3,372 | 21.0%) account for the highest median family income in Encinitas with $250,001 per family, while 2-person families (7,499 | 46.8%) have the highest median income of $75,088 per family member.
| Income Bracket | # Families | Median Income |
| 2-Person Families | 7,499 (46.8%) | $150,175 |
| 3-Person Families | 3,655 (22.8%) | $159,414 |
| 4-Person Families | 3,372 (21.0%) | $250,001 |
| 5-Person Families | 1,333 (8.3%) | $175,893 |
| 6-Person Families | 120 (0.7%) | $246,429 |
| 7+ Person Families | 39 (0.2%) | $0 |
| Total | 16,018 (100.0%) | $170,000 |
Family Income by Number of Earners in Encinitas
The median family income in Encinitas is $170,000, with families comprising 2 earners (7,311) having the highest median family income of $207,958, while families with no earners (2,454) have the lowest median family income of $108,728, accounting for 45.6% and 15.3% of families, respectively.
| Number of Earners | # Families | Median Income |
| No Earners | 2,454 (15.3%) | $108,728 |
| 1 Earner | 4,611 (28.8%) | $144,708 |
| 2 Earners | 7,311 (45.6%) | $207,958 |
| 3+ Earners | 1,642 (10.2%) | $175,139 |
| Total | 16,018 (100.0%) | $170,000 |
Household Income in Encinitas
Household Income Brackets in Encinitas
With 8,319 households falling in the category, the $200,000+ income range is the most frequent in Encinitas, accounting for 34.9% of all households. In contrast, only 358 households (1.5%) fall into the $10,000 to $14,999 income bracket, making it the least populous group.
| Income Bracket | # Households | % Households |
| Less than $10,000 | 763 | 3.2% |
| $10,000 to $14,999 | 358 | 1.5% |
| $15,000 to $24,999 | 548 | 2.3% |
| $25,000 to $34,999 | 1,120 | 4.7% |
| $35,000 to $49,999 | 1,335 | 5.6% |
| $50,000 to $74,999 | 1,907 | 8.0% |
| $75,000 to $99,999 | 2,336 | 9.8% |
| $100,000 to $149,999 | 4,005 | 16.8% |
| $150,000 to $199,999 | 3,123 | 13.1% |
| $200,000+ | 8,319 | 34.9% |
Household Income by Householder Age in Encinitas
The median household income in Encinitas is $142,506, with the highest median household income of $175,071 found in the 45 to 64 years age bracket for the primary householder. A total of 9,096 households (38.2%) fall into this category. Meanwhile, the 15 to 24 years age bracket for the primary householder has the lowest median household income of $73,487, with 247 households (1.0%) in this group.
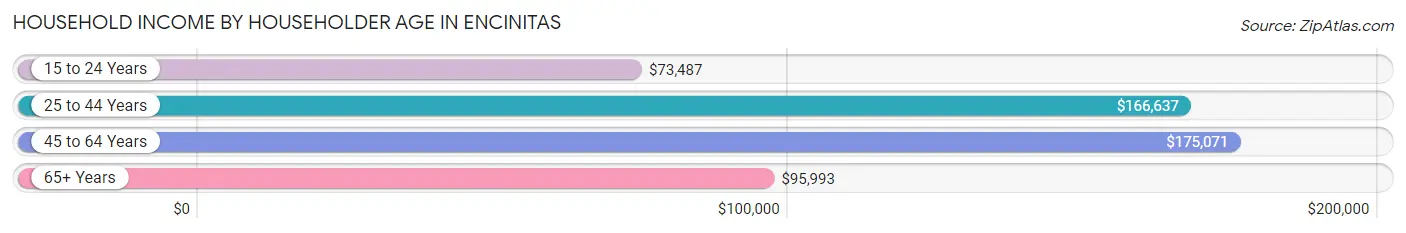
| Income Bracket | # Households | Median Income |
| 15 to 24 Years | 247 (1.0%) | $73,487 |
| 25 to 44 Years | 7,115 (29.8%) | $166,637 |
| 45 to 64 Years | 9,096 (38.2%) | $175,071 |
| 65+ Years | 7,379 (31.0%) | $95,993 |
| Total | 23,837 (100.0%) | $142,506 |
Poverty in Encinitas
Income Below Poverty by Sex and Age in Encinitas
With 7.7% poverty level for males and 6.5% for females among the residents of Encinitas, 12 to 14 year old males and 18 to 24 year old females are the most vulnerable to poverty, with 326 males (22.6%) and 248 females (15.3%) in their respective age groups living below the poverty level.
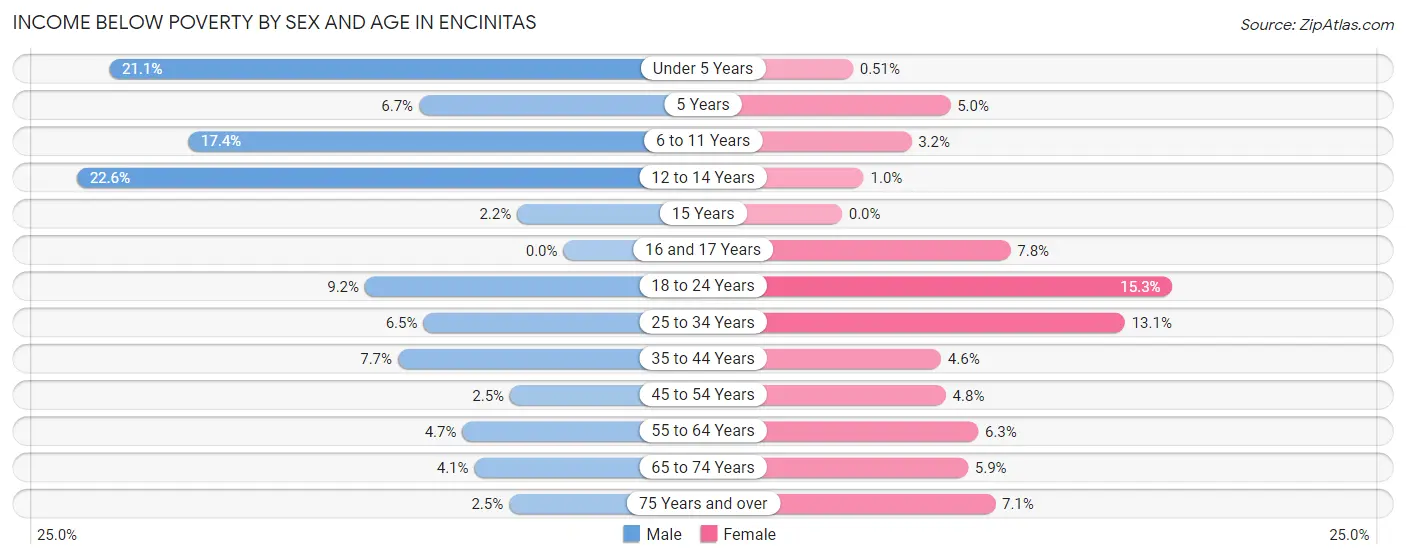
| Age Bracket | Male | Female |
| Under 5 Years | 382 (21.1%) | 8 (0.5%) |
| 5 Years | 14 (6.7%) | 24 (5.0%) |
| 6 to 11 Years | 353 (17.4%) | 68 (3.2%) |
| 12 to 14 Years | 326 (22.6%) | 9 (1.0%) |
| 15 Years | 9 (2.1%) | 0 (0.0%) |
| 16 and 17 Years | 0 (0.0%) | 60 (7.8%) |
| 18 to 24 Years | 171 (9.2%) | 248 (15.3%) |
| 25 to 34 Years | 240 (6.5%) | 498 (13.1%) |
| 35 to 44 Years | 340 (7.7%) | 200 (4.6%) |
| 45 to 54 Years | 105 (2.5%) | 194 (4.8%) |
| 55 to 64 Years | 188 (4.7%) | 296 (6.3%) |
| 65 to 74 Years | 157 (4.1%) | 215 (5.9%) |
| 75 Years and over | 39 (2.5%) | 211 (7.1%) |
| Total | 2,324 (7.7%) | 2,031 (6.5%) |
Income Above Poverty by Sex and Age in Encinitas
According to the poverty statistics in Encinitas, males aged 16 and 17 years and females aged 15 years are the age groups that are most secure financially, with 100.0% of males and 100.0% of females in these age groups living above the poverty line.
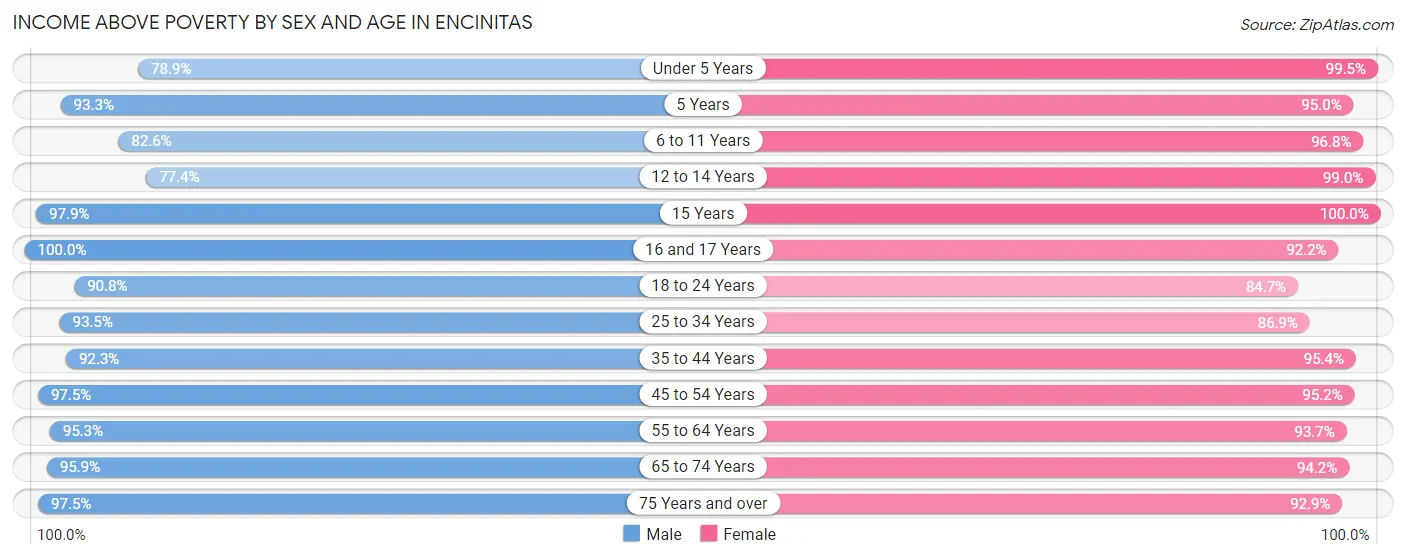
| Age Bracket | Male | Female |
| Under 5 Years | 1,430 (78.9%) | 1,547 (99.5%) |
| 5 Years | 195 (93.3%) | 453 (95.0%) |
| 6 to 11 Years | 1,673 (82.6%) | 2,046 (96.8%) |
| 12 to 14 Years | 1,118 (77.4%) | 882 (99.0%) |
| 15 Years | 410 (97.9%) | 317 (100.0%) |
| 16 and 17 Years | 817 (100.0%) | 707 (92.2%) |
| 18 to 24 Years | 1,685 (90.8%) | 1,369 (84.7%) |
| 25 to 34 Years | 3,453 (93.5%) | 3,296 (86.9%) |
| 35 to 44 Years | 4,087 (92.3%) | 4,152 (95.4%) |
| 45 to 54 Years | 4,136 (97.5%) | 3,834 (95.2%) |
| 55 to 64 Years | 3,820 (95.3%) | 4,387 (93.7%) |
| 65 to 74 Years | 3,643 (95.9%) | 3,461 (94.2%) |
| 75 Years and over | 1,510 (97.5%) | 2,757 (92.9%) |
| Total | 27,977 (92.3%) | 29,208 (93.5%) |
Income Below Poverty Among Married-Couple Families in Encinitas
The poverty statistics for married-couple families in Encinitas show that 2.8% or 368 of the total 13,336 families live below the poverty line. Families with 3 or 4 children have the highest poverty rate of 22.7%, comprising of 219 families. On the other hand, families with 1 or 2 children have the lowest poverty rate of 1.1%, which includes 52 families.
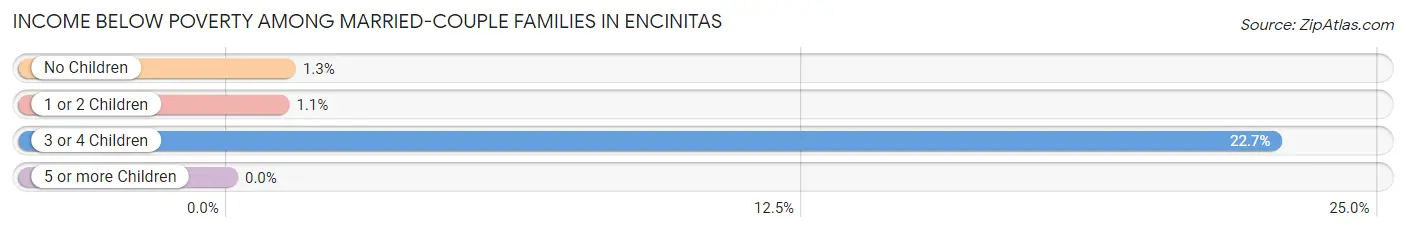
| Children | Above Poverty | Below Poverty |
| No Children | 7,632 (98.7%) | 97 (1.3%) |
| 1 or 2 Children | 4,591 (98.9%) | 52 (1.1%) |
| 3 or 4 Children | 745 (77.3%) | 219 (22.7%) |
| 5 or more Children | 0 (0.0%) | 0 (0.0%) |
| Total | 12,968 (97.2%) | 368 (2.8%) |
Income Below Poverty Among Single-Parent Households in Encinitas
According to the poverty data in Encinitas, 17.5% or 155 single-father households and 12.9% or 231 single-mother households are living below the poverty line. Among single-father households, those with 3 or 4 children have the highest poverty rate, with 7 households (100.0%) experiencing poverty. Likewise, among single-mother households, those with 3 or 4 children have the highest poverty rate, with 24 households (32.4%) falling below the poverty line.
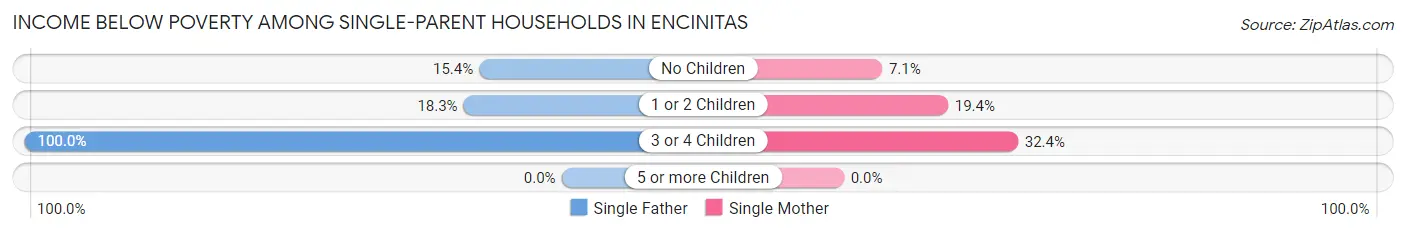
| Children | Single Father | Single Mother |
| No Children | 64 (15.3%) | 74 (7.1%) |
| 1 or 2 Children | 84 (18.3%) | 133 (19.4%) |
| 3 or 4 Children | 7 (100.0%) | 24 (32.4%) |
| 5 or more Children | 0 (0.0%) | 0 (0.0%) |
| Total | 155 (17.5%) | 231 (12.9%) |
Income Below Poverty Among Married-Couple vs Single-Parent Households in Encinitas
The poverty data for Encinitas shows that 368 of the married-couple family households (2.8%) and 386 of the single-parent households (14.4%) are living below the poverty level. Within the married-couple family households, those with 3 or 4 children have the highest poverty rate, with 219 households (22.7%) falling below the poverty line. Among the single-parent households, those with 3 or 4 children have the highest poverty rate, with 31 household (38.3%) living below poverty.
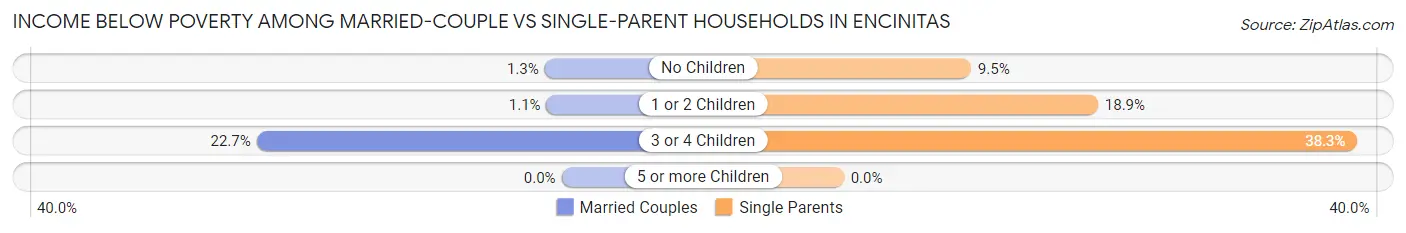
| Children | Married-Couple Families | Single-Parent Households |
| No Children | 97 (1.3%) | 138 (9.5%) |
| 1 or 2 Children | 52 (1.1%) | 217 (18.9%) |
| 3 or 4 Children | 219 (22.7%) | 31 (38.3%) |
| 5 or more Children | 0 (0.0%) | 0 (0.0%) |
| Total | 368 (2.8%) | 386 (14.4%) |
Race in Encinitas
The most populous races in Encinitas are White / Caucasian (50,123 | 80.9%), Hispanic or Latino (9,224 | 14.9%), and Two or more Races (6,396 | 10.3%).
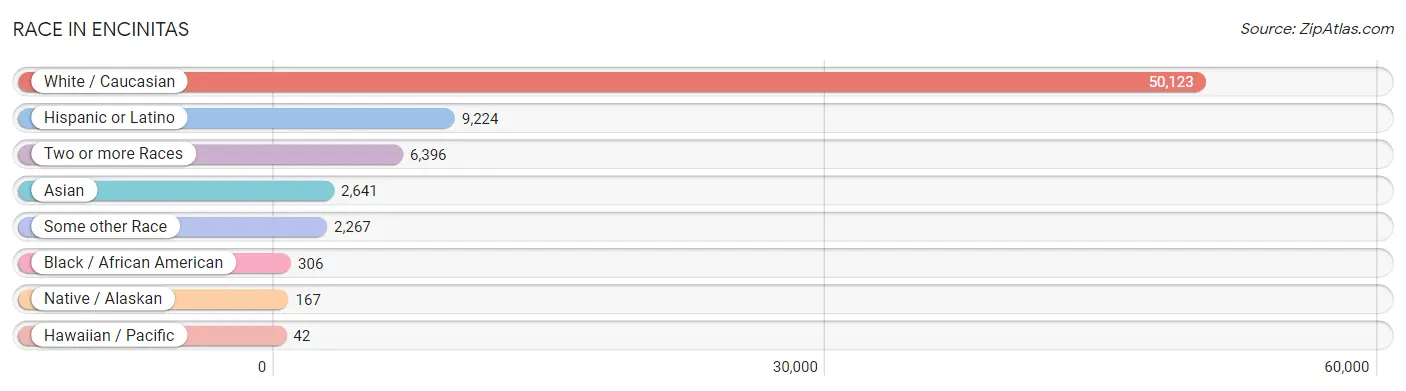
| Race | # Population | % Population |
| Asian | 2,641 | 4.3% |
| Black / African American | 306 | 0.5% |
| Hawaiian / Pacific | 42 | 0.1% |
| Hispanic or Latino | 9,224 | 14.9% |
| Native / Alaskan | 167 | 0.3% |
| White / Caucasian | 50,123 | 80.9% |
| Two or more Races | 6,396 | 10.3% |
| Some other Race | 2,267 | 3.7% |
| Total | 61,942 | 100.0% |
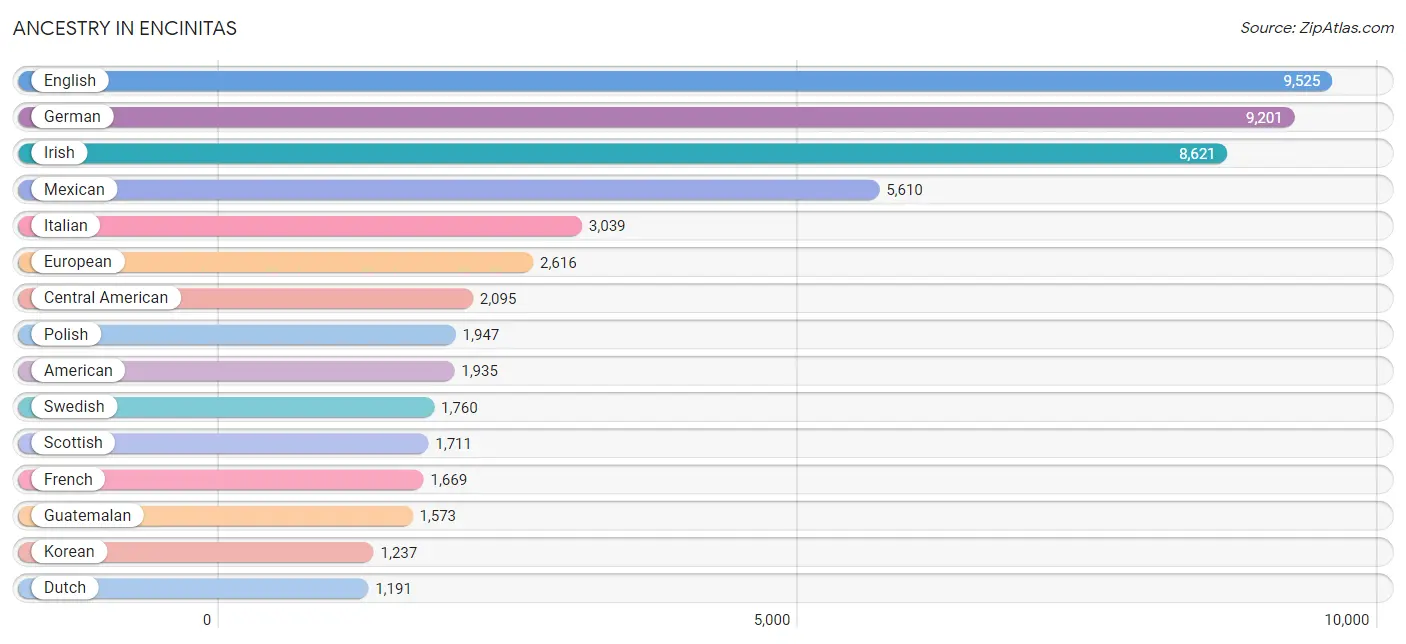
Ancestry in Encinitas
The most populous ancestries reported in Encinitas are English (9,525 | 15.4%), German (9,201 | 14.8%), Irish (8,621 | 13.9%), Mexican (5,610 | 9.1%), and Italian (3,039 | 4.9%), together accounting for 58.1% of all Encinitas residents.
| Ancestry | # Population | % Population |
| African | 37 | 0.1% |
| American | 1,935 | 3.1% |
| Apache | 54 | 0.1% |
| Arab | 405 | 0.6% |
| Argentinean | 17 | 0.0% |
| Armenian | 109 | 0.2% |
| Assyrian / Chaldean / Syriac | 34 | 0.1% |
| Australian | 51 | 0.1% |
| Austrian | 296 | 0.5% |
| Basque | 67 | 0.1% |
| Belgian | 95 | 0.2% |
| Belizean | 49 | 0.1% |
| Bhutanese | 663 | 1.1% |
| Bolivian | 115 | 0.2% |
| Brazilian | 158 | 0.3% |
| British | 994 | 1.6% |
| Burmese | 348 | 0.6% |
| Cajun | 7 | 0.0% |
| Canadian | 483 | 0.8% |
| Celtic | 75 | 0.1% |
| Central American | 2,095 | 3.4% |
| Central American Indian | 91 | 0.2% |
| Cherokee | 29 | 0.1% |
| Chilean | 4 | 0.0% |
| Chippewa | 46 | 0.1% |
| Colombian | 52 | 0.1% |
| Costa Rican | 71 | 0.1% |
| Croatian | 163 | 0.3% |
| Cuban | 129 | 0.2% |
| Czech | 308 | 0.5% |
| Czechoslovakian | 38 | 0.1% |
| Danish | 564 | 0.9% |
| Dominican | 22 | 0.0% |
| Dutch | 1,191 | 1.9% |
| Eastern European | 751 | 1.2% |
| Ecuadorian | 17 | 0.0% |
| Egyptian | 31 | 0.1% |
| English | 9,525 | 15.4% |
| Ethiopian | 33 | 0.1% |
| European | 2,616 | 4.2% |
| Filipino | 202 | 0.3% |
| Finnish | 123 | 0.2% |
| French | 1,669 | 2.7% |
| French Canadian | 401 | 0.6% |
| German | 9,201 | 14.8% |
| Greek | 541 | 0.9% |
| Guatemalan | 1,573 | 2.5% |
| Hungarian | 359 | 0.6% |
| Indian (Asian) | 1,080 | 1.7% |
| Indonesian | 55 | 0.1% |
| Iranian | 403 | 0.6% |
| Irish | 8,621 | 13.9% |
| Israeli | 16 | 0.0% |
| Italian | 3,039 | 4.9% |
| Jamaican | 21 | 0.0% |
| Japanese | 36 | 0.1% |
| Jordanian | 30 | 0.1% |
| Korean | 1,237 | 2.0% |
| Laotian | 17 | 0.0% |
| Latvian | 76 | 0.1% |
| Lebanese | 178 | 0.3% |
| Lithuanian | 159 | 0.3% |
| Luxembourger | 19 | 0.0% |
| Malaysian | 18 | 0.0% |
| Mexican | 5,610 | 9.1% |
| Mexican American Indian | 93 | 0.2% |
| Mongolian | 92 | 0.2% |
| Moroccan | 18 | 0.0% |
| Native Hawaiian | 87 | 0.1% |
| Nicaraguan | 7 | 0.0% |
| Nigerian | 13 | 0.0% |
| Northern European | 430 | 0.7% |
| Norwegian | 979 | 1.6% |
| Osage | 10 | 0.0% |
| Pakistani | 26 | 0.0% |
| Palestinian | 51 | 0.1% |
| Panamanian | 425 | 0.7% |
| Peruvian | 35 | 0.1% |
| Polish | 1,947 | 3.1% |
| Portuguese | 452 | 0.7% |
| Potawatomi | 23 | 0.0% |
| Puerto Rican | 87 | 0.1% |
| Romanian | 145 | 0.2% |
| Russian | 969 | 1.6% |
| Salvadoran | 19 | 0.0% |
| Samoan | 8 | 0.0% |
| Scandinavian | 281 | 0.4% |
| Scotch-Irish | 720 | 1.2% |
| Scottish | 1,711 | 2.8% |
| Seminole | 11 | 0.0% |
| Serbian | 70 | 0.1% |
| Sioux | 5 | 0.0% |
| Slavic | 10 | 0.0% |
| Slovak | 175 | 0.3% |
| Slovene | 107 | 0.2% |
| Somali | 17 | 0.0% |
| South African | 97 | 0.2% |
| South American | 345 | 0.6% |
| Spaniard | 379 | 0.6% |
| Spanish | 402 | 0.6% |
| Sri Lankan | 168 | 0.3% |
| Subsaharan African | 197 | 0.3% |
| Swedish | 1,760 | 2.8% |
| Swiss | 454 | 0.7% |
| Syrian | 22 | 0.0% |
| Thai | 1,065 | 1.7% |
| Trinidadian and Tobagonian | 24 | 0.0% |
| Turkish | 3 | 0.0% |
| Ukrainian | 214 | 0.4% |
| Venezuelan | 105 | 0.2% |
| Vietnamese | 32 | 0.1% |
| Welsh | 394 | 0.6% |
| Yugoslavian | 23 | 0.0% | View All 113 Rows |
Immigrants in Encinitas
The most numerous immigrant groups reported in Encinitas came from Europe (2,327 | 3.8%), Latin America (2,310 | 3.7%), Asia (2,183 | 3.5%), Central America (2,041 | 3.3%), and Mexico (1,408 | 2.3%), together accounting for 16.6% of all Encinitas residents.
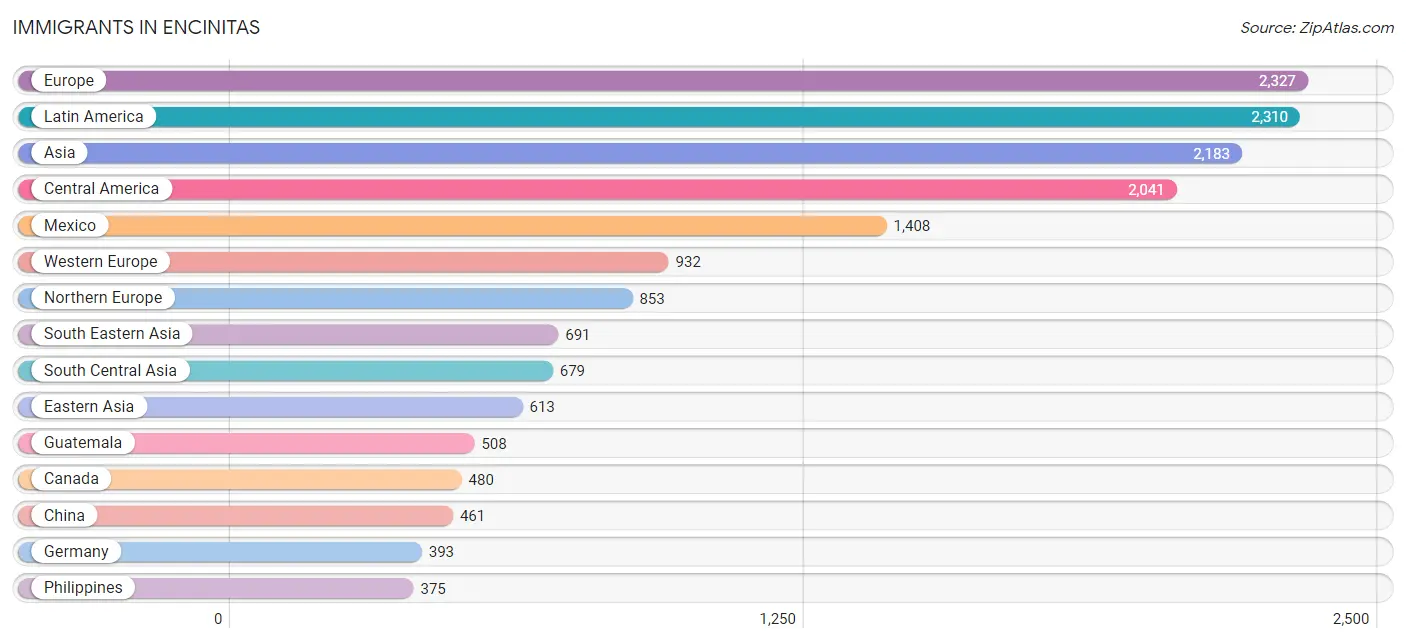
| Immigration Origin | # Population | % Population |
| Africa | 233 | 0.4% |
| Argentina | 24 | 0.0% |
| Asia | 2,183 | 3.5% |
| Australia | 109 | 0.2% |
| Austria | 13 | 0.0% |
| Bangladesh | 43 | 0.1% |
| Belize | 35 | 0.1% |
| Brazil | 92 | 0.2% |
| Bulgaria | 18 | 0.0% |
| Cambodia | 50 | 0.1% |
| Canada | 480 | 0.8% |
| Caribbean | 97 | 0.2% |
| Central America | 2,041 | 3.3% |
| Chile | 12 | 0.0% |
| China | 461 | 0.7% |
| Colombia | 18 | 0.0% |
| Costa Rica | 18 | 0.0% |
| Croatia | 15 | 0.0% |
| Cuba | 4 | 0.0% |
| Czechoslovakia | 9 | 0.0% |
| Denmark | 19 | 0.0% |
| Eastern Africa | 44 | 0.1% |
| Eastern Asia | 613 | 1.0% |
| Eastern Europe | 338 | 0.5% |
| Egypt | 29 | 0.1% |
| El Salvador | 8 | 0.0% |
| England | 222 | 0.4% |
| Ethiopia | 33 | 0.1% |
| Europe | 2,327 | 3.8% |
| Fiji | 12 | 0.0% |
| France | 171 | 0.3% |
| Germany | 393 | 0.6% |
| Ghana | 12 | 0.0% |
| Greece | 22 | 0.0% |
| Grenada | 9 | 0.0% |
| Guatemala | 508 | 0.8% |
| Hong Kong | 215 | 0.4% |
| Hungary | 25 | 0.0% |
| India | 306 | 0.5% |
| Iran | 311 | 0.5% |
| Ireland | 11 | 0.0% |
| Israel | 93 | 0.2% |
| Italy | 72 | 0.1% |
| Jamaica | 10 | 0.0% |
| Japan | 75 | 0.1% |
| Jordan | 8 | 0.0% |
| Kenya | 7 | 0.0% |
| Korea | 77 | 0.1% |
| Latin America | 2,310 | 3.7% |
| Latvia | 9 | 0.0% |
| Lebanon | 25 | 0.0% |
| Malaysia | 102 | 0.2% |
| Mexico | 1,408 | 2.3% |
| Middle Africa | 14 | 0.0% |
| Morocco | 18 | 0.0% |
| Netherlands | 304 | 0.5% |
| Nigeria | 13 | 0.0% |
| Northern Africa | 77 | 0.1% |
| Northern Europe | 853 | 1.4% |
| Norway | 3 | 0.0% |
| Oceania | 176 | 0.3% |
| Panama | 64 | 0.1% |
| Peru | 13 | 0.0% |
| Philippines | 375 | 0.6% |
| Poland | 91 | 0.2% |
| Portugal | 35 | 0.1% |
| Romania | 86 | 0.1% |
| Russia | 25 | 0.0% |
| Saudi Arabia | 17 | 0.0% |
| Scotland | 56 | 0.1% |
| Serbia | 14 | 0.0% |
| Singapore | 26 | 0.0% |
| South Africa | 73 | 0.1% |
| South America | 172 | 0.3% |
| South Central Asia | 679 | 1.1% |
| South Eastern Asia | 691 | 1.1% |
| Southern Europe | 204 | 0.3% |
| Spain | 43 | 0.1% |
| Sweden | 142 | 0.2% |
| Switzerland | 51 | 0.1% |
| Syria | 46 | 0.1% |
| Taiwan | 95 | 0.2% |
| Thailand | 5 | 0.0% |
| Uzbekistan | 19 | 0.0% |
| Vietnam | 111 | 0.2% |
| Western Africa | 25 | 0.0% |
| Western Asia | 189 | 0.3% |
| Western Europe | 932 | 1.5% |
| Zaire | 14 | 0.0% |
| Zimbabwe | 4 | 0.0% | View All 90 Rows |
Sex and Age in Encinitas
Sex and Age in Encinitas
The most populous age groups in Encinitas are 40 to 44 Years (2,379 | 7.8%) for men and 55 to 59 Years (2,521 | 8.0%) for women.
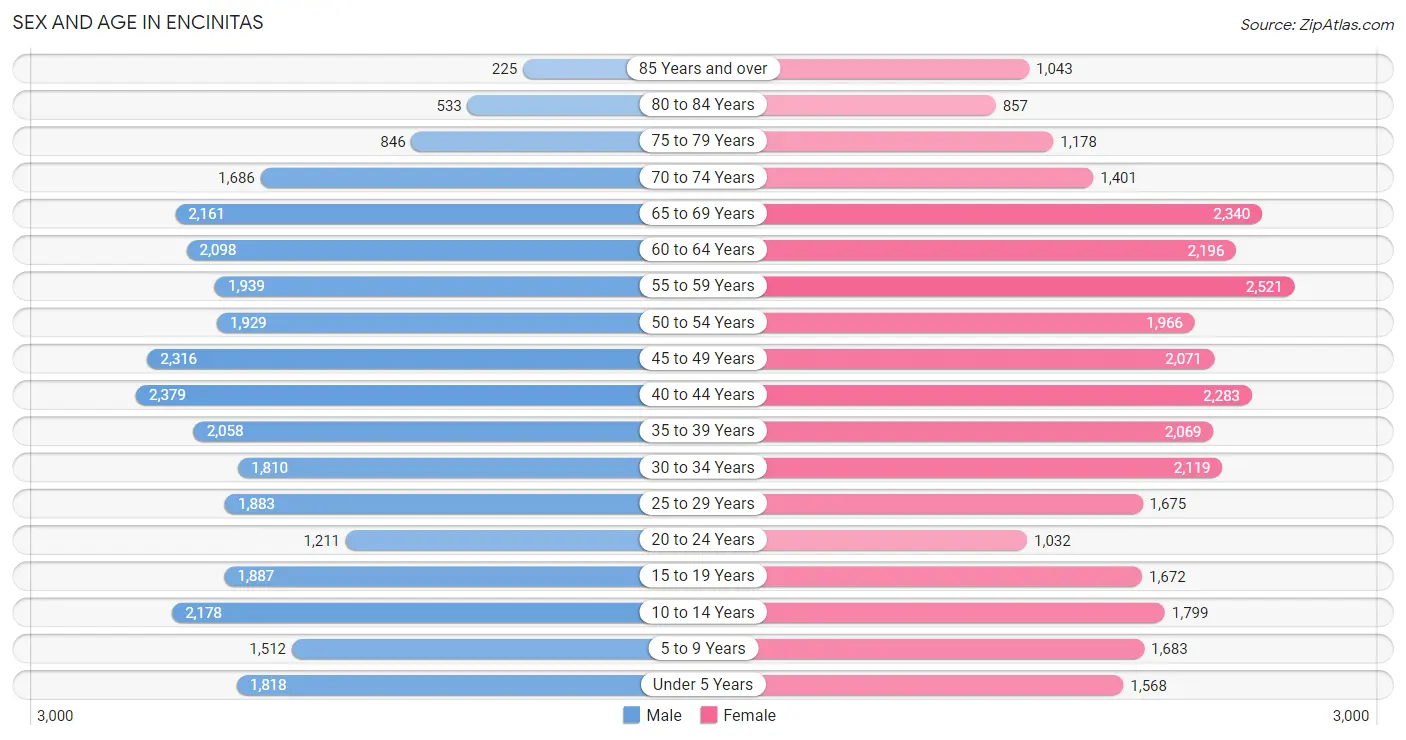
| Age Bracket | Male | Female |
| Under 5 Years | 1,818 (6.0%) | 1,568 (5.0%) |
| 5 to 9 Years | 1,512 (5.0%) | 1,683 (5.3%) |
| 10 to 14 Years | 2,178 (7.1%) | 1,799 (5.7%) |
| 15 to 19 Years | 1,887 (6.2%) | 1,672 (5.3%) |
| 20 to 24 Years | 1,211 (4.0%) | 1,032 (3.3%) |
| 25 to 29 Years | 1,883 (6.2%) | 1,675 (5.3%) |
| 30 to 34 Years | 1,810 (5.9%) | 2,119 (6.7%) |
| 35 to 39 Years | 2,058 (6.8%) | 2,069 (6.6%) |
| 40 to 44 Years | 2,379 (7.8%) | 2,283 (7.2%) |
| 45 to 49 Years | 2,316 (7.6%) | 2,071 (6.6%) |
| 50 to 54 Years | 1,929 (6.3%) | 1,966 (6.2%) |
| 55 to 59 Years | 1,939 (6.4%) | 2,521 (8.0%) |
| 60 to 64 Years | 2,098 (6.9%) | 2,196 (7.0%) |
| 65 to 69 Years | 2,161 (7.1%) | 2,340 (7.4%) |
| 70 to 74 Years | 1,686 (5.5%) | 1,401 (4.4%) |
| 75 to 79 Years | 846 (2.8%) | 1,178 (3.7%) |
| 80 to 84 Years | 533 (1.8%) | 857 (2.7%) |
| 85 Years and over | 225 (0.7%) | 1,043 (3.3%) |
| Total | 30,469 (100.0%) | 31,473 (100.0%) |
Families and Households in Encinitas
Median Family Size in Encinitas
The median family size in Encinitas is 3.07 persons per family, with married-couple families (13,336 | 83.3%) accounting for the largest median family size of 3.13 persons per family. On the other hand, single male/father families (884 | 5.5%) represent the smallest median family size with 2.56 persons per family.
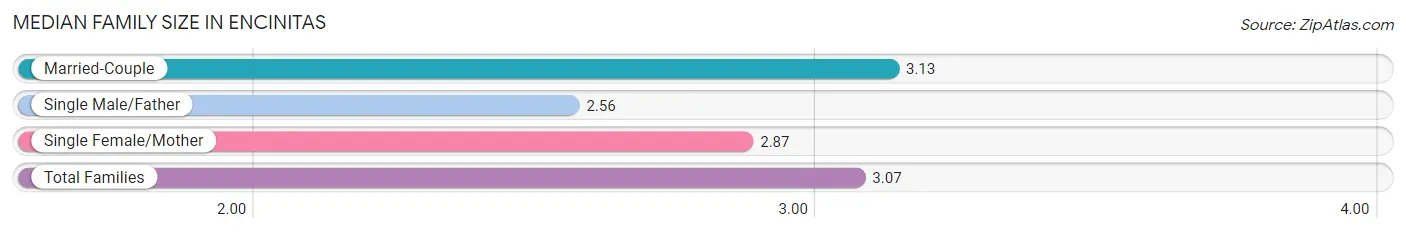
| Family Type | # Families | Family Size |
| Married-Couple | 13,336 (83.3%) | 3.13 |
| Single Male/Father | 884 (5.5%) | 2.56 |
| Single Female/Mother | 1,798 (11.2%) | 2.87 |
| Total Families | 16,018 (100.0%) | 3.07 |
Median Household Size in Encinitas
The median household size in Encinitas is 2.58 persons per household, with married-couple households (13,336 | 55.9%) accounting for the largest median household size of 3.16 persons per household. non-family households (7,819 | 32.8%) represent the smallest median household size with 1.42 persons per household.
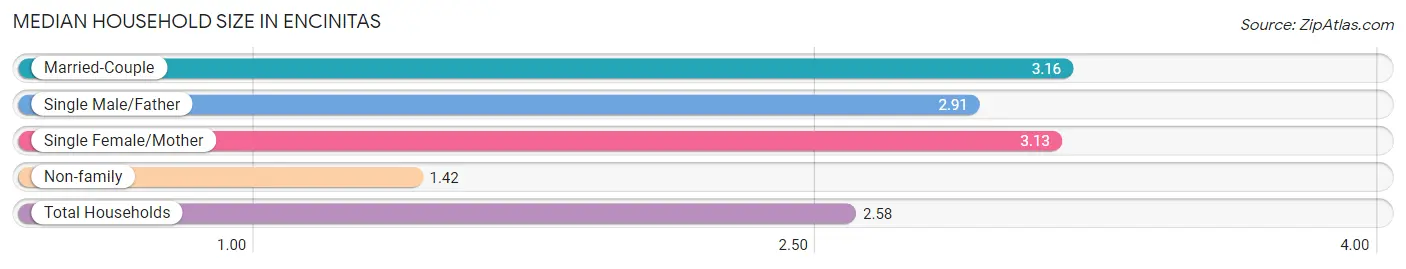
| Household Type | # Households | Household Size |
| Married-Couple | 13,336 (55.9%) | 3.16 |
| Single Male/Father | 884 (3.7%) | 2.91 |
| Single Female/Mother | 1,798 (7.5%) | 3.13 |
| Non-family | 7,819 (32.8%) | 1.42 |
| Total Households | 23,837 (100.0%) | 2.58 |
Household Size by Marriage Status in Encinitas
Out of a total of 23,837 households in Encinitas, 16,018 (67.2%) are family households, while 7,819 (32.8%) are nonfamily households. The most numerous type of family households are 2-person households, comprising 7,056, and the most common type of nonfamily households are 1-person households, comprising 5,415.
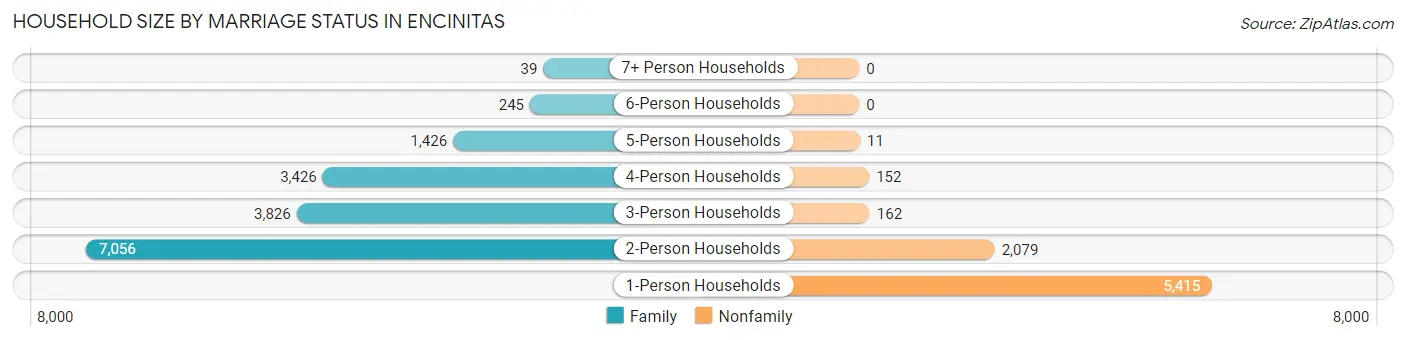
| Household Size | Family Households | Nonfamily Households |
| 1-Person Households | - | 5,415 (22.7%) |
| 2-Person Households | 7,056 (29.6%) | 2,079 (8.7%) |
| 3-Person Households | 3,826 (16.1%) | 162 (0.7%) |
| 4-Person Households | 3,426 (14.4%) | 152 (0.6%) |
| 5-Person Households | 1,426 (6.0%) | 11 (0.1%) |
| 6-Person Households | 245 (1.0%) | 0 (0.0%) |
| 7+ Person Households | 39 (0.2%) | 0 (0.0%) |
| Total | 16,018 (67.2%) | 7,819 (32.8%) |
Female Fertility in Encinitas
Fertility by Age in Encinitas
Average fertility rate in Encinitas is 42.0 births per 1,000 women. Women in the age bracket of 20 to 34 years have the highest fertility rate with 54.0 births per 1,000 women. Women in the age bracket of 35 to 50 years acount for 53.9% of all women with births.
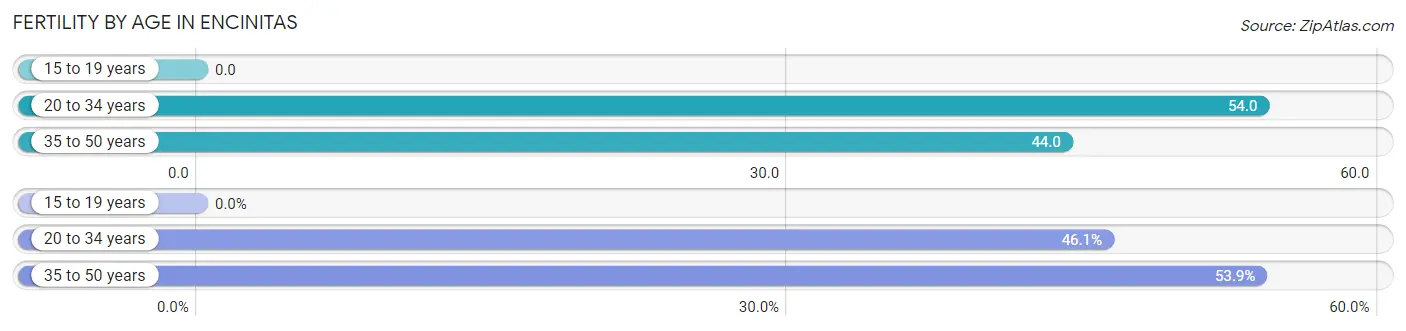
| Age Bracket | Women with Births | Births / 1,000 Women |
| 15 to 19 years | 0 (0.0%) | 0.0 |
| 20 to 34 years | 260 (46.1%) | 54.0 |
| 35 to 50 years | 304 (53.9%) | 44.0 |
| Total | 564 (100.0%) | 42.0 |
Fertility by Age by Marriage Status in Encinitas
78.0% of women with births (564) in Encinitas are married. The highest percentage of unmarried women with births falls into 20 to 34 years age bracket with 47.7% of them unmarried at the time of birth, while the lowest percentage of unmarried women with births belong to 35 to 50 years age bracket with 0.0% of them unmarried.
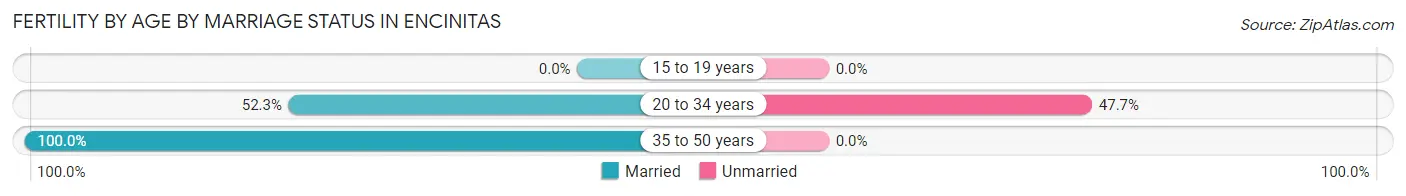
| Age Bracket | Married | Unmarried |
| 15 to 19 years | 0 (0.0%) | 0 (0.0%) |
| 20 to 34 years | 136 (52.3%) | 124 (47.7%) |
| 35 to 50 years | 304 (100.0%) | 0 (0.0%) |
| Total | 440 (78.0%) | 124 (22.0%) |
Fertility by Education in Encinitas
Average fertility rate in Encinitas is 42.0 births per 1,000 women. Women with the education attainment of bachelor's degree have the highest fertility rate of 57.0 births per 1,000 women, while women with the education attainment of less than high school have the lowest fertility at 20.0 births per 1,000 women. Women with the education attainment of bachelor's degree represent 49.3% of all women with births.
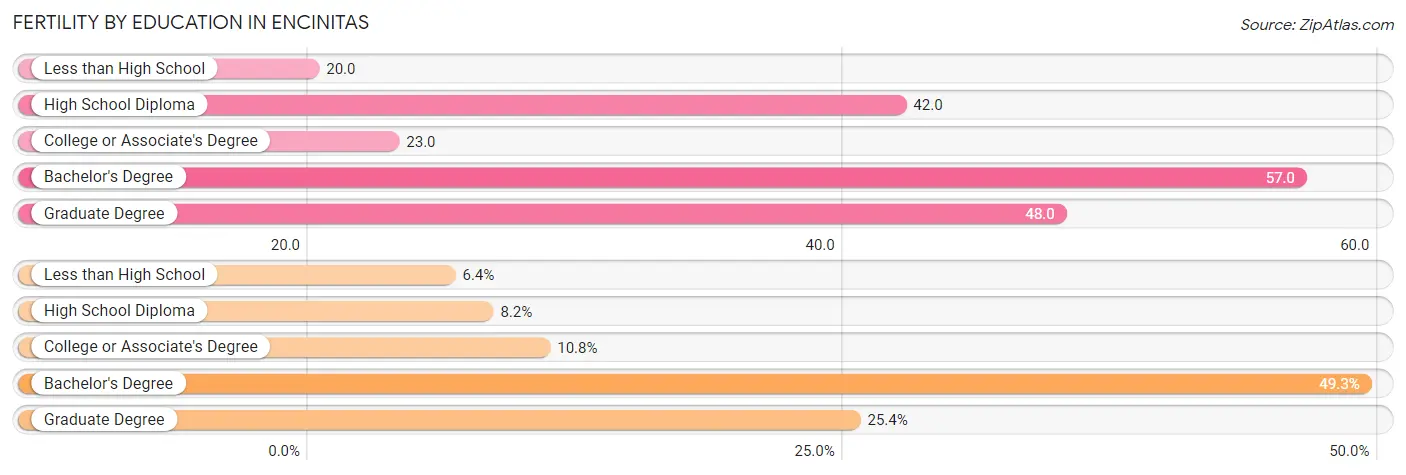
| Educational Attainment | Women with Births | Births / 1,000 Women |
| Less than High School | 36 (6.4%) | 20.0 |
| High School Diploma | 46 (8.2%) | 42.0 |
| College or Associate's Degree | 61 (10.8%) | 23.0 |
| Bachelor's Degree | 278 (49.3%) | 57.0 |
| Graduate Degree | 143 (25.4%) | 48.0 |
| Total | 564 (100.0%) | 42.0 |
Fertility by Education by Marriage Status in Encinitas
22.0% of women with births in Encinitas are unmarried. Women with the educational attainment of less than high school are most likely to be married with 100.0% of them married at childbirth, while women with the educational attainment of high school diploma are least likely to be married with 100.0% of them unmarried at childbirth.
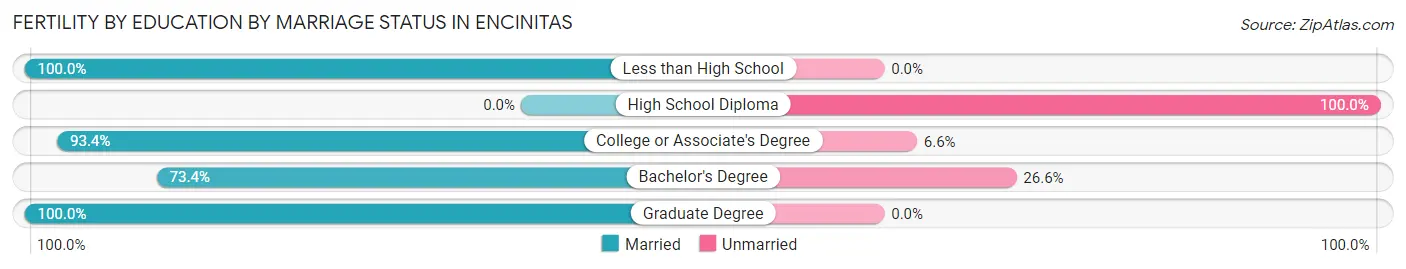
| Educational Attainment | Married | Unmarried |
| Less than High School | 36 (100.0%) | 0 (0.0%) |
| High School Diploma | 0 (0.0%) | 46 (100.0%) |
| College or Associate's Degree | 57 (93.4%) | 4 (6.6%) |
| Bachelor's Degree | 204 (73.4%) | 74 (26.6%) |
| Graduate Degree | 143 (100.0%) | 0 (0.0%) |
| Total | 440 (78.0%) | 124 (22.0%) |
Employment Characteristics in Encinitas
Employment by Class of Employer in Encinitas
Among the 30,640 employed individuals in Encinitas, private company employees (18,692 | 61.0%), self-employed (not incorporated) (3,836 | 12.5%), and self-employed (incorporated) (2,828 | 9.2%) make up the most common classes of employment.
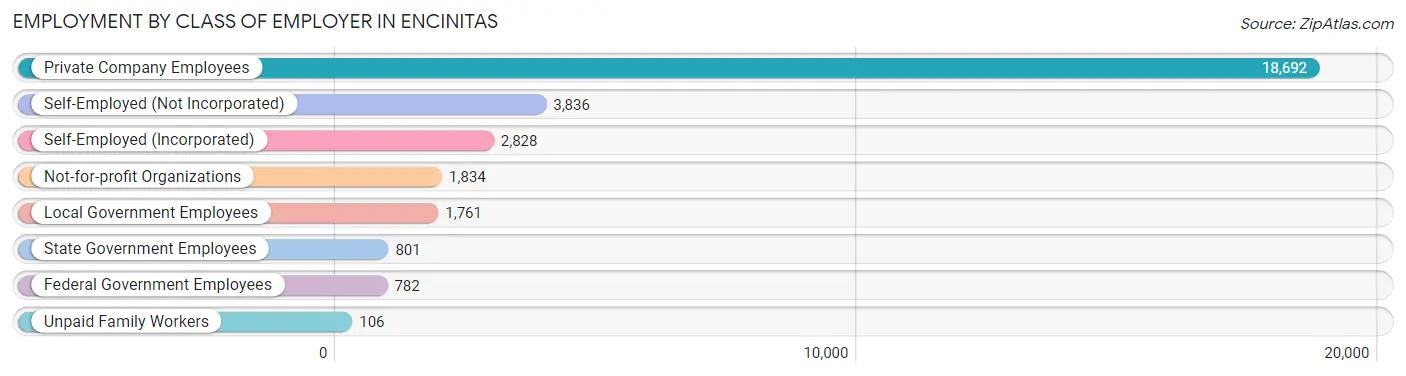
| Employer Class | # Employees | % Employees |
| Private Company Employees | 18,692 | 61.0% |
| Self-Employed (Incorporated) | 2,828 | 9.2% |
| Self-Employed (Not Incorporated) | 3,836 | 12.5% |
| Not-for-profit Organizations | 1,834 | 6.0% |
| Local Government Employees | 1,761 | 5.8% |
| State Government Employees | 801 | 2.6% |
| Federal Government Employees | 782 | 2.5% |
| Unpaid Family Workers | 106 | 0.4% |
| Total | 30,640 | 100.0% |
Employment Status by Age in Encinitas
According to the labor force statistics for Encinitas, out of the total population over 16 years of age (50,648), 64.7% or 32,769 individuals are in the labor force, with 4.6% or 1,507 of them unemployed. The age group with the highest labor force participation rate is 30 to 34 years, with 89.8% or 3,528 individuals in the labor force. Within the labor force, the 16 to 19 years age range has the highest percentage of unemployed individuals, with 16.9% or 174 of them being unemployed.
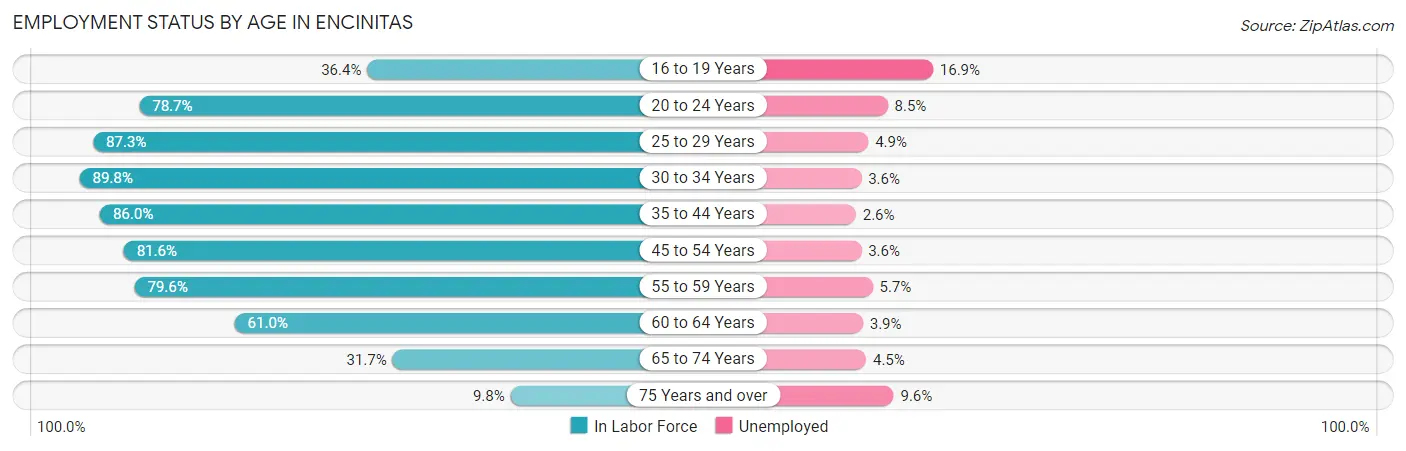
| Age Bracket | In Labor Force | Unemployed |
| 16 to 19 Years | 1,028 (36.4%) | 174 (16.9%) |
| 20 to 24 Years | 1,765 (78.7%) | 150 (8.5%) |
| 25 to 29 Years | 3,106 (87.3%) | 152 (4.9%) |
| 30 to 34 Years | 3,528 (89.8%) | 127 (3.6%) |
| 35 to 44 Years | 7,559 (86.0%) | 197 (2.6%) |
| 45 to 54 Years | 6,758 (81.6%) | 243 (3.6%) |
| 55 to 59 Years | 3,550 (79.6%) | 202 (5.7%) |
| 60 to 64 Years | 2,619 (61.0%) | 102 (3.9%) |
| 65 to 74 Years | 2,405 (31.7%) | 108 (4.5%) |
| 75 Years and over | 459 (9.8%) | 44 (9.6%) |
| Total | 32,769 (64.7%) | 1,507 (4.6%) |
Employment Status by Educational Attainment in Encinitas
According to labor force statistics for Encinitas, 81.4% of individuals (27,116) out of the total population between 25 and 64 years of age (33,312) are in the labor force, with 3.8% or 1,030 of them being unemployed. The group with the highest labor force participation rate are those with the educational attainment of bachelor's degree or higher, with 84.9% or 19,014 individuals in the labor force. Within the labor force, individuals with high school diploma education have the highest percentage of unemployment, with 9.5% or 175 of them being unemployed.
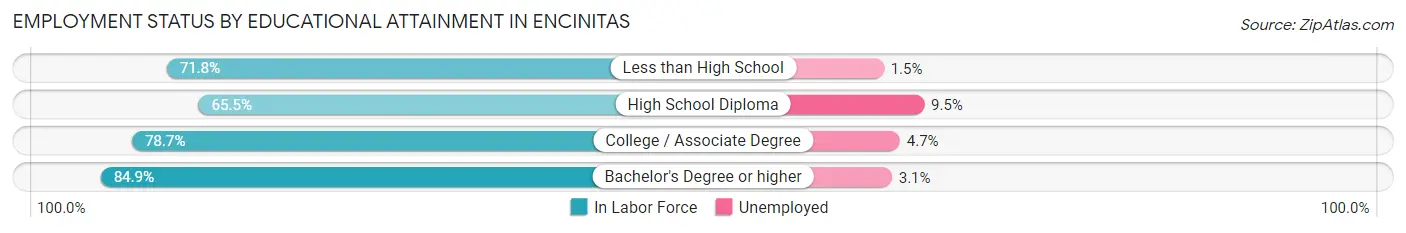
| Educational Attainment | In Labor Force | Unemployed |
| Less than High School | 1,193 (71.8%) | 25 (1.5%) |
| High School Diploma | 1,841 (65.5%) | 267 (9.5%) |
| College / Associate Degree | 5,071 (78.7%) | 303 (4.7%) |
| Bachelor's Degree or higher | 19,014 (84.9%) | 694 (3.1%) |
| Total | 27,116 (81.4%) | 1,266 (3.8%) |
Employment Occupations by Sex in Encinitas
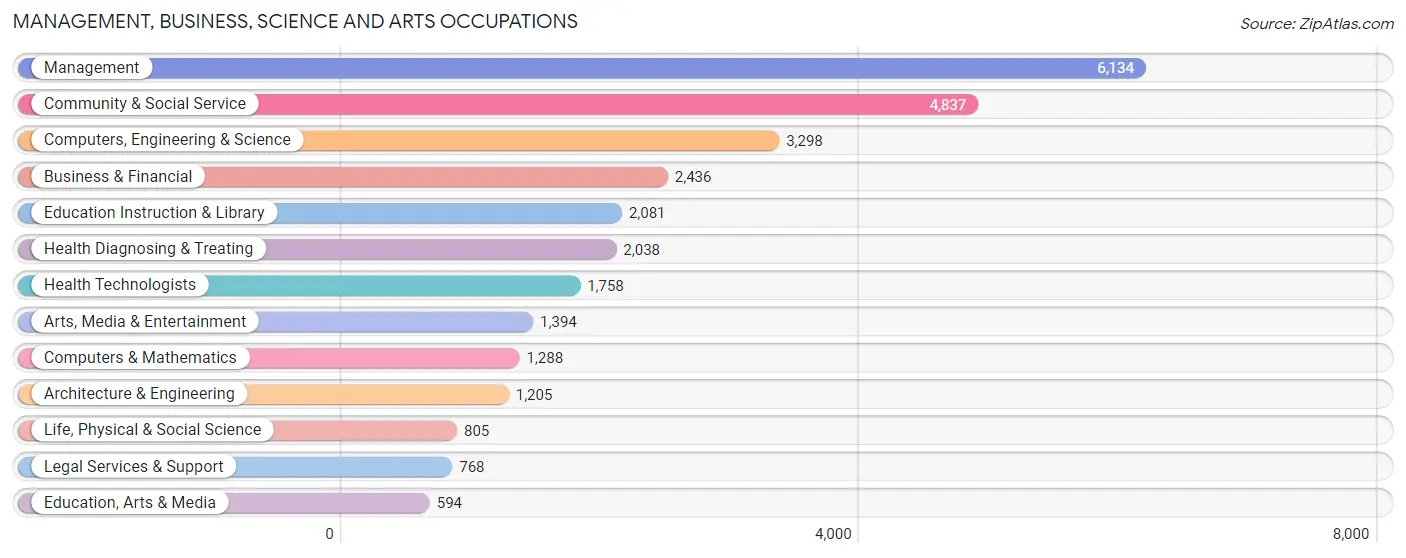
Management, Business, Science and Arts Occupations
The most common Management, Business, Science and Arts occupations in Encinitas are Management (6,134 | 19.8%), Community & Social Service (4,837 | 15.6%), Computers, Engineering & Science (3,298 | 10.6%), Business & Financial (2,436 | 7.9%), and Education Instruction & Library (2,081 | 6.7%).
Management, Business, Science and Arts Occupations by Sex
Within the Management, Business, Science and Arts occupations in Encinitas, the most male-oriented occupations are Architecture & Engineering (85.8%), Computers & Mathematics (76.1%), and Computers, Engineering & Science (74.0%), while the most female-oriented occupations are Education Instruction & Library (75.0%), Health Diagnosing & Treating (68.7%), and Health Technologists (68.3%).
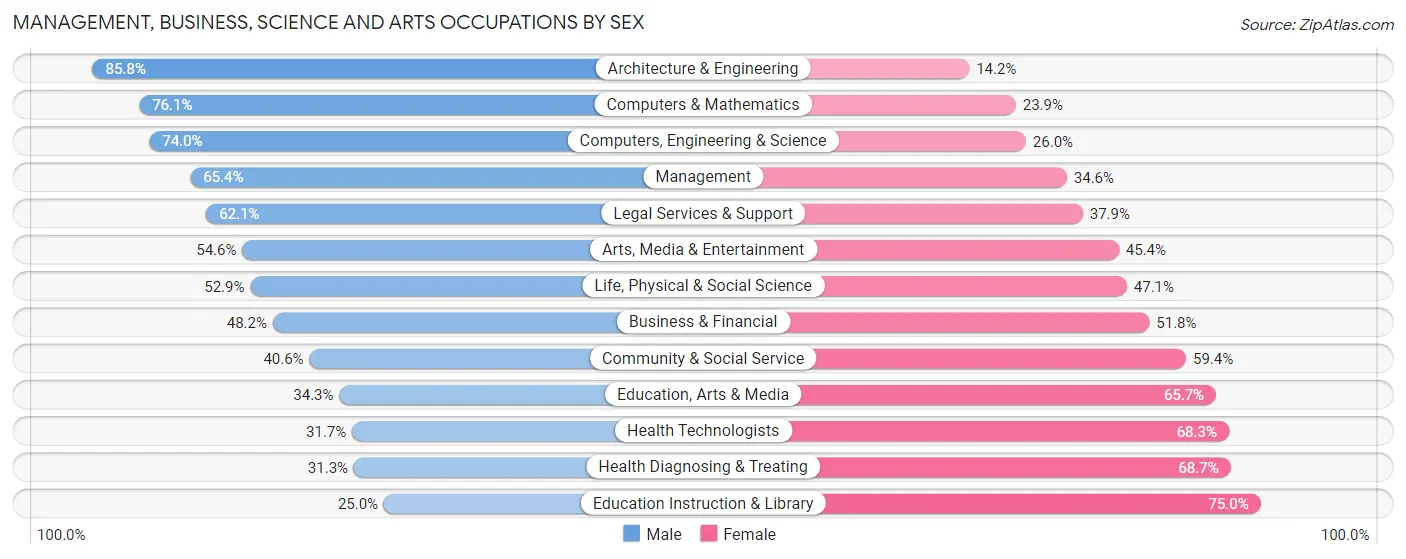
| Occupation | Male | Female |
| Management | 4,014 (65.4%) | 2,120 (34.6%) |
| Business & Financial | 1,175 (48.2%) | 1,261 (51.8%) |
| Computers, Engineering & Science | 2,440 (74.0%) | 858 (26.0%) |
| Computers & Mathematics | 980 (76.1%) | 308 (23.9%) |
| Architecture & Engineering | 1,034 (85.8%) | 171 (14.2%) |
| Life, Physical & Social Science | 426 (52.9%) | 379 (47.1%) |
| Community & Social Service | 1,963 (40.6%) | 2,874 (59.4%) |
| Education, Arts & Media | 204 (34.3%) | 390 (65.7%) |
| Legal Services & Support | 477 (62.1%) | 291 (37.9%) |
| Education Instruction & Library | 521 (25.0%) | 1,560 (75.0%) |
| Arts, Media & Entertainment | 761 (54.6%) | 633 (45.4%) |
| Health Diagnosing & Treating | 638 (31.3%) | 1,400 (68.7%) |
| Health Technologists | 557 (31.7%) | 1,201 (68.3%) |
| Total (Category) | 10,230 (54.6%) | 8,513 (45.4%) |
| Total (Overall) | 16,837 (54.3%) | 14,147 (45.7%) |
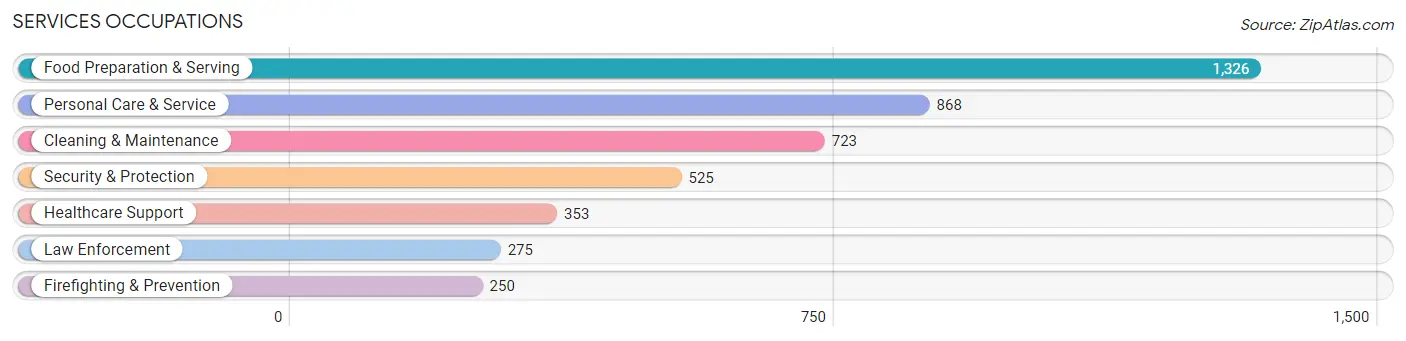
Services Occupations
The most common Services occupations in Encinitas are Food Preparation & Serving (1,326 | 4.3%), Personal Care & Service (868 | 2.8%), Cleaning & Maintenance (723 | 2.3%), Security & Protection (525 | 1.7%), and Healthcare Support (353 | 1.1%).
Services Occupations by Sex
Within the Services occupations in Encinitas, the most male-oriented occupations are Firefighting & Prevention (88.0%), Security & Protection (69.7%), and Food Preparation & Serving (67.6%), while the most female-oriented occupations are Personal Care & Service (83.1%), Cleaning & Maintenance (75.9%), and Healthcare Support (56.1%).
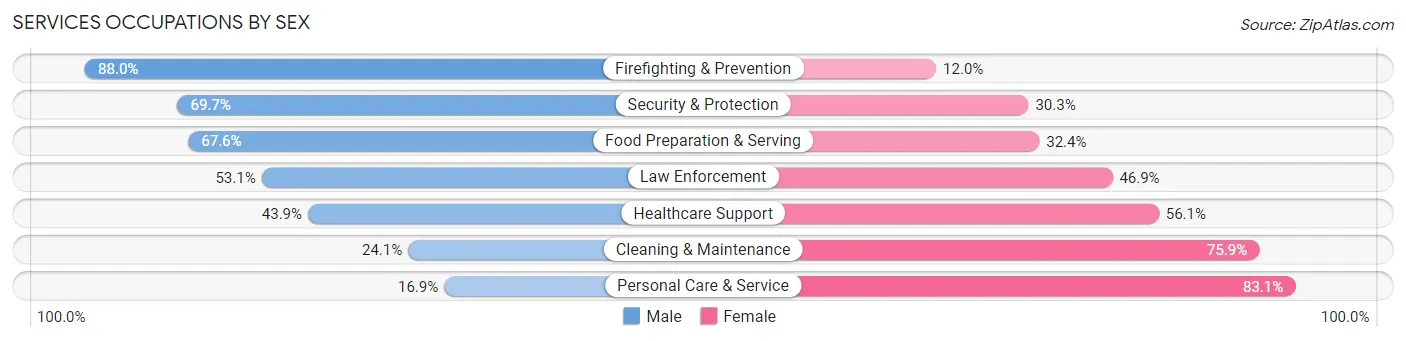
| Occupation | Male | Female |
| Healthcare Support | 155 (43.9%) | 198 (56.1%) |
| Security & Protection | 366 (69.7%) | 159 (30.3%) |
| Firefighting & Prevention | 220 (88.0%) | 30 (12.0%) |
| Law Enforcement | 146 (53.1%) | 129 (46.9%) |
| Food Preparation & Serving | 896 (67.6%) | 430 (32.4%) |
| Cleaning & Maintenance | 174 (24.1%) | 549 (75.9%) |
| Personal Care & Service | 147 (16.9%) | 721 (83.1%) |
| Total (Category) | 1,738 (45.8%) | 2,057 (54.2%) |
| Total (Overall) | 16,837 (54.3%) | 14,147 (45.7%) |
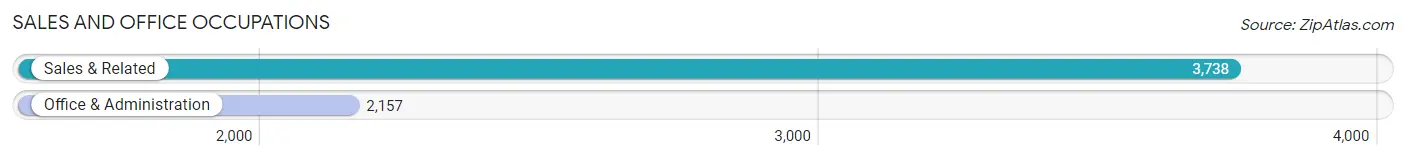
Sales and Office Occupations
The most common Sales and Office occupations in Encinitas are Sales & Related (3,738 | 12.1%), and Office & Administration (2,157 | 7.0%).
Sales and Office Occupations by Sex
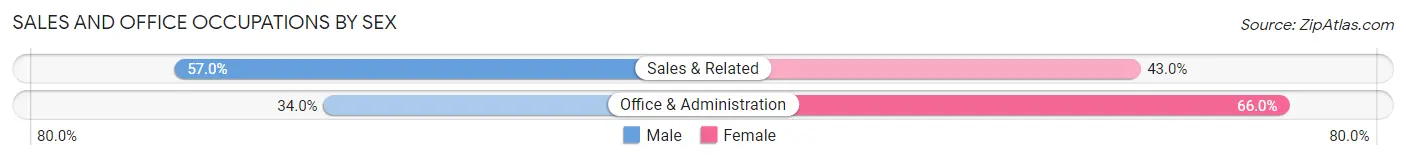
| Occupation | Male | Female |
| Sales & Related | 2,130 (57.0%) | 1,608 (43.0%) |
| Office & Administration | 734 (34.0%) | 1,423 (66.0%) |
| Total (Category) | 2,864 (48.6%) | 3,031 (51.4%) |
| Total (Overall) | 16,837 (54.3%) | 14,147 (45.7%) |
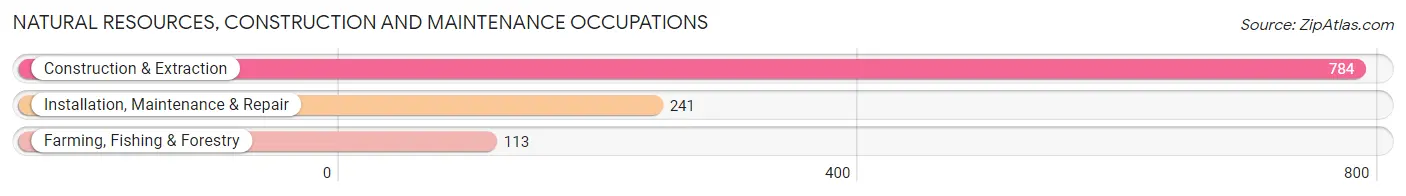
Natural Resources, Construction and Maintenance Occupations
The most common Natural Resources, Construction and Maintenance occupations in Encinitas are Construction & Extraction (784 | 2.5%), Installation, Maintenance & Repair (241 | 0.8%), and Farming, Fishing & Forestry (113 | 0.4%).
Natural Resources, Construction and Maintenance Occupations by Sex
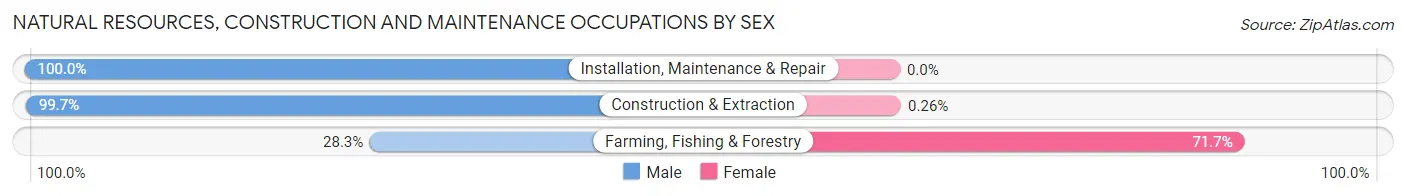
| Occupation | Male | Female |
| Farming, Fishing & Forestry | 32 (28.3%) | 81 (71.7%) |
| Construction & Extraction | 782 (99.7%) | 2 (0.3%) |
| Installation, Maintenance & Repair | 241 (100.0%) | 0 (0.0%) |
| Total (Category) | 1,055 (92.7%) | 83 (7.3%) |
| Total (Overall) | 16,837 (54.3%) | 14,147 (45.7%) |
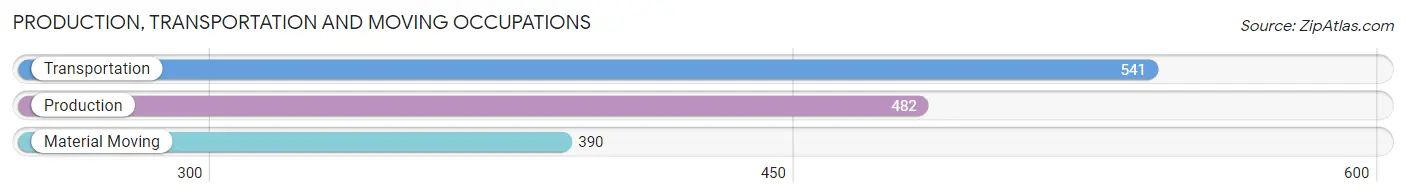
Production, Transportation and Moving Occupations
The most common Production, Transportation and Moving occupations in Encinitas are Transportation (541 | 1.8%), Production (482 | 1.6%), and Material Moving (390 | 1.3%).
Production, Transportation and Moving Occupations by Sex
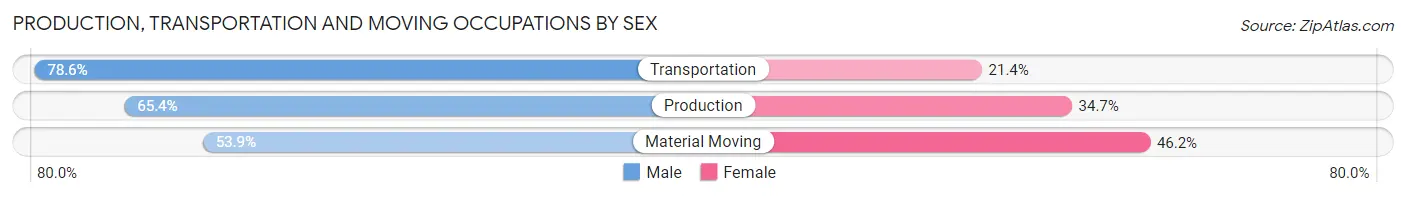
| Occupation | Male | Female |
| Production | 315 (65.3%) | 167 (34.6%) |
| Transportation | 425 (78.6%) | 116 (21.4%) |
| Material Moving | 210 (53.8%) | 180 (46.2%) |
| Total (Category) | 950 (67.2%) | 463 (32.8%) |
| Total (Overall) | 16,837 (54.3%) | 14,147 (45.7%) |
Employment Industries by Sex in Encinitas
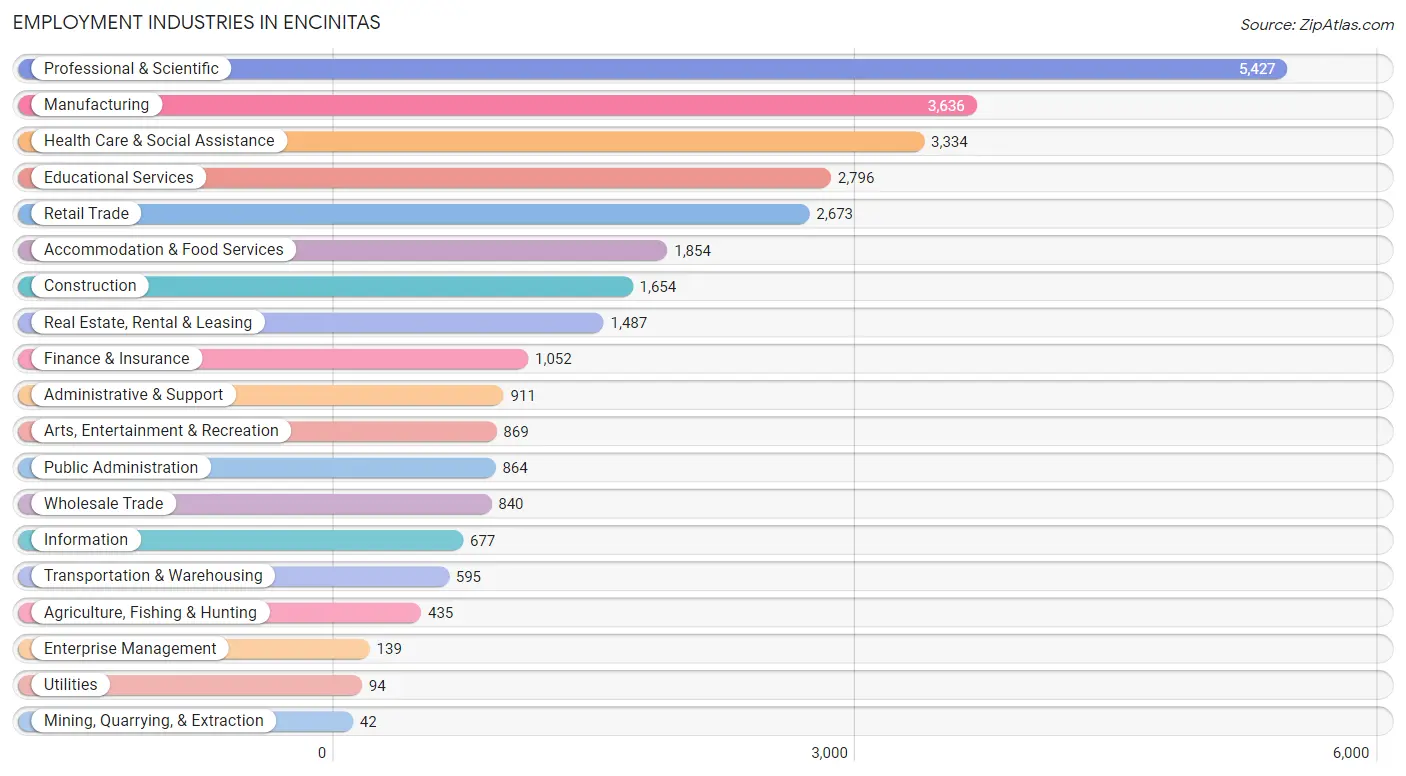
Employment Industries in Encinitas
The major employment industries in Encinitas include Professional & Scientific (5,427 | 17.5%), Manufacturing (3,636 | 11.7%), Health Care & Social Assistance (3,334 | 10.8%), Educational Services (2,796 | 9.0%), and Retail Trade (2,673 | 8.6%).
Employment Industries by Sex in Encinitas
The Encinitas industries that see more men than women are Mining, Quarrying, & Extraction (100.0%), Construction (93.1%), and Utilities (84.0%), whereas the industries that tend to have a higher number of women are Educational Services (70.6%), Enterprise Management (68.3%), and Health Care & Social Assistance (66.2%).
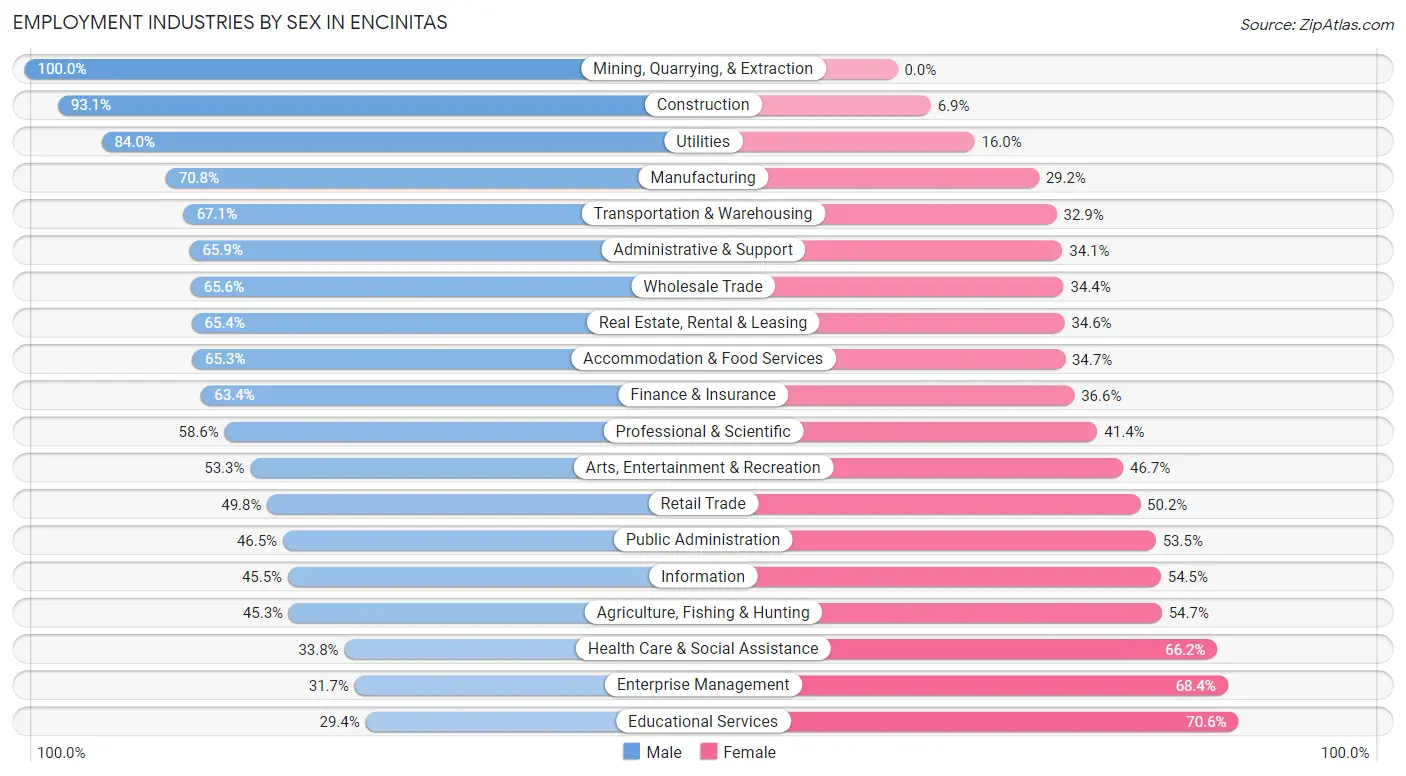
| Industry | Male | Female |
| Agriculture, Fishing & Hunting | 197 (45.3%) | 238 (54.7%) |
| Mining, Quarrying, & Extraction | 42 (100.0%) | 0 (0.0%) |
| Construction | 1,540 (93.1%) | 114 (6.9%) |
| Manufacturing | 2,573 (70.8%) | 1,063 (29.2%) |
| Wholesale Trade | 551 (65.6%) | 289 (34.4%) |
| Retail Trade | 1,330 (49.8%) | 1,343 (50.2%) |
| Transportation & Warehousing | 399 (67.1%) | 196 (32.9%) |
| Utilities | 79 (84.0%) | 15 (16.0%) |
| Information | 308 (45.5%) | 369 (54.5%) |
| Finance & Insurance | 667 (63.4%) | 385 (36.6%) |
| Real Estate, Rental & Leasing | 973 (65.4%) | 514 (34.6%) |
| Professional & Scientific | 3,181 (58.6%) | 2,246 (41.4%) |
| Enterprise Management | 44 (31.7%) | 95 (68.3%) |
| Administrative & Support | 600 (65.9%) | 311 (34.1%) |
| Educational Services | 823 (29.4%) | 1,973 (70.6%) |
| Health Care & Social Assistance | 1,127 (33.8%) | 2,207 (66.2%) |
| Arts, Entertainment & Recreation | 463 (53.3%) | 406 (46.7%) |
| Accommodation & Food Services | 1,211 (65.3%) | 643 (34.7%) |
| Public Administration | 402 (46.5%) | 462 (53.5%) |
| Total | 16,837 (54.3%) | 14,147 (45.7%) |
Education in Encinitas
School Enrollment in Encinitas
The most common levels of schooling among the 14,111 students in Encinitas are high school (3,583 | 25.4%), middle school (2,896 | 20.5%), and elementary school (2,518 | 17.8%).
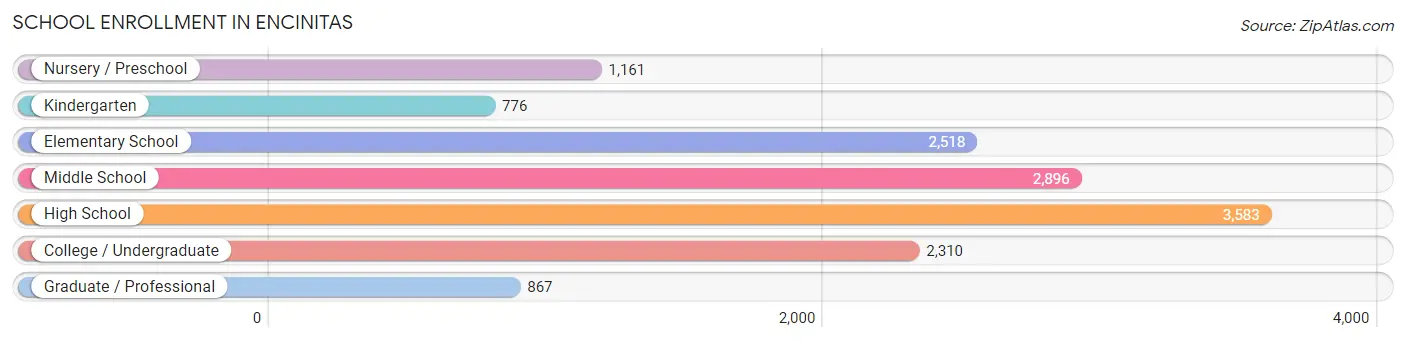
| School Level | # Students | % Students |
| Nursery / Preschool | 1,161 | 8.2% |
| Kindergarten | 776 | 5.5% |
| Elementary School | 2,518 | 17.8% |
| Middle School | 2,896 | 20.5% |
| High School | 3,583 | 25.4% |
| College / Undergraduate | 2,310 | 16.4% |
| Graduate / Professional | 867 | 6.1% |
| Total | 14,111 | 100.0% |
School Enrollment by Age by Funding Source in Encinitas
Out of a total of 14,111 students who are enrolled in schools in Encinitas, 2,836 (20.1%) attend a private institution, while the remaining 11,275 (79.9%) are enrolled in public schools. The age group of 3 to 4 year olds has the highest likelihood of being enrolled in private schools, with 693 (71.2% in the age bracket) enrolled. Conversely, the age group of 18 to 19 year olds has the lowest likelihood of being enrolled in a private school, with 960 (91.5% in the age bracket) attending a public institution.
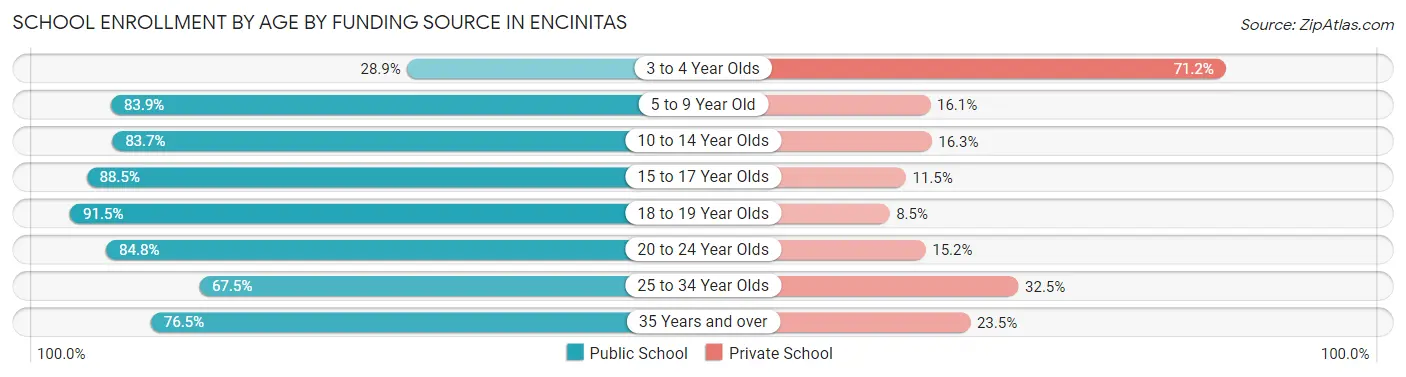
| Age Bracket | Public School | Private School |
| 3 to 4 Year Olds | 281 (28.8%) | 693 (71.2%) |
| 5 to 9 Year Old | 2,558 (83.9%) | 490 (16.1%) |
| 10 to 14 Year Olds | 3,296 (83.7%) | 643 (16.3%) |
| 15 to 17 Year Olds | 2,041 (88.5%) | 266 (11.5%) |
| 18 to 19 Year Olds | 960 (91.5%) | 89 (8.5%) |
| 20 to 24 Year Olds | 826 (84.8%) | 148 (15.2%) |
| 25 to 34 Year Olds | 586 (67.5%) | 282 (32.5%) |
| 35 Years and over | 728 (76.5%) | 224 (23.5%) |
| Total | 11,275 (79.9%) | 2,836 (20.1%) |
Educational Attainment by Field of Study in Encinitas
Business (5,568 | 17.4%), social sciences (3,507 | 10.9%), engineering (2,894 | 9.0%), bio, nature & agricultural (2,862 | 8.9%), and psychology (2,127 | 6.6%) are the most common fields of study among 32,076 individuals in Encinitas who have obtained a bachelor's degree or higher.
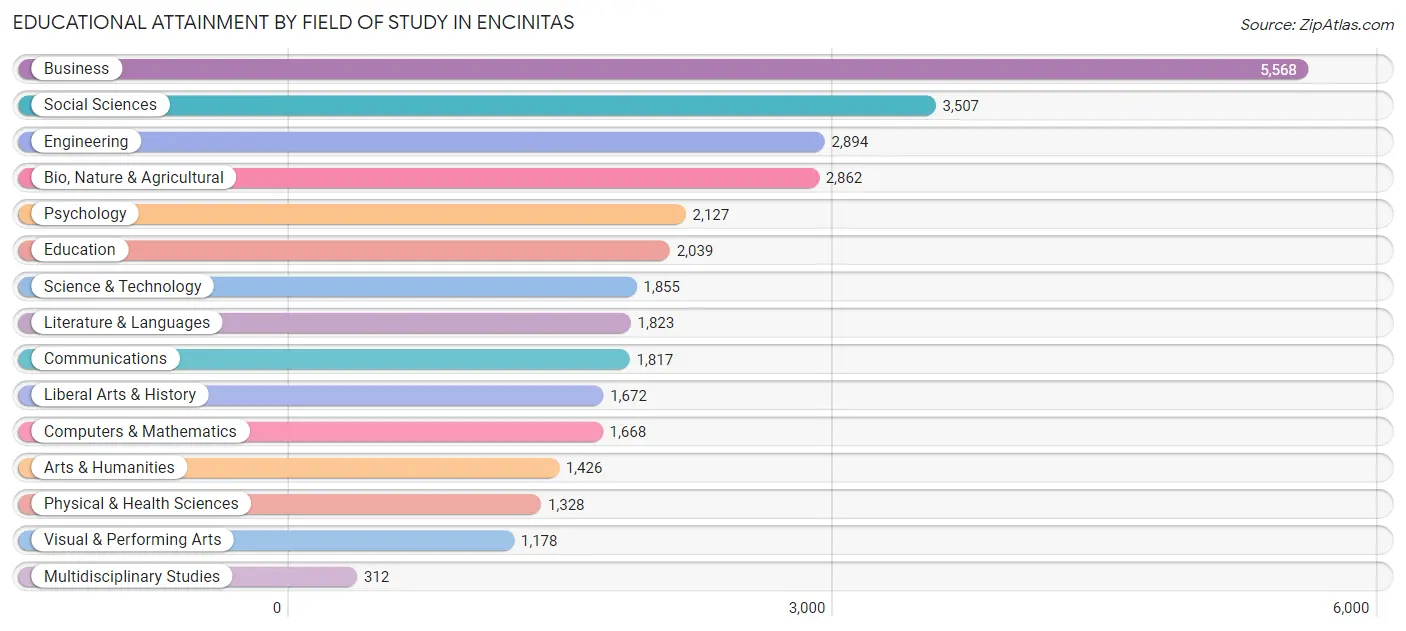
| Field of Study | # Graduates | % Graduates |
| Computers & Mathematics | 1,668 | 5.2% |
| Bio, Nature & Agricultural | 2,862 | 8.9% |
| Physical & Health Sciences | 1,328 | 4.1% |
| Psychology | 2,127 | 6.6% |
| Social Sciences | 3,507 | 10.9% |
| Engineering | 2,894 | 9.0% |
| Multidisciplinary Studies | 312 | 1.0% |
| Science & Technology | 1,855 | 5.8% |
| Business | 5,568 | 17.4% |
| Education | 2,039 | 6.4% |
| Literature & Languages | 1,823 | 5.7% |
| Liberal Arts & History | 1,672 | 5.2% |
| Visual & Performing Arts | 1,178 | 3.7% |
| Communications | 1,817 | 5.7% |
| Arts & Humanities | 1,426 | 4.4% |
| Total | 32,076 | 100.0% |
Transportation & Commute in Encinitas
Vehicle Availability by Sex in Encinitas
The most prevalent vehicle ownership categories in Encinitas are males with 2 vehicles (7,907, accounting for 47.1%) and females with 2 vehicles (6,382, making up 57.2%).
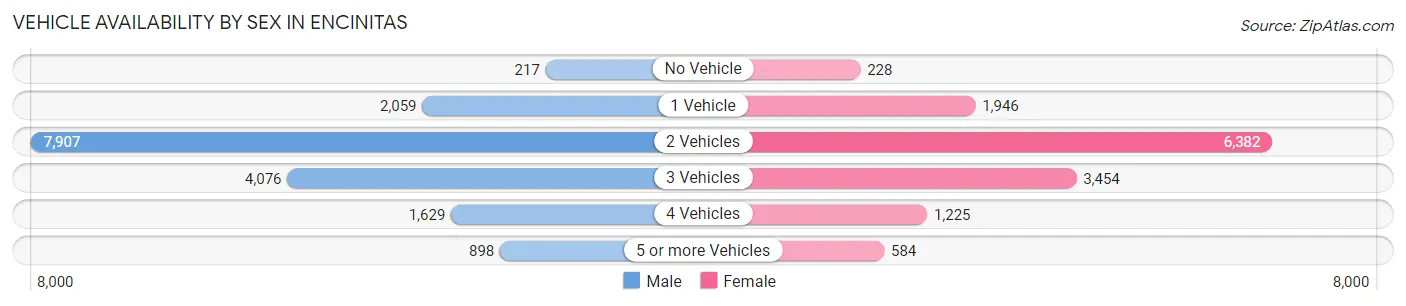
| Vehicles Available | Male | Female |
| No Vehicle | 217 (1.3%) | 228 (1.7%) |
| 1 Vehicle | 2,059 (12.3%) | 1,946 (14.1%) |
| 2 Vehicles | 7,907 (47.1%) | 6,382 (46.2%) |
| 3 Vehicles | 4,076 (24.3%) | 3,454 (25.0%) |
| 4 Vehicles | 1,629 (9.7%) | 1,225 (8.9%) |
| 5 or more Vehicles | 898 (5.3%) | 584 (4.2%) |
| Total | 16,786 (100.0%) | 13,819 (100.0%) |
Commute Time in Encinitas
The most frequently occuring commute durations in Encinitas are 15 to 19 minutes (3,886 commuters, 17.2%), 20 to 24 minutes (3,705 commuters, 16.4%), and 30 to 34 minutes (3,327 commuters, 14.7%).
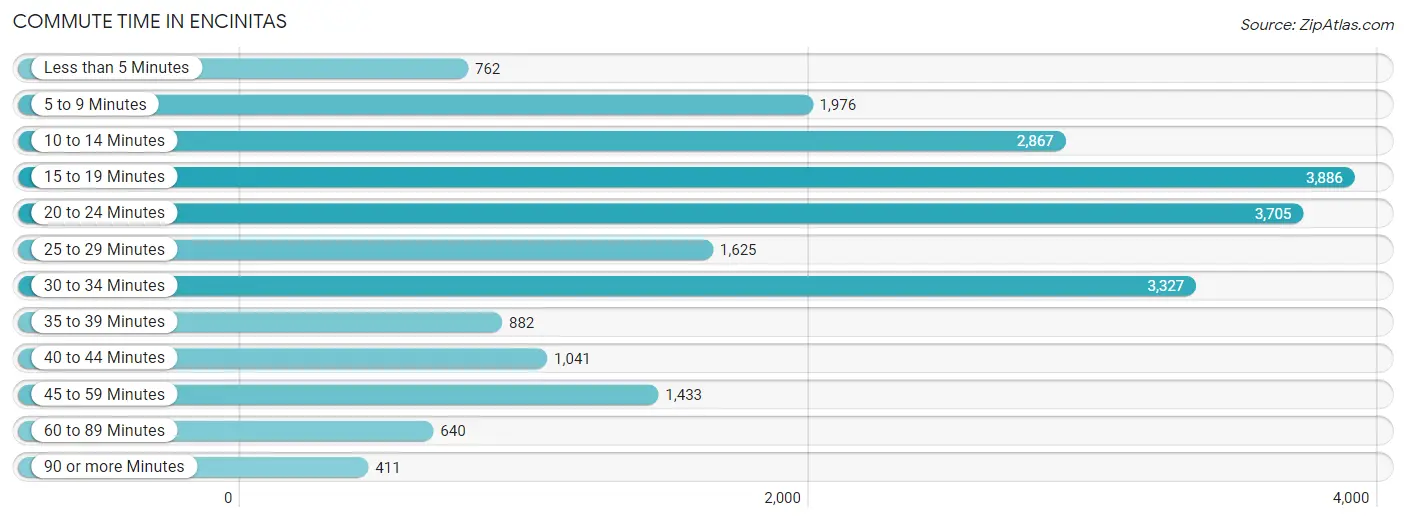
| Commute Time | # Commuters | % Commuters |
| Less than 5 Minutes | 762 | 3.4% |
| 5 to 9 Minutes | 1,976 | 8.8% |
| 10 to 14 Minutes | 2,867 | 12.7% |
| 15 to 19 Minutes | 3,886 | 17.2% |
| 20 to 24 Minutes | 3,705 | 16.4% |
| 25 to 29 Minutes | 1,625 | 7.2% |
| 30 to 34 Minutes | 3,327 | 14.7% |
| 35 to 39 Minutes | 882 | 3.9% |
| 40 to 44 Minutes | 1,041 | 4.6% |
| 45 to 59 Minutes | 1,433 | 6.4% |
| 60 to 89 Minutes | 640 | 2.8% |
| 90 or more Minutes | 411 | 1.8% |
Commute Time by Sex in Encinitas
The most common commute times in Encinitas are 20 to 24 minutes (2,162 commuters, 17.6%) for males and 15 to 19 minutes (1,734 commuters, 16.9%) for females.
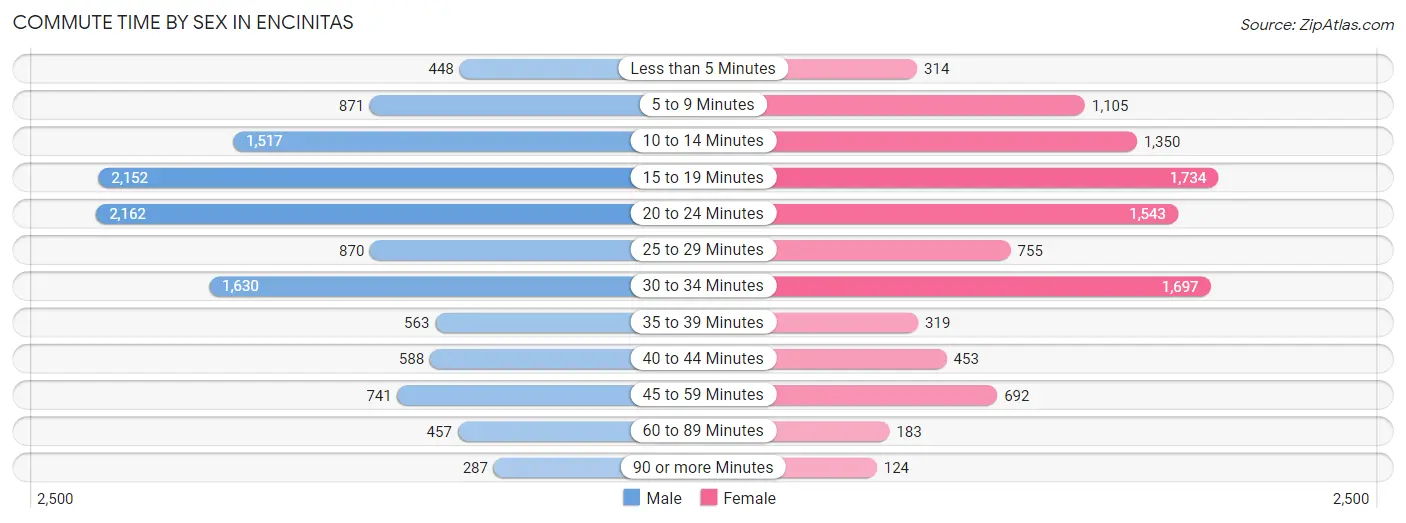
| Commute Time | Male | Female |
| Less than 5 Minutes | 448 (3.6%) | 314 (3.1%) |
| 5 to 9 Minutes | 871 (7.1%) | 1,105 (10.8%) |
| 10 to 14 Minutes | 1,517 (12.3%) | 1,350 (13.2%) |
| 15 to 19 Minutes | 2,152 (17.5%) | 1,734 (16.9%) |
| 20 to 24 Minutes | 2,162 (17.6%) | 1,543 (15.0%) |
| 25 to 29 Minutes | 870 (7.1%) | 755 (7.3%) |
| 30 to 34 Minutes | 1,630 (13.3%) | 1,697 (16.5%) |
| 35 to 39 Minutes | 563 (4.6%) | 319 (3.1%) |
| 40 to 44 Minutes | 588 (4.8%) | 453 (4.4%) |
| 45 to 59 Minutes | 741 (6.0%) | 692 (6.7%) |
| 60 to 89 Minutes | 457 (3.7%) | 183 (1.8%) |
| 90 or more Minutes | 287 (2.3%) | 124 (1.2%) |
Time of Departure to Work by Sex in Encinitas
The most frequent times of departure to work in Encinitas are 7:30 AM to 7:59 AM (1,781, 14.5%) for males and 7:00 AM to 7:29 AM (1,614, 15.7%) for females.
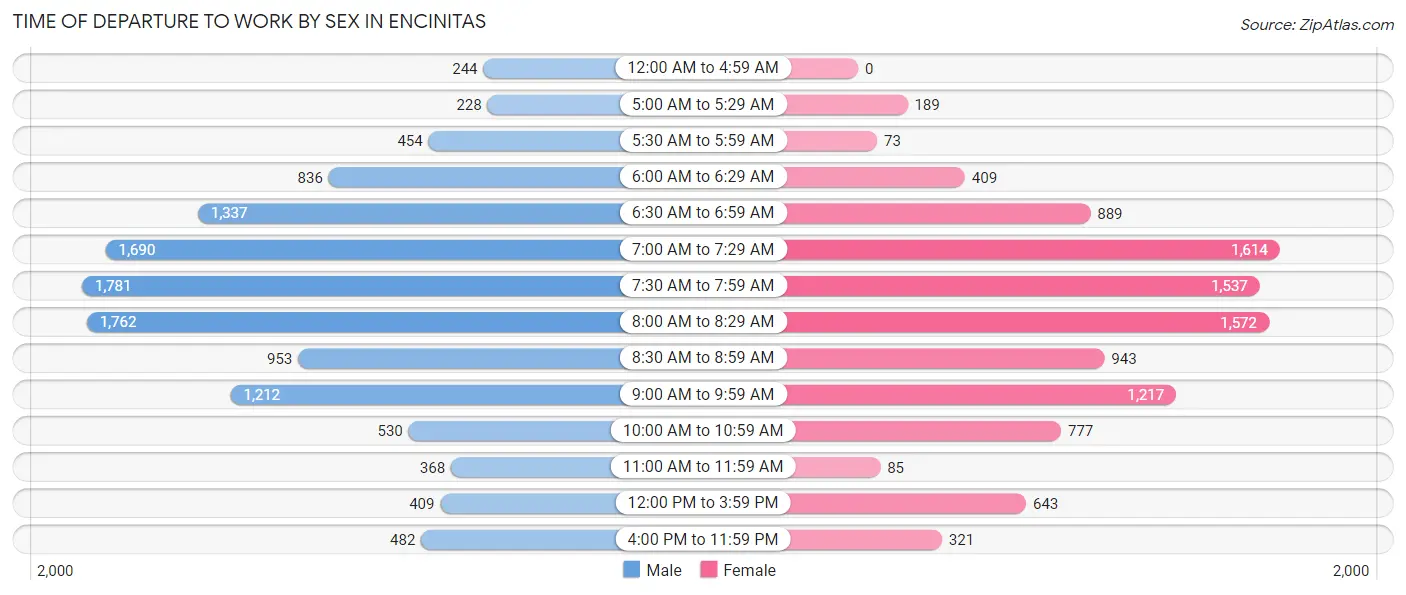
| Time of Departure | Male | Female |
| 12:00 AM to 4:59 AM | 244 (2.0%) | 0 (0.0%) |
| 5:00 AM to 5:29 AM | 228 (1.9%) | 189 (1.8%) |
| 5:30 AM to 5:59 AM | 454 (3.7%) | 73 (0.7%) |
| 6:00 AM to 6:29 AM | 836 (6.8%) | 409 (4.0%) |
| 6:30 AM to 6:59 AM | 1,337 (10.9%) | 889 (8.7%) |
| 7:00 AM to 7:29 AM | 1,690 (13.8%) | 1,614 (15.7%) |
| 7:30 AM to 7:59 AM | 1,781 (14.5%) | 1,537 (15.0%) |
| 8:00 AM to 8:29 AM | 1,762 (14.3%) | 1,572 (15.3%) |
| 8:30 AM to 8:59 AM | 953 (7.8%) | 943 (9.2%) |
| 9:00 AM to 9:59 AM | 1,212 (9.9%) | 1,217 (11.8%) |
| 10:00 AM to 10:59 AM | 530 (4.3%) | 777 (7.6%) |
| 11:00 AM to 11:59 AM | 368 (3.0%) | 85 (0.8%) |
| 12:00 PM to 3:59 PM | 409 (3.3%) | 643 (6.3%) |
| 4:00 PM to 11:59 PM | 482 (3.9%) | 321 (3.1%) |
| Total | 12,286 (100.0%) | 10,269 (100.0%) |
Housing Occupancy in Encinitas
Occupancy by Ownership in Encinitas
Of the total 23,837 dwellings in Encinitas, owner-occupied units account for 15,552 (65.2%), while renter-occupied units make up 8,285 (34.8%).
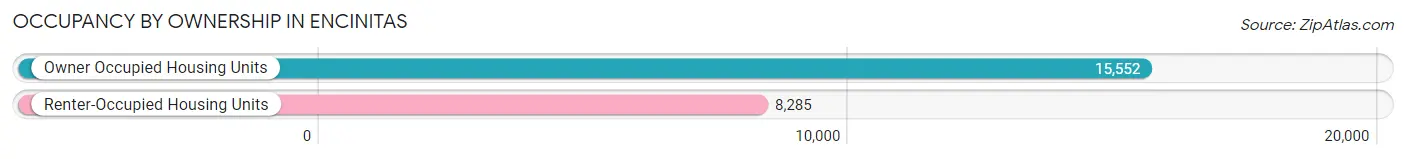
| Occupancy | # Housing Units | % Housing Units |
| Owner Occupied Housing Units | 15,552 | 65.2% |
| Renter-Occupied Housing Units | 8,285 | 34.8% |
| Total Occupied Housing Units | 23,837 | 100.0% |
Occupancy by Household Size in Encinitas
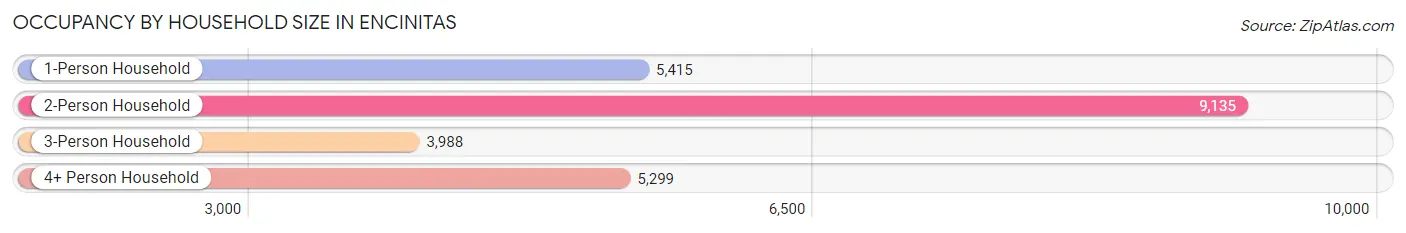
| Household Size | # Housing Units | % Housing Units |
| 1-Person Household | 5,415 | 22.7% |
| 2-Person Household | 9,135 | 38.3% |
| 3-Person Household | 3,988 | 16.7% |
| 4+ Person Household | 5,299 | 22.2% |
| Total Housing Units | 23,837 | 100.0% |
Occupancy by Ownership by Household Size in Encinitas
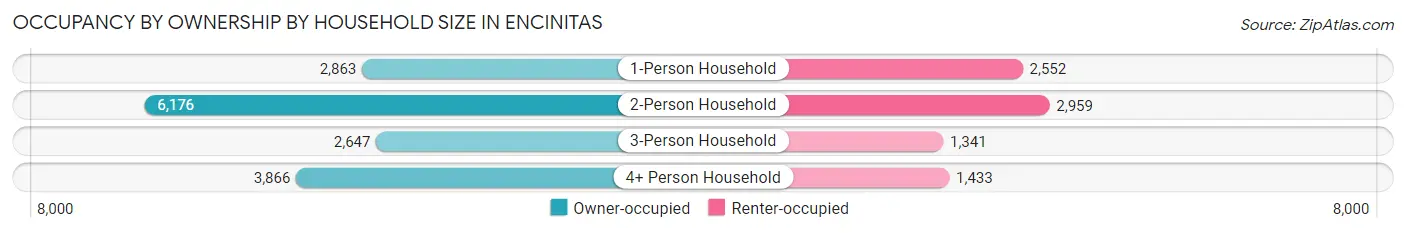
| Household Size | Owner-occupied | Renter-occupied |
| 1-Person Household | 2,863 (52.9%) | 2,552 (47.1%) |
| 2-Person Household | 6,176 (67.6%) | 2,959 (32.4%) |
| 3-Person Household | 2,647 (66.4%) | 1,341 (33.6%) |
| 4+ Person Household | 3,866 (73.0%) | 1,433 (27.0%) |
| Total Housing Units | 15,552 (65.2%) | 8,285 (34.8%) |
Occupancy by Educational Attainment in Encinitas
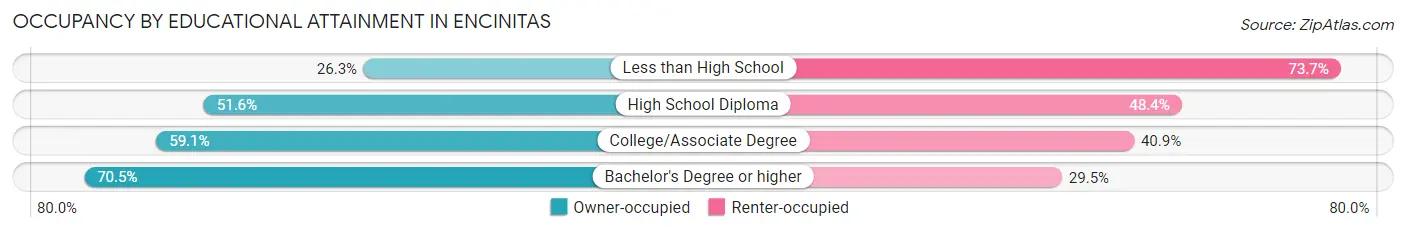
| Household Size | Owner-occupied | Renter-occupied |
| Less than High School | 241 (26.3%) | 674 (73.7%) |
| High School Diploma | 808 (51.6%) | 759 (48.4%) |
| College/Associate Degree | 2,898 (59.1%) | 2,005 (40.9%) |
| Bachelor's Degree or higher | 11,605 (70.5%) | 4,847 (29.5%) |
Occupancy by Age of Householder in Encinitas
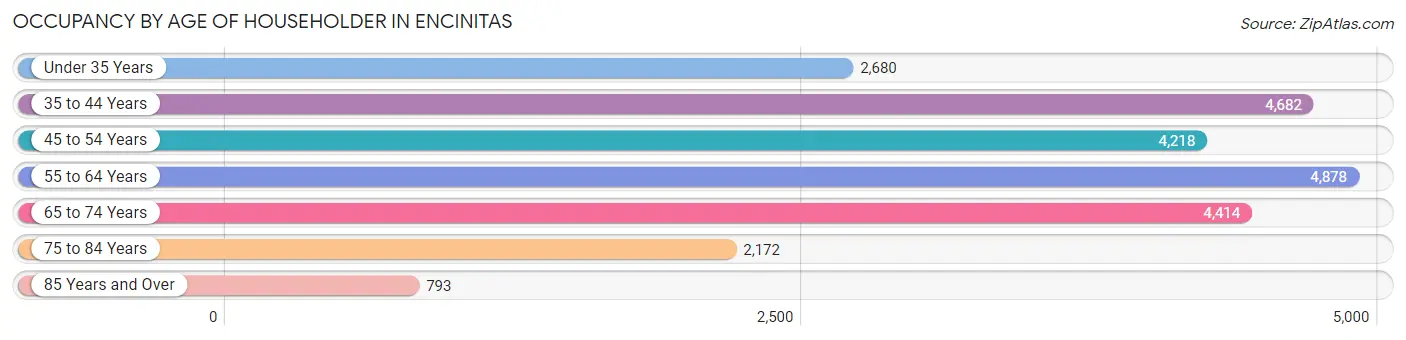
| Age Bracket | # Households | % Households |
| Under 35 Years | 2,680 | 11.2% |
| 35 to 44 Years | 4,682 | 19.6% |
| 45 to 54 Years | 4,218 | 17.7% |
| 55 to 64 Years | 4,878 | 20.5% |
| 65 to 74 Years | 4,414 | 18.5% |
| 75 to 84 Years | 2,172 | 9.1% |
| 85 Years and Over | 793 | 3.3% |
| Total | 23,837 | 100.0% |
Housing Finances in Encinitas
Median Income by Occupancy in Encinitas
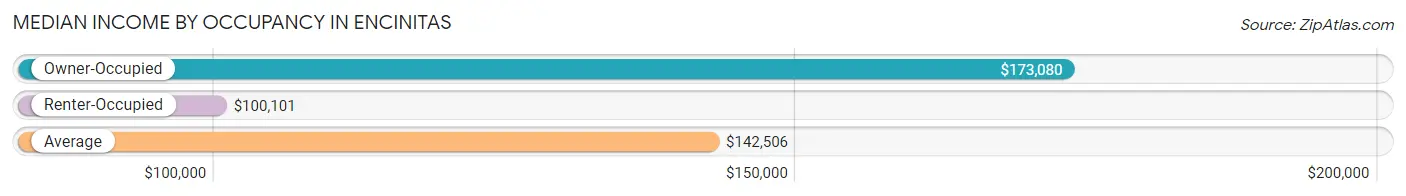
| Occupancy Type | # Households | Median Income |
| Owner-Occupied | 15,552 (65.2%) | $173,080 |
| Renter-Occupied | 8,285 (34.8%) | $100,101 |
| Average | 23,837 (100.0%) | $142,506 |
Occupancy by Householder Income Bracket in Encinitas
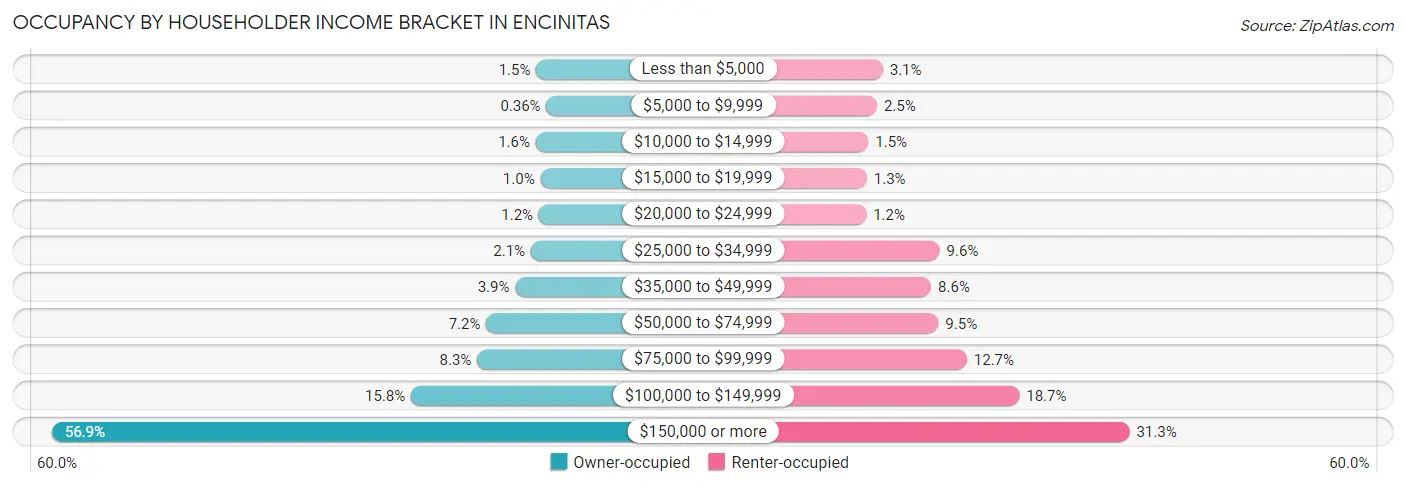
| Income Bracket | Owner-occupied | Renter-occupied |
| Less than $5,000 | 237 (1.5%) | 258 (3.1%) |
| $5,000 to $9,999 | 56 (0.4%) | 203 (2.5%) |
| $10,000 to $14,999 | 246 (1.6%) | 121 (1.5%) |
| $15,000 to $19,999 | 161 (1.0%) | 107 (1.3%) |
| $20,000 to $24,999 | 190 (1.2%) | 101 (1.2%) |
| $25,000 to $34,999 | 332 (2.1%) | 796 (9.6%) |
| $35,000 to $49,999 | 609 (3.9%) | 716 (8.6%) |
| $50,000 to $74,999 | 1,124 (7.2%) | 785 (9.5%) |
| $75,000 to $99,999 | 1,287 (8.3%) | 1,054 (12.7%) |
| $100,000 to $149,999 | 2,462 (15.8%) | 1,550 (18.7%) |
| $150,000 or more | 8,848 (56.9%) | 2,594 (31.3%) |
| Total | 15,552 (100.0%) | 8,285 (100.0%) |
Monthly Housing Cost Tiers in Encinitas
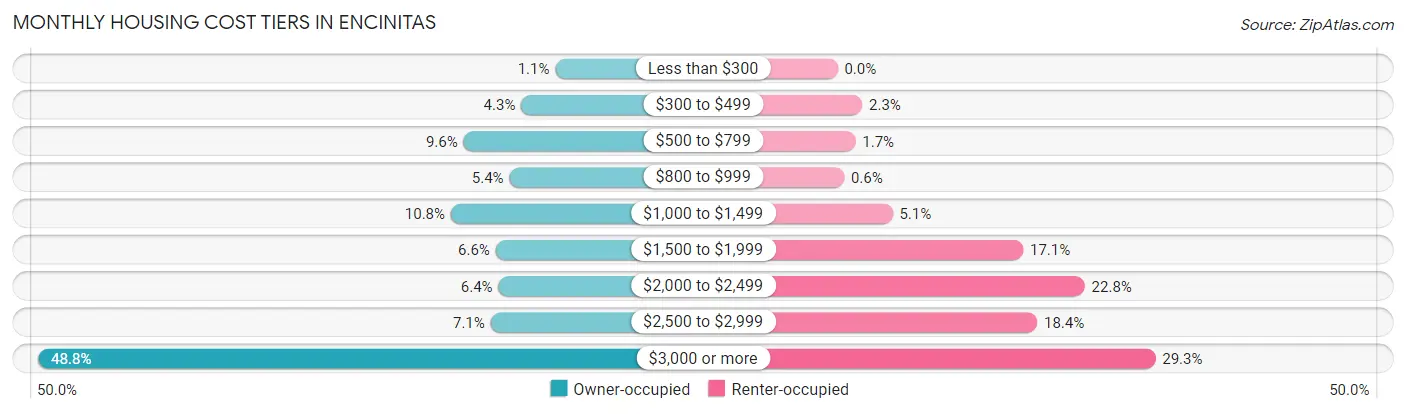
| Monthly Cost | Owner-occupied | Renter-occupied |
| Less than $300 | 177 (1.1%) | 0 (0.0%) |
| $300 to $499 | 666 (4.3%) | 188 (2.3%) |
| $500 to $799 | 1,491 (9.6%) | 137 (1.7%) |
| $800 to $999 | 835 (5.4%) | 50 (0.6%) |
| $1,000 to $1,499 | 1,673 (10.8%) | 420 (5.1%) |
| $1,500 to $1,999 | 1,031 (6.6%) | 1,416 (17.1%) |
| $2,000 to $2,499 | 992 (6.4%) | 1,886 (22.8%) |
| $2,500 to $2,999 | 1,104 (7.1%) | 1,523 (18.4%) |
| $3,000 or more | 7,583 (48.8%) | 2,424 (29.3%) |
| Total | 15,552 (100.0%) | 8,285 (100.0%) |
Physical Housing Characteristics in Encinitas
Housing Structures in Encinitas
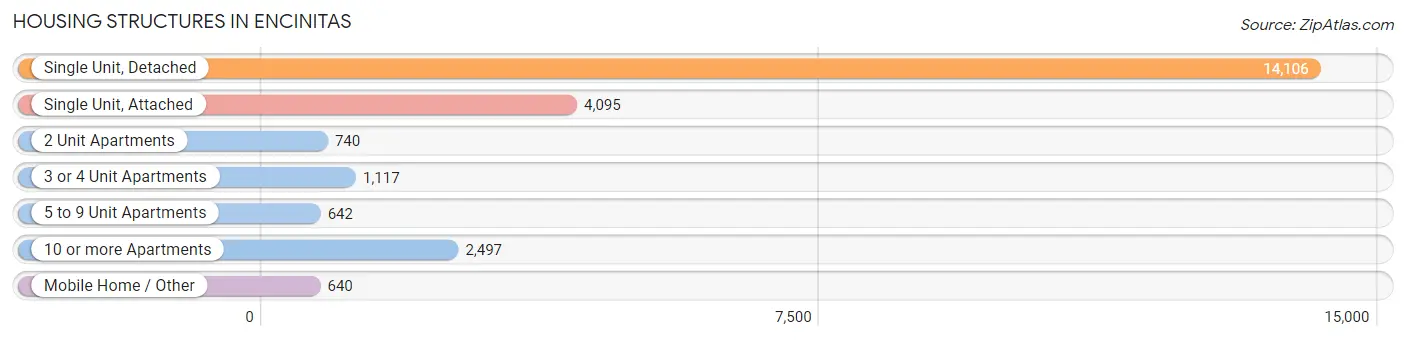
| Structure Type | # Housing Units | % Housing Units |
| Single Unit, Detached | 14,106 | 59.2% |
| Single Unit, Attached | 4,095 | 17.2% |
| 2 Unit Apartments | 740 | 3.1% |
| 3 or 4 Unit Apartments | 1,117 | 4.7% |
| 5 to 9 Unit Apartments | 642 | 2.7% |
| 10 or more Apartments | 2,497 | 10.5% |
| Mobile Home / Other | 640 | 2.7% |
| Total | 23,837 | 100.0% |
Housing Structures by Occupancy in Encinitas
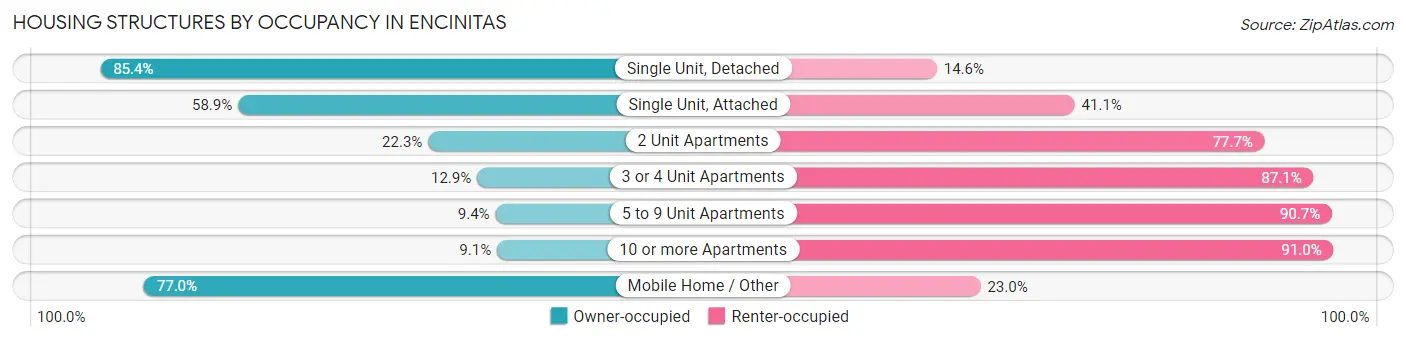
| Structure Type | Owner-occupied | Renter-occupied |
| Single Unit, Detached | 12,052 (85.4%) | 2,054 (14.6%) |
| Single Unit, Attached | 2,412 (58.9%) | 1,683 (41.1%) |
| 2 Unit Apartments | 165 (22.3%) | 575 (77.7%) |
| 3 or 4 Unit Apartments | 144 (12.9%) | 973 (87.1%) |
| 5 to 9 Unit Apartments | 60 (9.3%) | 582 (90.6%) |
| 10 or more Apartments | 226 (9.0%) | 2,271 (90.9%) |
| Mobile Home / Other | 493 (77.0%) | 147 (23.0%) |
| Total | 15,552 (65.2%) | 8,285 (34.8%) |
Housing Structures by Number of Rooms in Encinitas
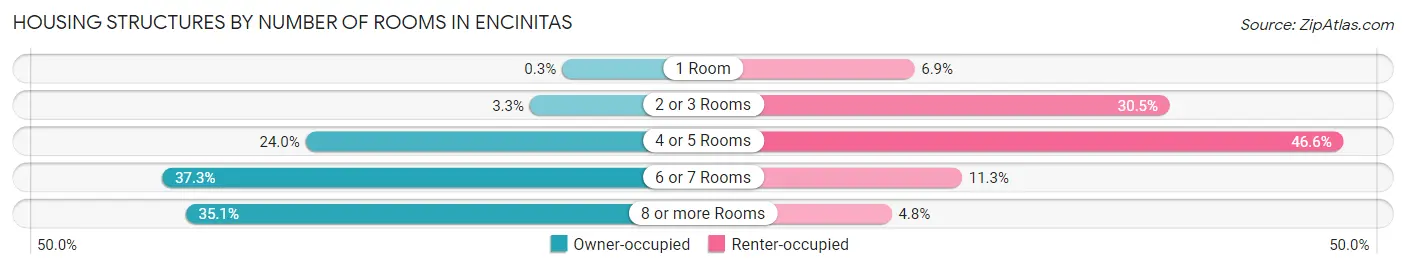
| Number of Rooms | Owner-occupied | Renter-occupied |
| 1 Room | 47 (0.3%) | 570 (6.9%) |
| 2 or 3 Rooms | 510 (3.3%) | 2,528 (30.5%) |
| 4 or 5 Rooms | 3,736 (24.0%) | 3,858 (46.6%) |
| 6 or 7 Rooms | 5,799 (37.3%) | 934 (11.3%) |
| 8 or more Rooms | 5,460 (35.1%) | 395 (4.8%) |
| Total | 15,552 (100.0%) | 8,285 (100.0%) |
Housing Structure by Heating Type in Encinitas
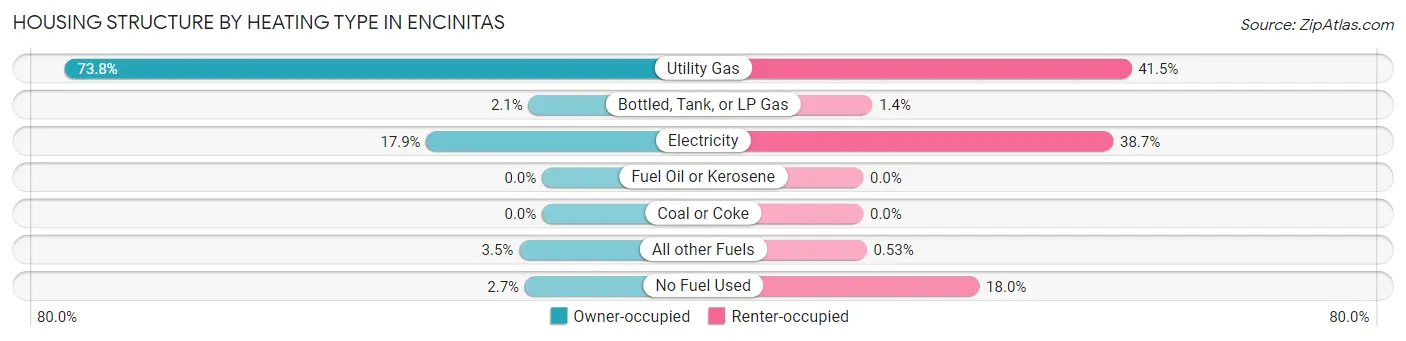
| Heating Type | Owner-occupied | Renter-occupied |
| Utility Gas | 11,484 (73.8%) | 3,434 (41.4%) |
| Bottled, Tank, or LP Gas | 325 (2.1%) | 118 (1.4%) |
| Electricity | 2,780 (17.9%) | 3,202 (38.7%) |
| Fuel Oil or Kerosene | 0 (0.0%) | 0 (0.0%) |
| Coal or Coke | 0 (0.0%) | 0 (0.0%) |
| All other Fuels | 550 (3.5%) | 44 (0.5%) |
| No Fuel Used | 413 (2.7%) | 1,487 (17.9%) |
| Total | 15,552 (100.0%) | 8,285 (100.0%) |
Household Vehicle Usage in Encinitas
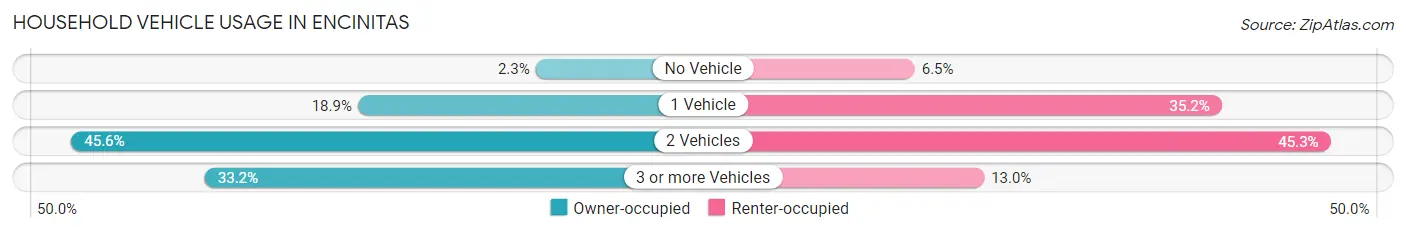
| Vehicles per Household | Owner-occupied | Renter-occupied |
| No Vehicle | 358 (2.3%) | 540 (6.5%) |
| 1 Vehicle | 2,939 (18.9%) | 2,913 (35.2%) |
| 2 Vehicles | 7,096 (45.6%) | 3,755 (45.3%) |
| 3 or more Vehicles | 5,159 (33.2%) | 1,077 (13.0%) |
| Total | 15,552 (100.0%) | 8,285 (100.0%) |
Real Estate & Mortgages in Encinitas
Real Estate and Mortgage Overview in Encinitas
| Characteristic | Without Mortgage | With Mortgage |
| Housing Units | 5,647 | 9,905 |
| Median Property Value | $1,195,800 | $1,451,600 |
| Median Household Income | $109,443 | $6,649 |
| Monthly Housing Costs | $929 | $7,276 |
| Real Estate Taxes | $5,381 | $99 |
Property Value by Mortgage Status in Encinitas
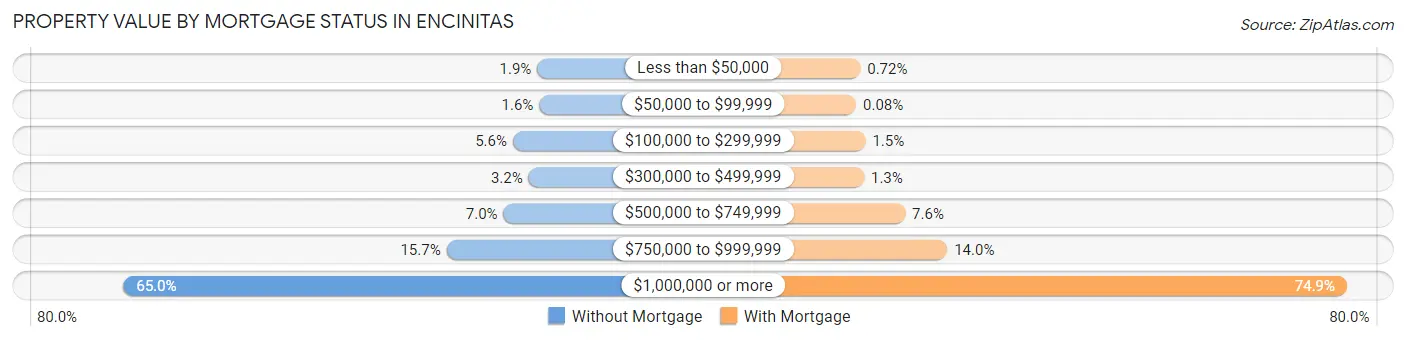
| Property Value | Without Mortgage | With Mortgage |
| Less than $50,000 | 107 (1.9%) | 71 (0.7%) |
| $50,000 to $99,999 | 90 (1.6%) | 8 (0.1%) |
| $100,000 to $299,999 | 317 (5.6%) | 150 (1.5%) |
| $300,000 to $499,999 | 181 (3.2%) | 128 (1.3%) |
| $500,000 to $749,999 | 397 (7.0%) | 749 (7.6%) |
| $750,000 to $999,999 | 887 (15.7%) | 1,384 (14.0%) |
| $1,000,000 or more | 3,668 (64.9%) | 7,415 (74.9%) |
| Total | 5,647 (100.0%) | 9,905 (100.0%) |
Household Income by Mortgage Status in Encinitas
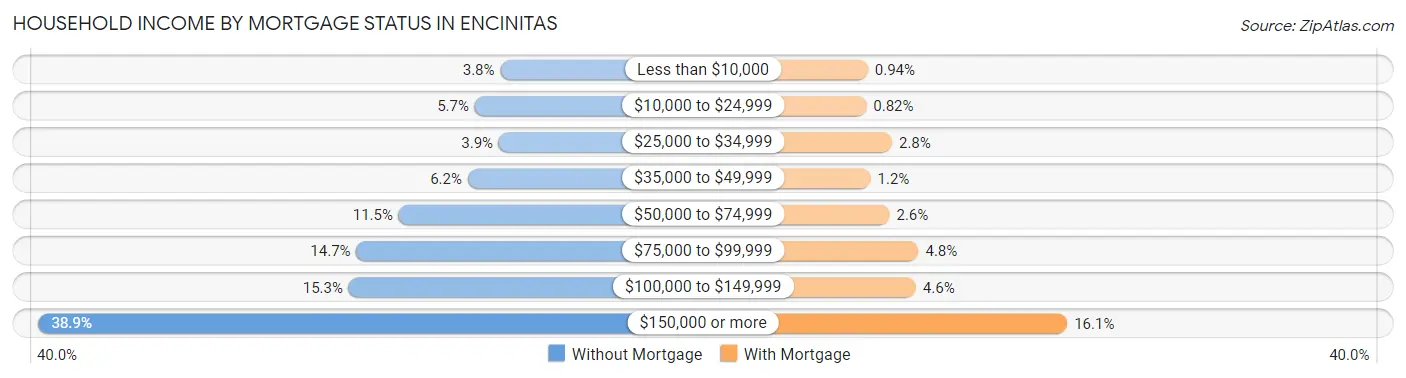
| Household Income | Without Mortgage | With Mortgage |
| Less than $10,000 | 212 (3.7%) | 93 (0.9%) |
| $10,000 to $24,999 | 322 (5.7%) | 81 (0.8%) |
| $25,000 to $34,999 | 218 (3.9%) | 275 (2.8%) |
| $35,000 to $49,999 | 352 (6.2%) | 114 (1.1%) |
| $50,000 to $74,999 | 649 (11.5%) | 257 (2.6%) |
| $75,000 to $99,999 | 831 (14.7%) | 475 (4.8%) |
| $100,000 to $149,999 | 864 (15.3%) | 456 (4.6%) |
| $150,000 or more | 2,199 (38.9%) | 1,598 (16.1%) |
| Total | 5,647 (100.0%) | 9,905 (100.0%) |
Property Value to Household Income Ratio in Encinitas
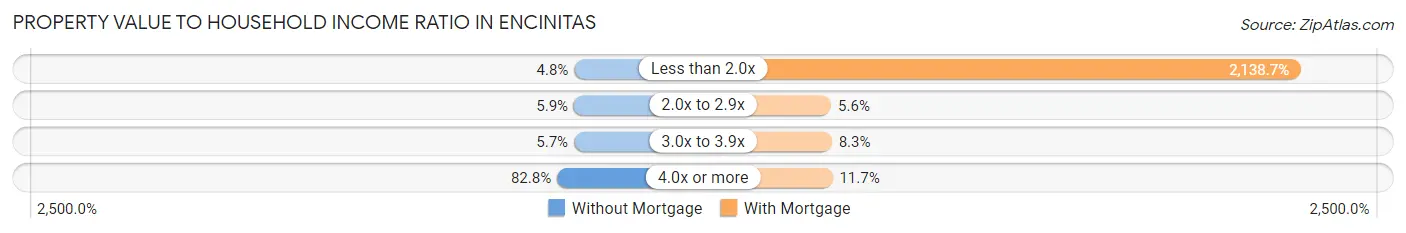
| Value-to-Income Ratio | Without Mortgage | With Mortgage |
| Less than 2.0x | 270 (4.8%) | 211,834 (2,138.7%) |
| 2.0x to 2.9x | 335 (5.9%) | 551 (5.6%) |
| 3.0x to 3.9x | 323 (5.7%) | 824 (8.3%) |
| 4.0x or more | 4,675 (82.8%) | 1,159 (11.7%) |
| Total | 5,647 (100.0%) | 9,905 (100.0%) |
Real Estate Taxes by Mortgage Status in Encinitas
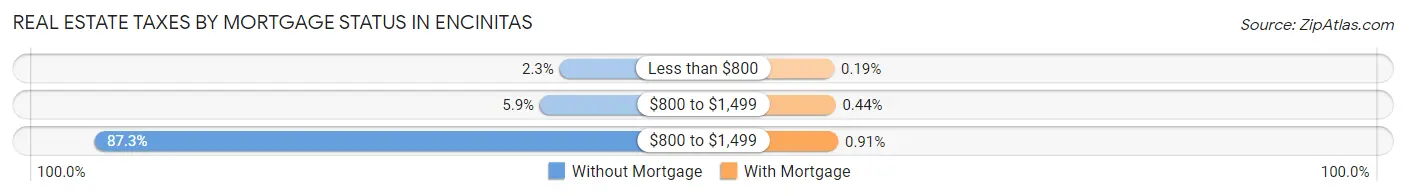
| Property Taxes | Without Mortgage | With Mortgage |
| Less than $800 | 129 (2.3%) | 19 (0.2%) |
| $800 to $1,499 | 332 (5.9%) | 44 (0.4%) |
| $800 to $1,499 | 4,931 (87.3%) | 90 (0.9%) |
| Total | 5,647 (100.0%) | 9,905 (100.0%) |
Health & Disability in Encinitas
Health Insurance Coverage by Age in Encinitas
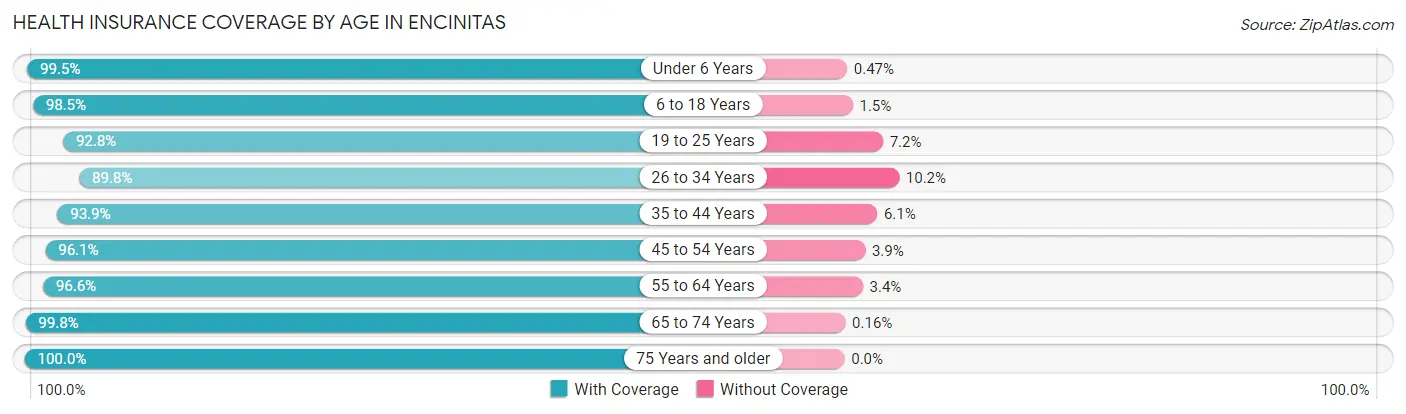
| Age Bracket | With Coverage | Without Coverage |
| Under 6 Years | 4,053 (99.5%) | 19 (0.5%) |
| 6 to 18 Years | 9,428 (98.5%) | 147 (1.5%) |
| 19 to 25 Years | 2,943 (92.8%) | 227 (7.2%) |
| 26 to 34 Years | 6,059 (89.8%) | 686 (10.2%) |
| 35 to 44 Years | 8,203 (93.9%) | 533 (6.1%) |
| 45 to 54 Years | 7,950 (96.1%) | 319 (3.9%) |
| 55 to 64 Years | 8,394 (96.6%) | 297 (3.4%) |
| 65 to 74 Years | 7,464 (99.8%) | 12 (0.2%) |
| 75 Years and older | 4,517 (100.0%) | 0 (0.0%) |
| Total | 59,011 (96.3%) | 2,240 (3.7%) |
Health Insurance Coverage by Citizenship Status in Encinitas
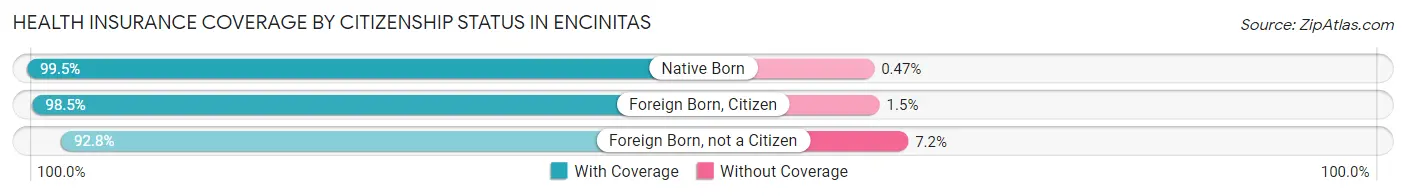
| Citizenship Status | With Coverage | Without Coverage |
| Native Born | 4,053 (99.5%) | 19 (0.5%) |
| Foreign Born, Citizen | 9,428 (98.5%) | 147 (1.5%) |
| Foreign Born, not a Citizen | 2,943 (92.8%) | 227 (7.2%) |
Health Insurance Coverage by Household Income in Encinitas
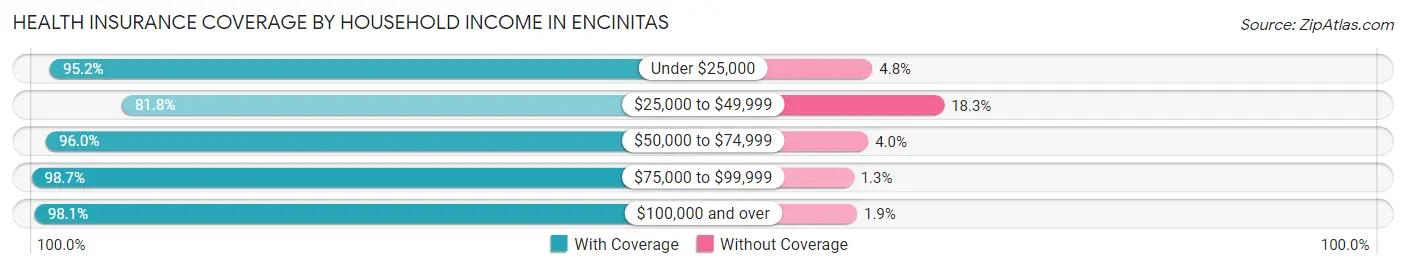
| Household Income | With Coverage | Without Coverage |
| Under $25,000 | 2,542 (95.2%) | 128 (4.8%) |
| $25,000 to $49,999 | 4,583 (81.8%) | 1,023 (18.2%) |
| $50,000 to $74,999 | 3,798 (96.0%) | 159 (4.0%) |
| $75,000 to $99,999 | 4,705 (98.7%) | 62 (1.3%) |
| $100,000 and over | 43,230 (98.1%) | 845 (1.9%) |
Public vs Private Health Insurance Coverage by Age in Encinitas
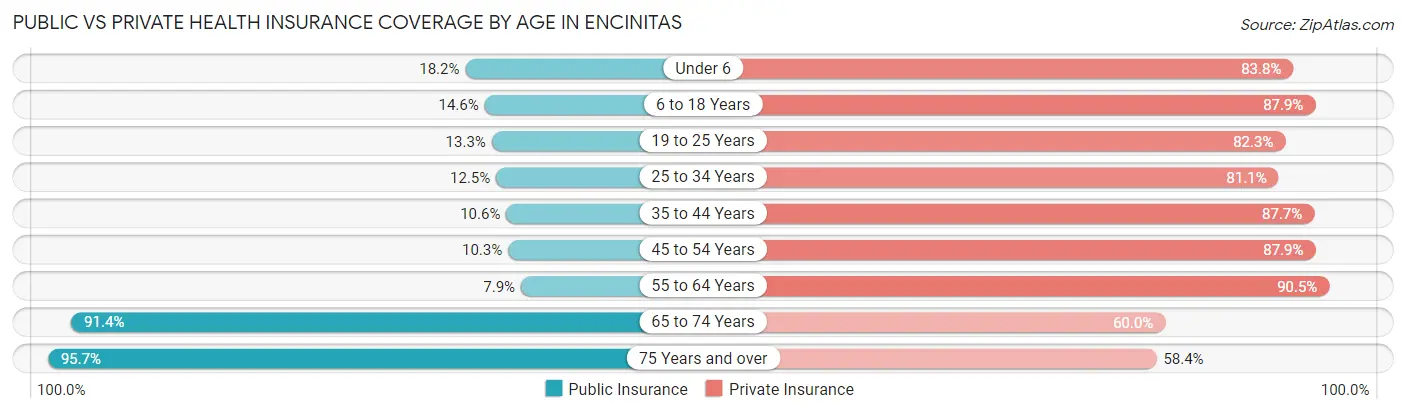
| Age Bracket | Public Insurance | Private Insurance |
| Under 6 | 741 (18.2%) | 3,412 (83.8%) |
| 6 to 18 Years | 1,401 (14.6%) | 8,413 (87.9%) |
| 19 to 25 Years | 422 (13.3%) | 2,609 (82.3%) |
| 25 to 34 Years | 842 (12.5%) | 5,468 (81.1%) |
| 35 to 44 Years | 926 (10.6%) | 7,657 (87.6%) |
| 45 to 54 Years | 848 (10.3%) | 7,268 (87.9%) |
| 55 to 64 Years | 684 (7.9%) | 7,862 (90.5%) |
| 65 to 74 Years | 6,829 (91.3%) | 4,487 (60.0%) |
| 75 Years and over | 4,323 (95.7%) | 2,638 (58.4%) |
| Total | 17,016 (27.8%) | 49,814 (81.3%) |
Disability Status by Sex by Age in Encinitas
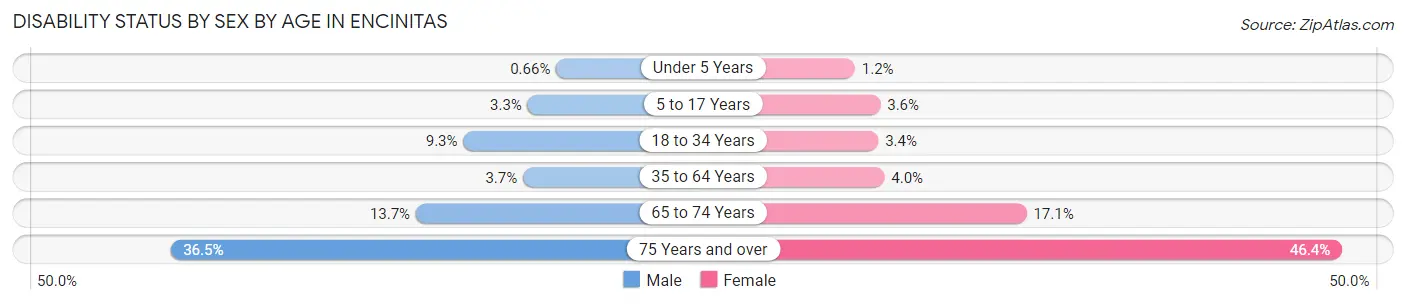
| Age Bracket | Male | Female |
| Under 5 Years | 12 (0.7%) | 19 (1.2%) |
| 5 to 17 Years | 163 (3.3%) | 163 (3.6%) |
| 18 to 34 Years | 498 (9.3%) | 180 (3.4%) |
| 35 to 64 Years | 472 (3.7%) | 516 (4.0%) |
| 65 to 74 Years | 520 (13.7%) | 630 (17.1%) |
| 75 Years and over | 565 (36.5%) | 1,378 (46.4%) |
Disability Class by Sex by Age in Encinitas
Disability Class: Hearing Difficulty
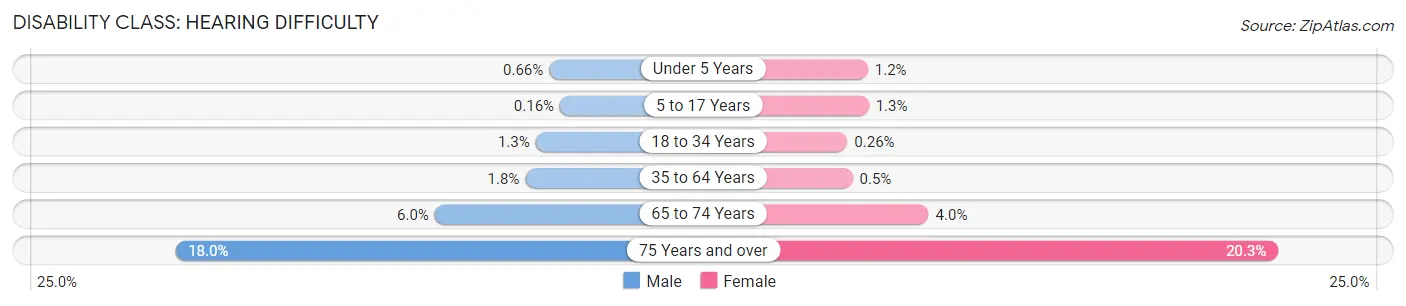
| Age Bracket | Male | Female |
| Under 5 Years | 12 (0.7%) | 19 (1.2%) |
| 5 to 17 Years | 8 (0.2%) | 57 (1.3%) |
| 18 to 34 Years | 69 (1.3%) | 14 (0.3%) |
| 35 to 64 Years | 224 (1.8%) | 65 (0.5%) |
| 65 to 74 Years | 227 (6.0%) | 148 (4.0%) |
| 75 Years and over | 279 (18.0%) | 601 (20.3%) |
Disability Class: Vision Difficulty
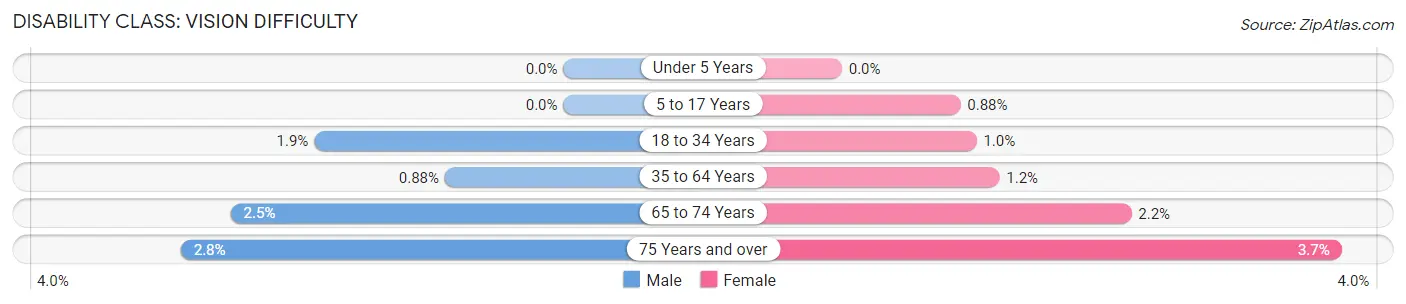
| Age Bracket | Male | Female |
| Under 5 Years | 0 (0.0%) | 0 (0.0%) |
| 5 to 17 Years | 0 (0.0%) | 40 (0.9%) |
| 18 to 34 Years | 99 (1.8%) | 53 (1.0%) |
| 35 to 64 Years | 111 (0.9%) | 153 (1.2%) |
| 65 to 74 Years | 94 (2.5%) | 79 (2.1%) |
| 75 Years and over | 44 (2.8%) | 110 (3.7%) |
Disability Class: Cognitive Difficulty
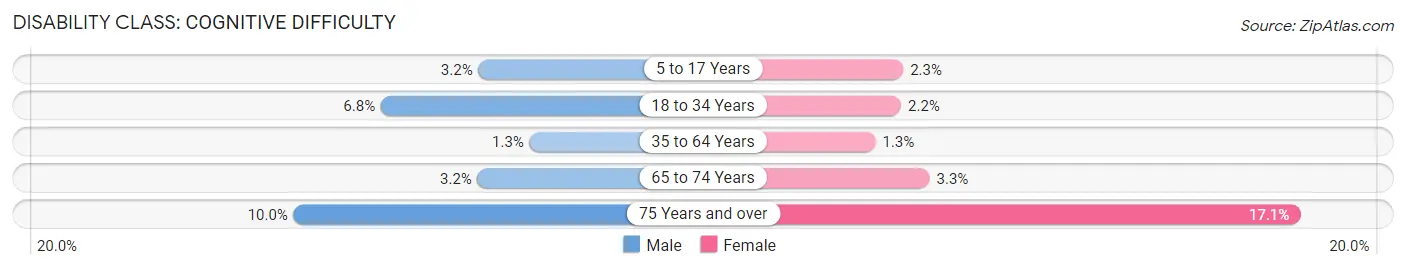
| Age Bracket | Male | Female |
| 5 to 17 Years | 155 (3.2%) | 104 (2.3%) |
| 18 to 34 Years | 363 (6.8%) | 117 (2.2%) |
| 35 to 64 Years | 158 (1.3%) | 163 (1.3%) |
| 65 to 74 Years | 121 (3.2%) | 120 (3.3%) |
| 75 Years and over | 155 (10.0%) | 506 (17.1%) |
Disability Class: Ambulatory Difficulty
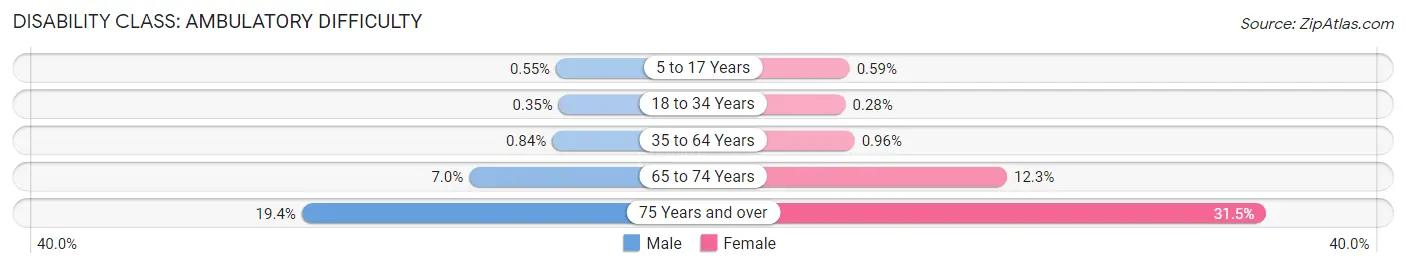
| Age Bracket | Male | Female |
| 5 to 17 Years | 27 (0.5%) | 27 (0.6%) |
| 18 to 34 Years | 19 (0.4%) | 15 (0.3%) |
| 35 to 64 Years | 106 (0.8%) | 126 (1.0%) |
| 65 to 74 Years | 266 (7.0%) | 451 (12.3%) |
| 75 Years and over | 301 (19.4%) | 935 (31.5%) |
Disability Class: Self-Care Difficulty
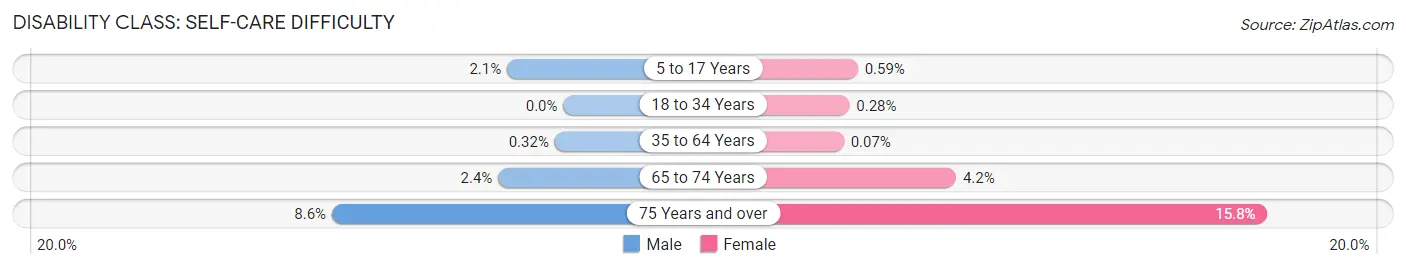
| Age Bracket | Male | Female |
| 5 to 17 Years | 103 (2.1%) | 27 (0.6%) |
| 18 to 34 Years | 0 (0.0%) | 15 (0.3%) |
| 35 to 64 Years | 41 (0.3%) | 9 (0.1%) |
| 65 to 74 Years | 92 (2.4%) | 156 (4.2%) |
| 75 Years and over | 133 (8.6%) | 469 (15.8%) |
Technology Access in Encinitas
Computing Device Access in Encinitas
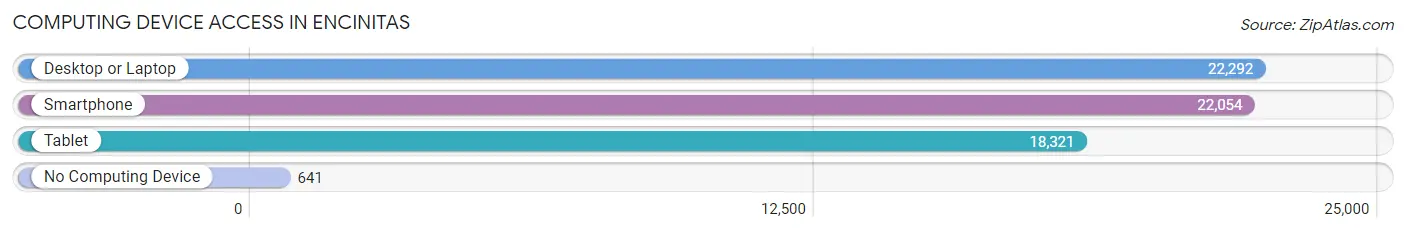
| Device Type | # Households | % Households |
| Desktop or Laptop | 22,292 | 93.5% |
| Smartphone | 22,054 | 92.5% |
| Tablet | 18,321 | 76.9% |
| No Computing Device | 641 | 2.7% |
| Total | 23,837 | 100.0% |
Internet Access in Encinitas
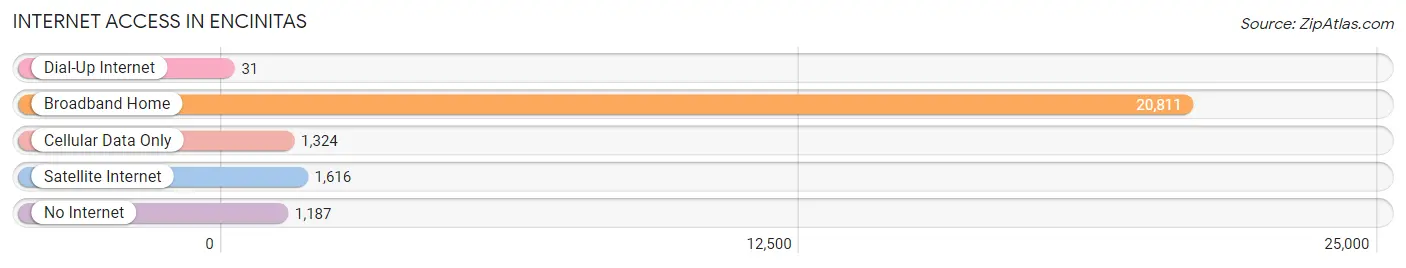
| Internet Type | # Households | % Households |
| Dial-Up Internet | 31 | 0.1% |
| Broadband Home | 20,811 | 87.3% |
| Cellular Data Only | 1,324 | 5.6% |
| Satellite Internet | 1,616 | 6.8% |
| No Internet | 1,187 | 5.0% |
| Total | 23,837 | 100.0% |
Encinitas Summary
Encinitas, California is a coastal city located in San Diego County, California. It is situated along the Pacific Ocean, just north of San Diego and south of Orange County. The city is known for its beautiful beaches, surfing, and laid-back lifestyle. Encinitas is home to a population of approximately 61,000 people, making it the fifth-largest city in San Diego County.
History
Encinitas was originally inhabited by the Luiseño Native American tribe. The area was first explored by Spanish missionaries in the late 1700s. In 1845, the area was annexed by Mexico and became part of the Rancho de los Encinitos. After the Mexican-American War, the area was ceded to the United States and became part of San Diego County.
In the late 1800s, the area began to be developed as a resort town. The first hotel was built in 1887 and the first post office was established in 1888. The city was officially incorporated in 1986.
Geography
Encinitas is located in the northern part of San Diego County, along the Pacific Ocean. It is bordered by Carlsbad to the south, San Marcos to the east, and Solana Beach to the north. The city covers an area of approximately 20 square miles and has a population density of approximately 3,000 people per square mile.
The city is divided into five distinct neighborhoods: Old Encinitas, New Encinitas, Leucadia, Cardiff-by-the-Sea, and Olivenhain. Each neighborhood has its own unique character and charm.
The city is known for its beautiful beaches, which are popular for surfing, swimming, and other beach activities. The beaches are also home to a variety of wildlife, including dolphins, seals, and sea lions.
Economy
Encinitas is a popular tourist destination, with many visitors coming to enjoy the city’s beaches and laid-back lifestyle. The city is also home to a variety of businesses, including retail stores, restaurants, and professional services.
The city’s economy is largely driven by tourism, with many visitors coming to enjoy the city’s beaches and laid-back lifestyle. The city is also home to a variety of businesses, including retail stores, restaurants, and professional services.
Demographics
As of the 2010 census, Encinitas had a population of 59,518. The racial makeup of the city was 79.2% White, 0.7% African American, 0.5% Native American, 8.3% Asian, 0.2% Pacific Islander, 8.2% from other races, and 2.9% from two or more races. Hispanic or Latino of any race were 20.7% of the population.
The median household income in Encinitas was $87,890, and the median family income was $103,890. The per capita income for the city was $41,945. About 8.2% of families and 11.2% of the population were below the poverty line, including 15.2% of those under age 18 and 5.2% of those age 65 or over.
Encinitas is a vibrant and diverse city with a unique culture and history. The city is known for its beautiful beaches, surfing, and laid-back lifestyle. It is home to a variety of businesses, and its economy is largely driven by tourism. The city is also home to a diverse population, with a variety of racial and ethnic backgrounds.
Common Questions
What is Per Capita Income in Encinitas?
Per Capita income in Encinitas is $77,874.
What is the Median Family Income in Encinitas?
Median Family Income in Encinitas is $170,000.
What is the Median Household income in Encinitas?
Median Household Income in Encinitas is $142,506.
What is Income or Wage Gap in Encinitas?
Income or Wage Gap in Encinitas is 38.3%.
Women in Encinitas earn 61.7 cents for every dollar earned by a man.
What is Family Income Deficit in Encinitas?
Family Income Deficit in Encinitas is $9,355.
Families that are below poverty line in Encinitas earn $9,355 less on average than the poverty threshold level.
What is Inequality or Gini Index in Encinitas?
Inequality or Gini Index in Encinitas is 0.48.
What is the Total Population of Encinitas?
Total Population of Encinitas is 61,942.
What is the Total Male Population of Encinitas?
Total Male Population of Encinitas is 30,469.
What is the Total Female Population of Encinitas?
Total Female Population of Encinitas is 31,473.
What is the Ratio of Males per 100 Females in Encinitas?
There are 96.81 Males per 100 Females in Encinitas.
What is the Ratio of Females per 100 Males in Encinitas?
There are 103.30 Females per 100 Males in Encinitas.
What is the Median Population Age in Encinitas?
Median Population Age in Encinitas is 42.9 Years.
What is the Average Family Size in Encinitas
Average Family Size in Encinitas is 3.1 People.
What is the Average Household Size in Encinitas
Average Household Size in Encinitas is 2.6 People.
How Large is the Labor Force in Encinitas?
There are 32,769 People in the Labor Forcein in Encinitas.
What is the Percentage of People in the Labor Force in Encinitas?
64.7% of People are in the Labor Force in Encinitas.
What is the Unemployment Rate in Encinitas?
Unemployment Rate in Encinitas is 4.6%.