Cities with the Highest Percentage of Eastern European Population in South Carolina
RELATED REPORTS & OPTIONS
Eastern European
South Carolina
Compare Cities
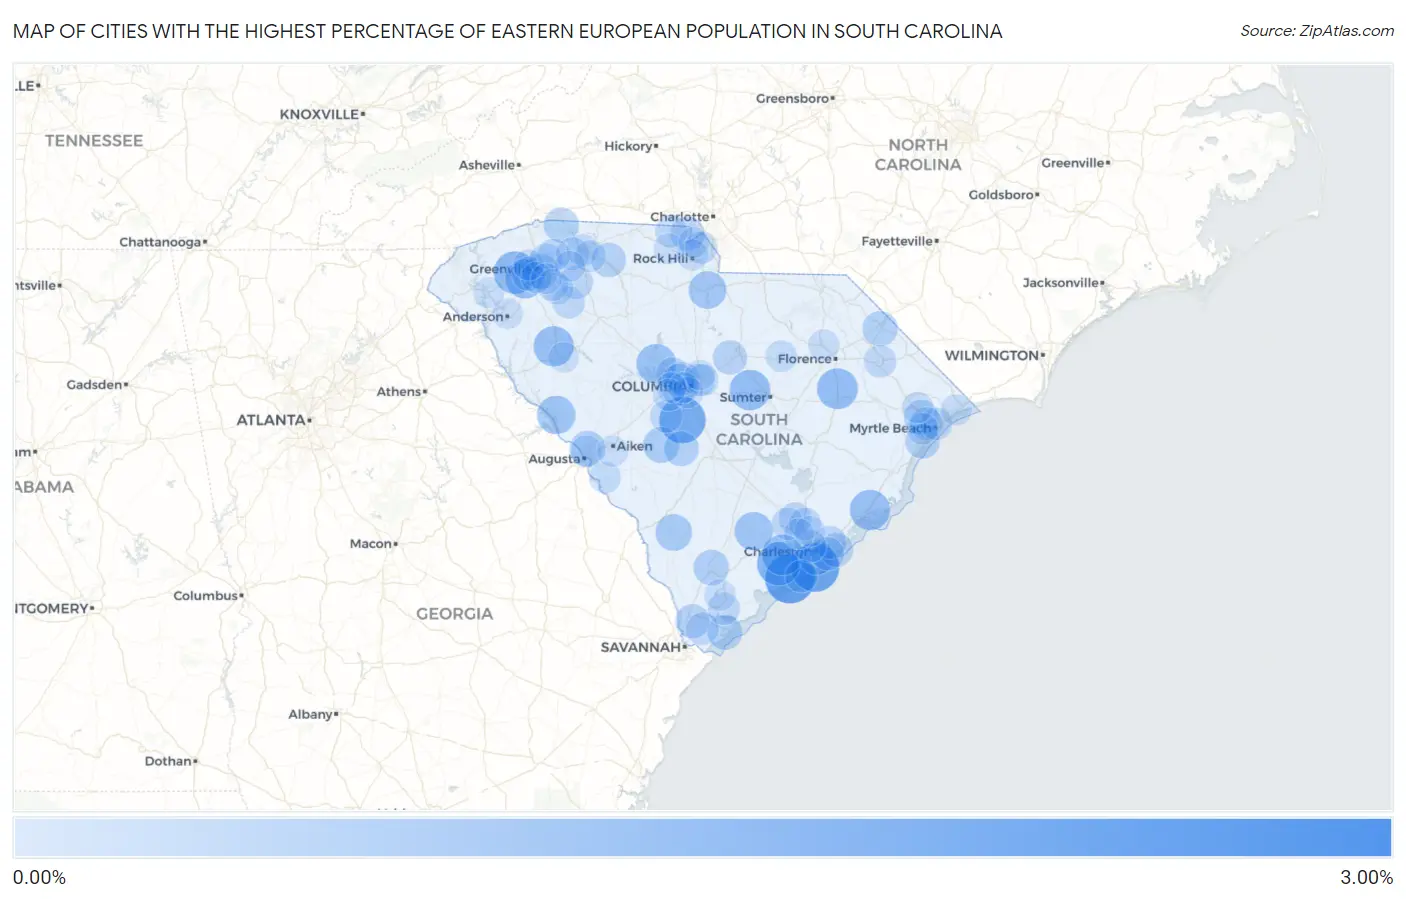
Map of Cities with the Highest Percentage of Eastern European Population in South Carolina
0.00%
3.00%
Cities with the Highest Percentage of Eastern European Population in South Carolina
| City | Eastern European | vs State | vs National | |
| 1. | Harbor Island | 2.89% | 0.16%(+2.72)#1 | 0.30%(+2.58)#400 |
| 2. | Seabrook Island | 2.28% | 0.16%(+2.12)#2 | 0.30%(+1.98)#570 |
| 3. | Folly Beach | 2.16% | 0.16%(+1.99)#3 | 0.30%(+1.85)#622 |
| 4. | Swansea | 1.89% | 0.16%(+1.73)#4 | 0.30%(+1.59)#760 |
| 5. | Keowee Key | 1.86% | 0.16%(+1.70)#5 | 0.30%(+1.56)#779 |
| 6. | Fripp Island | 1.56% | 0.16%(+1.40)#6 | 0.30%(+1.26)#957 |
| 7. | Meggett | 1.56% | 0.16%(+1.39)#7 | 0.30%(+1.25)#961 |
| 8. | Easley | 1.44% | 0.16%(+1.27)#8 | 0.30%(+1.13)#1,071 |
| 9. | Hollywood | 1.24% | 0.16%(+1.08)#9 | 0.30%(+0.938)#1,295 |
| 10. | Coward | 1.23% | 0.16%(+1.07)#10 | 0.30%(+0.929)#1,308 |
| 11. | Stateburg | 1.21% | 0.16%(+1.04)#11 | 0.30%(+0.904)#1,352 |
| 12. | Mcclellanville | 1.17% | 0.16%(+1.01)#12 | 0.30%(+0.865)#1,398 |
| 13. | Hodges | 1.16% | 0.16%(+0.993)#13 | 0.30%(+0.852)#1,418 |
| 14. | Chapin | 1.10% | 0.16%(+0.938)#14 | 0.30%(+0.798)#1,500 |
| 15. | Powdersville | 1.09% | 0.16%(+0.923)#15 | 0.30%(+0.783)#1,531 |
| 16. | Cottageville | 0.96% | 0.16%(+0.798)#16 | 0.30%(+0.658)#1,772 |
| 17. | Parksville | 0.96% | 0.16%(+0.798)#17 | 0.30%(+0.658)#1,773 |
| 18. | Fort Lawn | 0.87% | 0.16%(+0.707)#18 | 0.30%(+0.567)#1,970 |
| 19. | Brunson | 0.76% | 0.16%(+0.598)#19 | 0.30%(+0.458)#2,298 |
| 20. | The Cliffs Valley | 0.71% | 0.16%(+0.549)#20 | 0.30%(+0.409)#2,462 |
| 21. | Edmund | 0.70% | 0.16%(+0.533)#21 | 0.30%(+0.393)#2,507 |
| 22. | Salley | 0.67% | 0.16%(+0.510)#22 | 0.30%(+0.370)#2,586 |
| 23. | Belvedere | 0.64% | 0.16%(+0.476)#23 | 0.30%(+0.336)#2,703 |
| 24. | Greenville | 0.62% | 0.16%(+0.459)#24 | 0.30%(+0.319)#2,781 |
| 25. | Yemassee | 0.62% | 0.16%(+0.453)#25 | 0.30%(+0.312)#2,813 |
| 26. | Dillon | 0.57% | 0.16%(+0.410)#26 | 0.30%(+0.270)#2,995 |
| 27. | Landrum | 0.56% | 0.16%(+0.396)#27 | 0.30%(+0.255)#3,045 |
| 28. | Neeses | 0.54% | 0.16%(+0.377)#28 | 0.30%(+0.237)#3,145 |
| 29. | Hilton Head Island | 0.53% | 0.16%(+0.370)#29 | 0.30%(+0.229)#3,178 |
| 30. | Red Hill | 0.53% | 0.16%(+0.363)#30 | 0.30%(+0.222)#3,220 |
| 31. | Pacolet | 0.51% | 0.16%(+0.344)#31 | 0.30%(+0.204)#3,303 |
| 32. | Garden City | 0.50% | 0.16%(+0.333)#32 | 0.30%(+0.192)#3,358 |
| 33. | James Island | 0.49% | 0.16%(+0.324)#33 | 0.30%(+0.184)#3,410 |
| 34. | Lugoff | 0.48% | 0.16%(+0.314)#34 | 0.30%(+0.174)#3,475 |
| 35. | Lake Wylie | 0.47% | 0.16%(+0.302)#35 | 0.30%(+0.162)#3,546 |
| 36. | Welcome | 0.45% | 0.16%(+0.284)#36 | 0.30%(+0.144)#3,642 |
| 37. | Hardeeville | 0.45% | 0.16%(+0.284)#37 | 0.30%(+0.144)#3,643 |
| 38. | Isle Of Palms | 0.41% | 0.16%(+0.251)#38 | 0.30%(+0.110)#3,842 |
| 39. | Oak Grove | 0.38% | 0.16%(+0.214)#39 | 0.30%(+0.074)#4,126 |
| 40. | Woodruff | 0.38% | 0.16%(+0.212)#40 | 0.30%(+0.072)#4,143 |
| 41. | St Andrews | 0.36% | 0.16%(+0.197)#41 | 0.30%(+0.057)#4,266 |
| 42. | Mount Pleasant | 0.35% | 0.16%(+0.184)#42 | 0.30%(+0.044)#4,376 |
| 43. | Sullivan S Island | 0.35% | 0.16%(+0.182)#43 | 0.30%(+0.042)#4,394 |
| 44. | Forestbrook | 0.34% | 0.16%(+0.174)#44 | 0.30%(+0.033)#4,471 |
| 45. | Taylors | 0.33% | 0.16%(+0.167)#45 | 0.30%(+0.027)#4,558 |
| 46. | Irmo | 0.32% | 0.16%(+0.153)#46 | 0.30%(+0.013)#4,674 |
| 47. | Charleston | 0.31% | 0.16%(+0.144)#47 | 0.30%(+0.004)#4,760 |
| 48. | Wellford | 0.30% | 0.16%(+0.137)#48 | 0.30%(-0.003)#4,837 |
| 49. | Sangaree | 0.30% | 0.16%(+0.136)#49 | 0.30%(-0.004)#4,851 |
| 50. | Pelion | 0.28% | 0.16%(+0.121)#50 | 0.30%(-0.020)#5,012 |
| 51. | Seven Oaks | 0.28% | 0.16%(+0.115)#51 | 0.30%(-0.026)#5,110 |
| 52. | Ben Avon | 0.28% | 0.16%(+0.114)#52 | 0.30%(-0.026)#5,114 |
| 53. | Forest Acres | 0.28% | 0.16%(+0.112)#53 | 0.30%(-0.028)#5,136 |
| 54. | Bluffton | 0.28% | 0.16%(+0.112)#54 | 0.30%(-0.028)#5,138 |
| 55. | Port Royal | 0.27% | 0.16%(+0.104)#55 | 0.30%(-0.036)#5,258 |
| 56. | Marion | 0.27% | 0.16%(+0.102)#56 | 0.30%(-0.038)#5,279 |
| 57. | Greer | 0.26% | 0.16%(+0.101)#57 | 0.30%(-0.039)#5,291 |
| 58. | Summerville | 0.26% | 0.16%(+0.098)#58 | 0.30%(-0.042)#5,333 |
| 59. | Litchfield Beach | 0.26% | 0.16%(+0.095)#59 | 0.30%(-0.046)#5,385 |
| 60. | Fort Mill | 0.26% | 0.16%(+0.094)#60 | 0.30%(-0.046)#5,395 |
| 61. | Gray Court | 0.26% | 0.16%(+0.094)#61 | 0.30%(-0.047)#5,403 |
| 62. | Goose Creek | 0.26% | 0.16%(+0.092)#62 | 0.30%(-0.049)#5,421 |
| 63. | Myrtle Beach | 0.25% | 0.16%(+0.089)#63 | 0.30%(-0.051)#5,454 |
| 64. | Clover | 0.25% | 0.16%(+0.087)#64 | 0.30%(-0.054)#5,474 |
| 65. | Kiawah Island | 0.23% | 0.16%(+0.071)#65 | 0.30%(-0.069)#5,642 |
| 66. | Red Bank | 0.22% | 0.16%(+0.055)#66 | 0.30%(-0.086)#5,831 |
| 67. | Hilltop | 0.22% | 0.16%(+0.052)#67 | 0.30%(-0.089)#5,867 |
| 68. | Columbia | 0.21% | 0.16%(+0.046)#68 | 0.30%(-0.095)#5,954 |
| 69. | Southern Shops | 0.21% | 0.16%(+0.044)#69 | 0.30%(-0.096)#5,980 |
| 70. | Spartanburg | 0.19% | 0.16%(+0.025)#70 | 0.30%(-0.116)#6,243 |
| 71. | Fountain Inn | 0.19% | 0.16%(+0.024)#71 | 0.30%(-0.116)#6,253 |
| 72. | Simpsonville | 0.19% | 0.16%(+0.023)#72 | 0.30%(-0.117)#6,265 |
| 73. | White Knoll | 0.18% | 0.16%(+0.018)#73 | 0.30%(-0.123)#6,336 |
| 74. | Bishopville | 0.17% | 0.16%(+0.004)#74 | 0.30%(-0.136)#6,517 |
| 75. | Socastee | 0.16% | 0.16%(+0.000)#75 | 0.30%(-0.140)#6,578 |
| 76. | Jackson | 0.16% | 0.16%(-0.004)#76 | 0.30%(-0.144)#6,645 |
| 77. | North Augusta | 0.15% | 0.16%(-0.016)#77 | 0.30%(-0.156)#6,820 |
| 78. | Laurel Bay | 0.15% | 0.16%(-0.018)#78 | 0.30%(-0.159)#6,860 |
| 79. | Wyboo | 0.13% | 0.16%(-0.031)#79 | 0.30%(-0.172)#7,038 |
| 80. | Cayce | 0.12% | 0.16%(-0.040)#80 | 0.30%(-0.180)#7,147 |
| 81. | Conway | 0.12% | 0.16%(-0.040)#81 | 0.30%(-0.180)#7,153 |
| 82. | Rock Hill | 0.12% | 0.16%(-0.046)#82 | 0.30%(-0.186)#7,231 |
| 83. | Darlington | 0.11% | 0.16%(-0.050)#83 | 0.30%(-0.190)#7,281 |
| 84. | North Myrtle Beach | 0.11% | 0.16%(-0.052)#84 | 0.30%(-0.192)#7,314 |
| 85. | Gantt | 0.11% | 0.16%(-0.058)#85 | 0.30%(-0.199)#7,385 |
| 86. | Berea | 0.11% | 0.16%(-0.058)#86 | 0.30%(-0.199)#7,387 |
| 87. | Aiken | 0.100% | 0.16%(-0.063)#87 | 0.30%(-0.204)#7,455 |
| 88. | Mauldin | 0.095% | 0.16%(-0.068)#88 | 0.30%(-0.209)#7,507 |
| 89. | West Columbia | 0.080% | 0.16%(-0.083)#89 | 0.30%(-0.224)#7,719 |
| 90. | Anderson | 0.075% | 0.16%(-0.088)#90 | 0.30%(-0.229)#7,789 |
| 91. | Clemson | 0.074% | 0.16%(-0.089)#91 | 0.30%(-0.230)#7,805 |
| 92. | York | 0.070% | 0.16%(-0.093)#92 | 0.30%(-0.233)#7,856 |
| 93. | Hanahan | 0.063% | 0.16%(-0.101)#93 | 0.30%(-0.241)#7,941 |
| 94. | Reidville | 0.058% | 0.16%(-0.106)#94 | 0.30%(-0.246)#7,990 |
| 95. | Tega Cay | 0.055% | 0.16%(-0.109)#95 | 0.30%(-0.249)#8,029 |
| 96. | North Charleston | 0.041% | 0.16%(-0.122)#96 | 0.30%(-0.262)#8,179 |
| 97. | Greenwood | 0.036% | 0.16%(-0.128)#97 | 0.30%(-0.268)#8,233 |
| 98. | Lexington | 0.034% | 0.16%(-0.130)#98 | 0.30%(-0.270)#8,246 |
| 99. | Dentsville | 0.030% | 0.16%(-0.133)#99 | 0.30%(-0.273)#8,279 |
Common Questions
What are the Top 10 Cities with the Highest Percentage of Eastern European Population in South Carolina?
Top 10 Cities with the Highest Percentage of Eastern European Population in South Carolina are:
#1
2.28%
#2
2.16%
#3
1.89%
#4
1.56%
#5
1.44%
#6
1.24%
#7
1.23%
#8
1.21%
#9
1.17%
#10
1.16%
What city has the Highest Percentage of Eastern European Population in South Carolina?
Seabrook Island has the Highest Percentage of Eastern European Population in South Carolina with 2.28%.
What is the Percentage of Eastern European Population in the State of South Carolina?
Percentage of Eastern European Population in South Carolina is 0.16%.
What is the Percentage of Eastern European Population in the United States?
Percentage of Eastern European Population in the United States is 0.30%.