Cities with the Highest Percentage of Eastern European Population in Kentucky
RELATED REPORTS & OPTIONS
Eastern European
Kentucky
Compare Cities
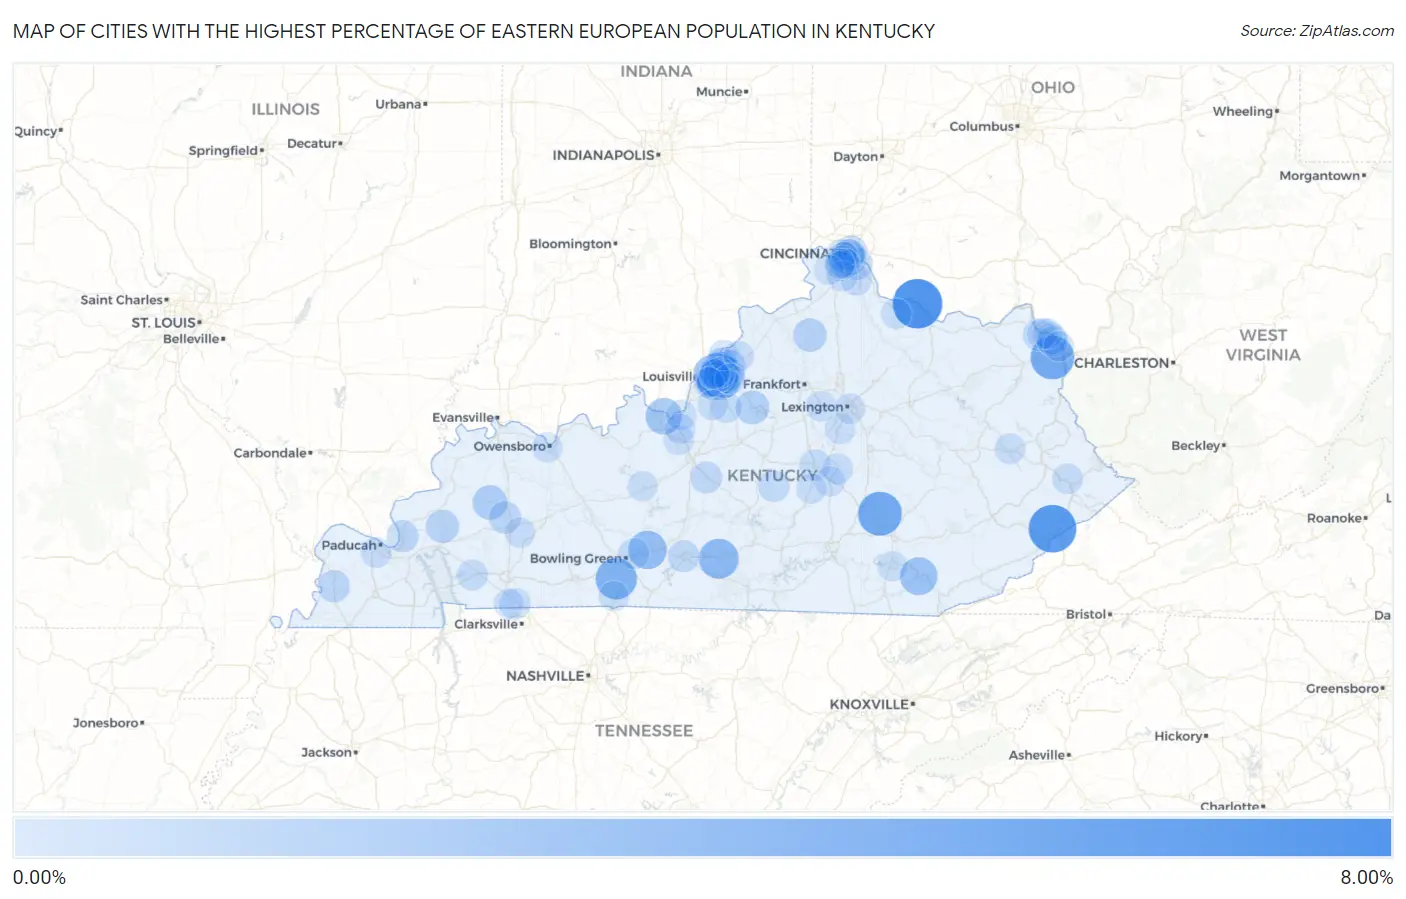
Map of Cities with the Highest Percentage of Eastern European Population in Kentucky
0.00%
8.00%
Cities with the Highest Percentage of Eastern European Population in Kentucky
| City | Eastern European | vs State | vs National | |
| 1. | Dover | 6.29% | 0.12%(+6.17)#1 | 0.30%(+5.99)#95 |
| 2. | Fleming Neon | 5.68% | 0.12%(+5.56)#2 | 0.30%(+5.38)#113 |
| 3. | Livingston | 4.43% | 0.12%(+4.31)#3 | 0.30%(+4.13)#202 |
| 4. | Cannonsburg | 4.36% | 0.12%(+4.24)#4 | 0.30%(+4.06)#209 |
| 5. | Woodburn | 3.59% | 0.12%(+3.47)#5 | 0.30%(+3.29)#287 |
| 6. | Edmonton | 3.11% | 0.12%(+2.99)#6 | 0.30%(+2.80)#355 |
| 7. | Oakland | 2.69% | 0.12%(+2.57)#7 | 0.30%(+2.39)#438 |
| 8. | Mockingbird Valley | 2.48% | 0.12%(+2.36)#8 | 0.30%(+2.18)#485 |
| 9. | Brownsboro Village | 2.45% | 0.12%(+2.33)#9 | 0.30%(+2.15)#502 |
| 10. | Barbourville | 2.41% | 0.12%(+2.29)#10 | 0.30%(+2.11)#514 |
| 11. | Old Brownsboro Place | 2.34% | 0.12%(+2.22)#11 | 0.30%(+2.04)#541 |
| 12. | Doe Valley | 2.03% | 0.12%(+1.91)#12 | 0.30%(+1.73)#689 |
| 13. | Wellington | 1.58% | 0.12%(+1.46)#13 | 0.30%(+1.28)#949 |
| 14. | Nebo | 1.48% | 0.12%(+1.36)#14 | 0.30%(+1.17)#1,040 |
| 15. | Houston Acres | 1.46% | 0.12%(+1.34)#15 | 0.30%(+1.16)#1,051 |
| 16. | Taylorsville | 1.22% | 0.12%(+1.10)#16 | 0.30%(+0.919)#1,324 |
| 17. | Owenton | 1.10% | 0.12%(+0.975)#17 | 0.30%(+0.794)#1,512 |
| 18. | Fredonia | 1.05% | 0.12%(+0.930)#18 | 0.30%(+0.749)#1,587 |
| 19. | Barbourmeade | 0.99% | 0.12%(+0.867)#19 | 0.30%(+0.686)#1,703 |
| 20. | Seneca Gardens | 0.88% | 0.12%(+0.755)#20 | 0.30%(+0.573)#1,948 |
| 21. | Southgate | 0.87% | 0.12%(+0.748)#21 | 0.30%(+0.567)#1,971 |
| 22. | Crestview | 0.82% | 0.12%(+0.697)#22 | 0.30%(+0.516)#2,122 |
| 23. | Northfield | 0.81% | 0.12%(+0.691)#23 | 0.30%(+0.510)#2,138 |
| 24. | Strathmoor Village | 0.76% | 0.12%(+0.639)#24 | 0.30%(+0.458)#2,299 |
| 25. | Arlington | 0.75% | 0.12%(+0.629)#25 | 0.30%(+0.448)#2,332 |
| 26. | Earlington | 0.74% | 0.12%(+0.616)#26 | 0.30%(+0.435)#2,374 |
| 27. | Smithland | 0.73% | 0.12%(+0.607)#27 | 0.30%(+0.426)#2,402 |
| 28. | Orchard Grass Hills | 0.72% | 0.12%(+0.600)#28 | 0.30%(+0.419)#2,425 |
| 29. | Anchorage | 0.70% | 0.12%(+0.580)#29 | 0.30%(+0.399)#2,485 |
| 30. | Green Spring | 0.69% | 0.12%(+0.568)#30 | 0.30%(+0.387)#2,527 |
| 31. | Forest Hills | 0.68% | 0.12%(+0.559)#31 | 0.30%(+0.378)#2,557 |
| 32. | Meadowview Estates | 0.67% | 0.12%(+0.548)#32 | 0.30%(+0.367)#2,592 |
| 33. | Greenup | 0.66% | 0.12%(+0.533)#33 | 0.30%(+0.352)#2,651 |
| 34. | Hodgenville | 0.62% | 0.12%(+0.494)#34 | 0.30%(+0.313)#2,812 |
| 35. | Glasgow | 0.60% | 0.12%(+0.482)#35 | 0.30%(+0.301)#2,859 |
| 36. | Indian Hills | 0.59% | 0.12%(+0.465)#36 | 0.30%(+0.284)#2,922 |
| 37. | Spring Valley | 0.58% | 0.12%(+0.459)#37 | 0.30%(+0.278)#2,954 |
| 38. | Dayton | 0.58% | 0.12%(+0.459)#38 | 0.30%(+0.278)#2,956 |
| 39. | Prospect | 0.56% | 0.12%(+0.440)#39 | 0.30%(+0.259)#3,031 |
| 40. | Woodlawn | 0.56% | 0.12%(+0.436)#40 | 0.30%(+0.255)#3,051 |
| 41. | Bradfordsville | 0.56% | 0.12%(+0.434)#41 | 0.30%(+0.253)#3,062 |
| 42. | Creekside | 0.55% | 0.12%(+0.427)#42 | 0.30%(+0.246)#3,097 |
| 43. | Glenview | 0.52% | 0.12%(+0.400)#43 | 0.30%(+0.219)#3,239 |
| 44. | Russell | 0.49% | 0.12%(+0.363)#44 | 0.30%(+0.182)#3,421 |
| 45. | Newport | 0.47% | 0.12%(+0.350)#45 | 0.30%(+0.168)#3,510 |
| 46. | Blue Ridge Manor | 0.47% | 0.12%(+0.346)#46 | 0.30%(+0.165)#3,530 |
| 47. | Oak Grove | 0.46% | 0.12%(+0.333)#47 | 0.30%(+0.152)#3,602 |
| 48. | Danville | 0.45% | 0.12%(+0.325)#48 | 0.30%(+0.144)#3,639 |
| 49. | Plum Springs | 0.44% | 0.12%(+0.314)#49 | 0.30%(+0.133)#3,690 |
| 50. | Ludlow | 0.43% | 0.12%(+0.311)#50 | 0.30%(+0.130)#3,718 |
| 51. | Bellewood | 0.43% | 0.12%(+0.303)#51 | 0.30%(+0.122)#3,762 |
| 52. | Windy Hills | 0.41% | 0.12%(+0.288)#52 | 0.30%(+0.107)#3,868 |
| 53. | Fort Wright | 0.39% | 0.12%(+0.271)#53 | 0.30%(+0.090)#3,996 |
| 54. | Cadiz | 0.38% | 0.12%(+0.259)#54 | 0.30%(+0.078)#4,095 |
| 55. | Lyndon | 0.38% | 0.12%(+0.259)#55 | 0.30%(+0.078)#4,096 |
| 56. | Mount Washington | 0.37% | 0.12%(+0.250)#56 | 0.30%(+0.069)#4,178 |
| 57. | Park Hills | 0.35% | 0.12%(+0.226)#57 | 0.30%(+0.044)#4,368 |
| 58. | Hurstbourne | 0.34% | 0.12%(+0.221)#58 | 0.30%(+0.040)#4,407 |
| 59. | Claryville | 0.33% | 0.12%(+0.204)#59 | 0.30%(+0.023)#4,587 |
| 60. | St Matthews | 0.32% | 0.12%(+0.197)#60 | 0.30%(+0.016)#4,653 |
| 61. | Druid Hills | 0.32% | 0.12%(+0.193)#61 | 0.30%(+0.012)#4,690 |
| 62. | Lancaster | 0.30% | 0.12%(+0.182)#62 | 0.30%(+0.001)#4,793 |
| 63. | Jeffersontown | 0.28% | 0.12%(+0.155)#63 | 0.30%(-0.026)#5,111 |
| 64. | Salyersville | 0.27% | 0.12%(+0.143)#64 | 0.30%(-0.038)#5,275 |
| 65. | Wurtland | 0.26% | 0.12%(+0.142)#65 | 0.30%(-0.039)#5,293 |
| 66. | Coal Run Village | 0.26% | 0.12%(+0.141)#66 | 0.30%(-0.040)#5,309 |
| 67. | Brooksville | 0.26% | 0.12%(+0.139)#67 | 0.30%(-0.042)#5,331 |
| 68. | Hendron | 0.25% | 0.12%(+0.132)#68 | 0.30%(-0.049)#5,432 |
| 69. | Bellefonte | 0.25% | 0.12%(+0.124)#69 | 0.30%(-0.057)#5,512 |
| 70. | Beechwood Village | 0.23% | 0.12%(+0.108)#70 | 0.30%(-0.073)#5,693 |
| 71. | Nicholasville | 0.23% | 0.12%(+0.107)#71 | 0.30%(-0.074)#5,700 |
| 72. | Owensboro | 0.22% | 0.12%(+0.097)#72 | 0.30%(-0.084)#5,807 |
| 73. | Lexington | 0.21% | 0.12%(+0.092)#73 | 0.30%(-0.089)#5,878 |
| 74. | Strathmoor Manor | 0.21% | 0.12%(+0.083)#74 | 0.30%(-0.098)#6,004 |
| 75. | Bancroft | 0.20% | 0.12%(+0.078)#75 | 0.30%(-0.103)#6,055 |
| 76. | Riverwood | 0.20% | 0.12%(+0.077)#76 | 0.30%(-0.104)#6,067 |
| 77. | White Plains | 0.20% | 0.12%(+0.076)#77 | 0.30%(-0.106)#6,086 |
| 78. | Vine Grove | 0.20% | 0.12%(+0.074)#78 | 0.30%(-0.107)#6,108 |
| 79. | Versailles | 0.19% | 0.12%(+0.072)#79 | 0.30%(-0.110)#6,145 |
| 80. | Rolling Fields | 0.19% | 0.12%(+0.071)#80 | 0.30%(-0.110)#6,154 |
| 81. | Goshen | 0.19% | 0.12%(+0.070)#81 | 0.30%(-0.111)#6,169 |
| 82. | Buckner | 0.19% | 0.12%(+0.069)#82 | 0.30%(-0.112)#6,192 |
| 83. | West Point | 0.19% | 0.12%(+0.064)#83 | 0.30%(-0.117)#6,266 |
| 84. | Independence | 0.18% | 0.12%(+0.055)#84 | 0.30%(-0.126)#6,378 |
| 85. | Louisville | 0.18% | 0.12%(+0.055)#85 | 0.30%(-0.126)#6,380 |
| 86. | Worthington | 0.17% | 0.12%(+0.052)#86 | 0.30%(-0.130)#6,422 |
| 87. | Edgewood | 0.17% | 0.12%(+0.043)#87 | 0.30%(-0.138)#6,536 |
| 88. | Stanford | 0.16% | 0.12%(+0.042)#88 | 0.30%(-0.140)#6,565 |
| 89. | Hustonville | 0.16% | 0.12%(+0.041)#89 | 0.30%(-0.140)#6,580 |
| 90. | Fort Knox | 0.16% | 0.12%(+0.039)#90 | 0.30%(-0.142)#6,607 |
| 91. | Franklin | 0.16% | 0.12%(+0.035)#91 | 0.30%(-0.146)#6,662 |
| 92. | Leitchfield | 0.16% | 0.12%(+0.033)#92 | 0.30%(-0.148)#6,695 |
| 93. | Corbin | 0.15% | 0.12%(+0.028)#93 | 0.30%(-0.153)#6,757 |
| 94. | Pioneer Village | 0.15% | 0.12%(+0.026)#94 | 0.30%(-0.155)#6,796 |
| 95. | Ashland | 0.15% | 0.12%(+0.026)#95 | 0.30%(-0.155)#6,803 |
| 96. | Fort Campbell North | 0.13% | 0.12%(+0.011)#96 | 0.30%(-0.171)#7,018 |
| 97. | Covington | 0.12% | 0.12%(+0.002)#97 | 0.30%(-0.179)#7,137 |
| 98. | Middletown | 0.11% | 0.12%(-0.008)#98 | 0.30%(-0.189)#7,268 |
| 99. | Florence | 0.097% | 0.12%(-0.026)#99 | 0.30%(-0.207)#7,489 |
| 100. | Crestview Hills | 0.093% | 0.12%(-0.029)#100 | 0.30%(-0.210)#7,537 |
Common Questions
What are the Top 10 Cities with the Highest Percentage of Eastern European Population in Kentucky?
Top 10 Cities with the Highest Percentage of Eastern European Population in Kentucky are:
#1
6.29%
#2
5.68%
#3
4.43%
#4
4.36%
#5
3.59%
#6
3.11%
#7
2.69%
#8
2.48%
#9
2.45%
#10
2.41%
What city has the Highest Percentage of Eastern European Population in Kentucky?
Dover has the Highest Percentage of Eastern European Population in Kentucky with 6.29%.
What is the Percentage of Eastern European Population in the State of Kentucky?
Percentage of Eastern European Population in Kentucky is 0.12%.
What is the Percentage of Eastern European Population in the United States?
Percentage of Eastern European Population in the United States is 0.30%.