Cities with the Lowest Poverty Level Among Married Couples in Kentucky
RELATED REPORTS & OPTIONS
Lowest Poverty | Married Couple
Kentucky
Compare Cities
Map of Cities with the Lowest Poverty Level Among Married Couples in Kentucky
4.0%
0.0%
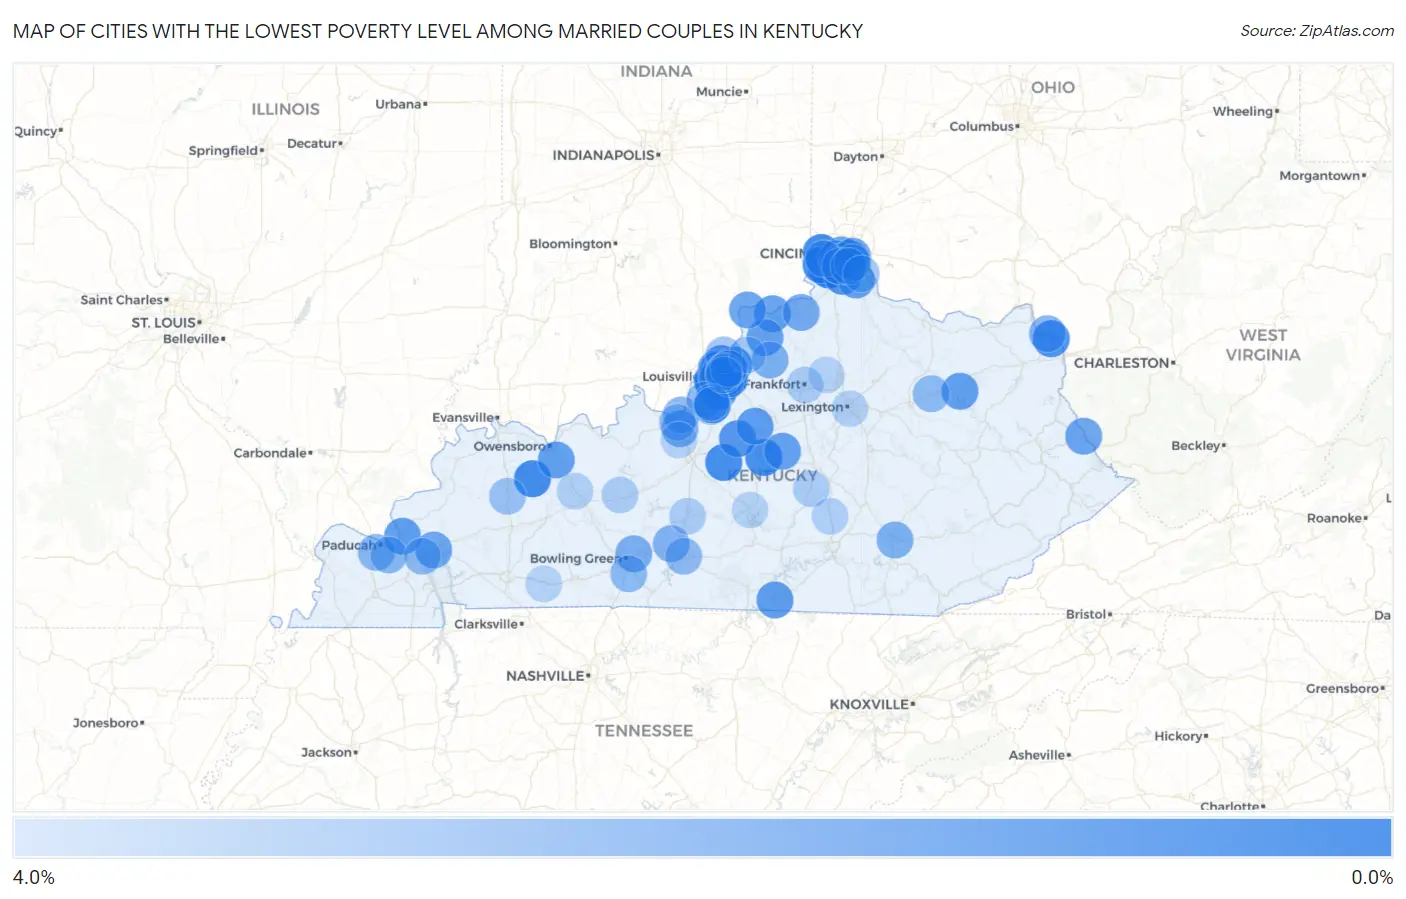
Cities with the Lowest Poverty Level Among Married Couples in Kentucky
| City | Married Couples Poverty | vs State | vs National | |
| 1. | Oakbrook | 0.39% | 6.0%(-5.65)#1 | 4.5%(-4.07)#133 |
| 2. | Elsmere | 0.62% | 6.0%(-5.42)#2 | 4.5%(-3.84)#406 |
| 3. | Calhoun | 0.69% | 6.0%(-5.35)#3 | 4.5%(-3.77)#509 |
| 4. | Florence | 0.70% | 6.0%(-5.35)#4 | 4.5%(-3.77)#520 |
| 5. | Francisville | 0.70% | 6.0%(-5.34)#5 | 4.5%(-3.76)#525 |
| 6. | New Haven | 0.71% | 6.0%(-5.33)#6 | 4.5%(-3.75)#555 |
| 7. | Springfield | 0.75% | 6.0%(-5.29)#7 | 4.5%(-3.71)#617 |
| 8. | Norbourne Estates | 0.76% | 6.0%(-5.28)#8 | 4.5%(-3.70)#656 |
| 9. | Douglass Hills | 0.79% | 6.0%(-5.25)#9 | 4.5%(-3.67)#724 |
| 10. | Burlington | 0.80% | 6.0%(-5.25)#10 | 4.5%(-3.67)#747 |
| 11. | Forest Hills | 0.85% | 6.0%(-5.19)#11 | 4.5%(-3.61)#865 |
| 12. | Independence | 0.94% | 6.0%(-5.10)#12 | 4.5%(-3.52)#1,047 |
| 13. | Russell | 0.94% | 6.0%(-5.10)#13 | 4.5%(-3.52)#1,062 |
| 14. | Crestwood | 0.95% | 6.0%(-5.09)#14 | 4.5%(-3.51)#1,071 |
| 15. | Prospect | 0.98% | 6.0%(-5.06)#15 | 4.5%(-3.48)#1,170 |
| 16. | Langdon Place | 1.0% | 6.0%(-5.04)#16 | 4.5%(-3.46)#1,206 |
| 17. | Beechwood Village | 1.0% | 6.0%(-5.04)#17 | 4.5%(-3.46)#1,222 |
| 18. | West Van Lear | 1.0% | 6.0%(-5.01)#18 | 4.5%(-3.43)#1,281 |
| 19. | Southgate | 1.1% | 6.0%(-4.96)#19 | 4.5%(-3.38)#1,392 |
| 20. | Green Spring | 1.1% | 6.0%(-4.94)#20 | 4.5%(-3.36)#1,426 |
| 21. | Kingsley | 1.1% | 6.0%(-4.94)#21 | 4.5%(-3.36)#1,431 |
| 22. | Glenview | 1.1% | 6.0%(-4.93)#22 | 4.5%(-3.35)#1,452 |
| 23. | Bardstown | 1.2% | 6.0%(-4.88)#23 | 4.5%(-3.30)#1,574 |
| 24. | Anchorage | 1.2% | 6.0%(-4.88)#24 | 4.5%(-3.30)#1,583 |
| 25. | Richlawn | 1.2% | 6.0%(-4.88)#25 | 4.5%(-3.30)#1,596 |
| 26. | Manor Creek | 1.2% | 6.0%(-4.81)#26 | 4.5%(-3.23)#1,770 |
| 27. | Meadow Vale | 1.3% | 6.0%(-4.72)#27 | 4.5%(-3.14)#1,991 |
| 28. | Seneca Gardens | 1.4% | 6.0%(-4.67)#28 | 4.5%(-3.09)#2,124 |
| 29. | Bloomfield | 1.4% | 6.0%(-4.64)#29 | 4.5%(-3.06)#2,214 |
| 30. | Albany | 1.4% | 6.0%(-4.62)#30 | 4.5%(-3.04)#2,266 |
| 31. | Bancroft | 1.4% | 6.0%(-4.59)#31 | 4.5%(-3.01)#2,342 |
| 32. | Smithland | 1.4% | 6.0%(-4.59)#32 | 4.5%(-3.01)#2,348 |
| 33. | Jeffersontown | 1.4% | 6.0%(-4.59)#33 | 4.5%(-3.01)#2,350 |
| 34. | Strathmoor Village | 1.5% | 6.0%(-4.57)#34 | 4.5%(-2.99)#2,401 |
| 35. | Carrollton | 1.5% | 6.0%(-4.54)#35 | 4.5%(-2.96)#2,470 |
| 36. | Lakeview Heights | 1.5% | 6.0%(-4.53)#36 | 4.5%(-2.95)#2,524 |
| 37. | Masonville | 1.5% | 6.0%(-4.52)#37 | 4.5%(-2.94)#2,546 |
| 38. | Claryville | 1.6% | 6.0%(-4.49)#38 | 4.5%(-2.91)#2,620 |
| 39. | Mackville | 1.6% | 6.0%(-4.48)#39 | 4.5%(-2.90)#2,640 |
| 40. | Ludlow | 1.6% | 6.0%(-4.47)#40 | 4.5%(-2.89)#2,660 |
| 41. | Villa Hills | 1.6% | 6.0%(-4.44)#41 | 4.5%(-2.87)#2,750 |
| 42. | Campbellsburg | 1.6% | 6.0%(-4.41)#42 | 4.5%(-2.83)#2,835 |
| 43. | Hollow Creek | 1.6% | 6.0%(-4.40)#43 | 4.5%(-2.82)#2,860 |
| 44. | Milton | 1.7% | 6.0%(-4.35)#44 | 4.5%(-2.77)#2,999 |
| 45. | Warfield | 1.8% | 6.0%(-4.29)#45 | 4.5%(-2.71)#3,155 |
| 46. | Fort Wright | 1.8% | 6.0%(-4.27)#46 | 4.5%(-2.69)#3,179 |
| 47. | Erlanger | 1.8% | 6.0%(-4.26)#47 | 4.5%(-2.68)#3,226 |
| 48. | Kuttawa | 1.8% | 6.0%(-4.26)#48 | 4.5%(-2.68)#3,236 |
| 49. | Fort Thomas | 1.8% | 6.0%(-4.23)#49 | 4.5%(-2.65)#3,296 |
| 50. | Maryhill Estates | 1.9% | 6.0%(-4.19)#50 | 4.5%(-2.61)#3,405 |
| 51. | Blue Ridge Manor | 2.0% | 6.0%(-4.08)#51 | 4.5%(-2.50)#3,654 |
| 52. | Sparta | 2.0% | 6.0%(-4.08)#52 | 4.5%(-2.50)#3,664 |
| 53. | Orchard Grass Hills | 2.0% | 6.0%(-4.07)#53 | 4.5%(-2.49)#3,702 |
| 54. | Graymoor Devondale | 2.0% | 6.0%(-4.07)#54 | 4.5%(-2.49)#3,704 |
| 55. | Hebron | 2.0% | 6.0%(-4.05)#55 | 4.5%(-2.47)#3,736 |
| 56. | Coldstream | 2.1% | 6.0%(-3.96)#56 | 4.5%(-2.38)#3,974 |
| 57. | Glenview Hills | 2.1% | 6.0%(-3.94)#57 | 4.5%(-2.36)#4,042 |
| 58. | Fort Knox | 2.1% | 6.0%(-3.92)#58 | 4.5%(-2.34)#4,095 |
| 59. | Plum Springs | 2.2% | 6.0%(-3.89)#59 | 4.5%(-2.31)#4,173 |
| 60. | Edgewood | 2.2% | 6.0%(-3.86)#60 | 4.5%(-2.28)#4,243 |
| 61. | Eminence | 2.2% | 6.0%(-3.86)#61 | 4.5%(-2.28)#4,246 |
| 62. | Fox Chase | 2.2% | 6.0%(-3.82)#62 | 4.5%(-2.24)#4,342 |
| 63. | London | 2.3% | 6.0%(-3.77)#63 | 4.5%(-2.19)#4,457 |
| 64. | Worthington | 2.3% | 6.0%(-3.76)#64 | 4.5%(-2.18)#4,509 |
| 65. | St Matthews | 2.3% | 6.0%(-3.76)#65 | 4.5%(-2.18)#4,511 |
| 66. | Park City | 2.4% | 6.0%(-3.68)#66 | 4.5%(-2.10)#4,711 |
| 67. | Highland Heights | 2.4% | 6.0%(-3.67)#67 | 4.5%(-2.09)#4,729 |
| 68. | West Point | 2.5% | 6.0%(-3.53)#68 | 4.5%(-1.95)#5,107 |
| 69. | Hendron | 2.5% | 6.0%(-3.50)#69 | 4.5%(-1.92)#5,166 |
| 70. | Reidland | 2.6% | 6.0%(-3.49)#70 | 4.5%(-1.91)#5,202 |
| 71. | Taylor Mill | 2.6% | 6.0%(-3.48)#71 | 4.5%(-1.90)#5,209 |
| 72. | Plano | 2.6% | 6.0%(-3.43)#72 | 4.5%(-1.85)#5,364 |
| 73. | Owingsville | 2.6% | 6.0%(-3.41)#73 | 4.5%(-1.83)#5,397 |
| 74. | Grand Rivers | 2.6% | 6.0%(-3.41)#74 | 4.5%(-1.83)#5,409 |
| 75. | Glasgow | 2.7% | 6.0%(-3.38)#75 | 4.5%(-1.80)#5,473 |
| 76. | Hollyvilla | 2.8% | 6.0%(-3.22)#76 | 4.5%(-1.65)#5,843 |
| 77. | Pioneer Village | 2.8% | 6.0%(-3.22)#77 | 4.5%(-1.64)#5,855 |
| 78. | Hillview | 2.9% | 6.0%(-3.17)#78 | 4.5%(-1.59)#5,973 |
| 79. | Muldraugh | 2.9% | 6.0%(-3.13)#79 | 4.5%(-1.55)#6,052 |
| 80. | Middletown | 3.0% | 6.0%(-3.08)#80 | 4.5%(-1.50)#6,195 |
| 81. | Goshen | 3.0% | 6.0%(-3.06)#81 | 4.5%(-1.48)#6,220 |
| 82. | Hanson | 3.0% | 6.0%(-3.06)#82 | 4.5%(-1.48)#6,221 |
| 83. | Alexandria | 3.0% | 6.0%(-3.03)#83 | 4.5%(-1.45)#6,289 |
| 84. | Creekside | 3.1% | 6.0%(-2.98)#84 | 4.5%(-1.40)#6,415 |
| 85. | Westwood | 3.2% | 6.0%(-2.82)#85 | 4.5%(-1.24)#6,774 |
| 86. | La Grange | 3.3% | 6.0%(-2.71)#86 | 4.5%(-1.13)#7,039 |
| 87. | Munfordville | 3.4% | 6.0%(-2.59)#87 | 4.5%(-1.01)#7,254 |
| 88. | Hustonville | 3.4% | 6.0%(-2.59)#88 | 4.5%(-1.01)#7,263 |
| 89. | Frankfort | 3.5% | 6.0%(-2.58)#89 | 4.5%(-1.00)#7,318 |
| 90. | Caneyville | 3.5% | 6.0%(-2.55)#90 | 4.5%(-0.974)#7,369 |
| 91. | Fincastle | 3.5% | 6.0%(-2.50)#91 | 4.5%(-0.922)#7,482 |
| 92. | Hartford | 3.6% | 6.0%(-2.45)#92 | 4.5%(-0.870)#7,605 |
| 93. | Eubank | 3.6% | 6.0%(-2.43)#93 | 4.5%(-0.847)#7,648 |
| 94. | Lexington | 3.6% | 6.0%(-2.40)#94 | 4.5%(-0.824)#7,698 |
| 95. | Stamping Ground | 3.7% | 6.0%(-2.36)#95 | 4.5%(-0.781)#7,779 |
| 96. | Campbellsville | 3.7% | 6.0%(-2.35)#96 | 4.5%(-0.770)#7,797 |
| 97. | Hunters Hollow | 3.7% | 6.0%(-2.34)#97 | 4.5%(-0.758)#7,830 |
| 98. | Elkton | 3.7% | 6.0%(-2.32)#98 | 4.5%(-0.741)#7,860 |
| 99. | Vine Grove | 3.7% | 6.0%(-2.31)#99 | 4.5%(-0.729)#7,883 |
| 100. | Lyndon | 3.8% | 6.0%(-2.29)#100 | 4.5%(-0.705)#7,931 |
Common Questions
What are the Top 10 Cities with the Lowest Poverty Level Among Married Couples in Kentucky?
Top 10 Cities with the Lowest Poverty Level Among Married Couples in Kentucky are:
#1
0.39%
#2
0.62%
#3
0.69%
#4
0.70%
#5
0.70%
#6
0.71%
#7
0.75%
#8
0.76%
#9
0.79%
#10
0.80%
What city has the Lowest Poverty Level Among Married Couples in Kentucky?
Oakbrook has the Lowest Poverty Level Among Married Couples in Kentucky with 0.39%.
What is the Poverty Level Among Married Couples in the State of Kentucky?
Poverty Level Among Married Couples in Kentucky is 6.0%.
What is the Poverty Level Among Married Couples in the United States?
Poverty Level Among Married Couples in the United States is 4.5%.