Cities with the Lowest Poverty Level Among Married Couples in Maryland
RELATED REPORTS & OPTIONS
Lowest Poverty | Married Couple
Maryland
Compare Cities
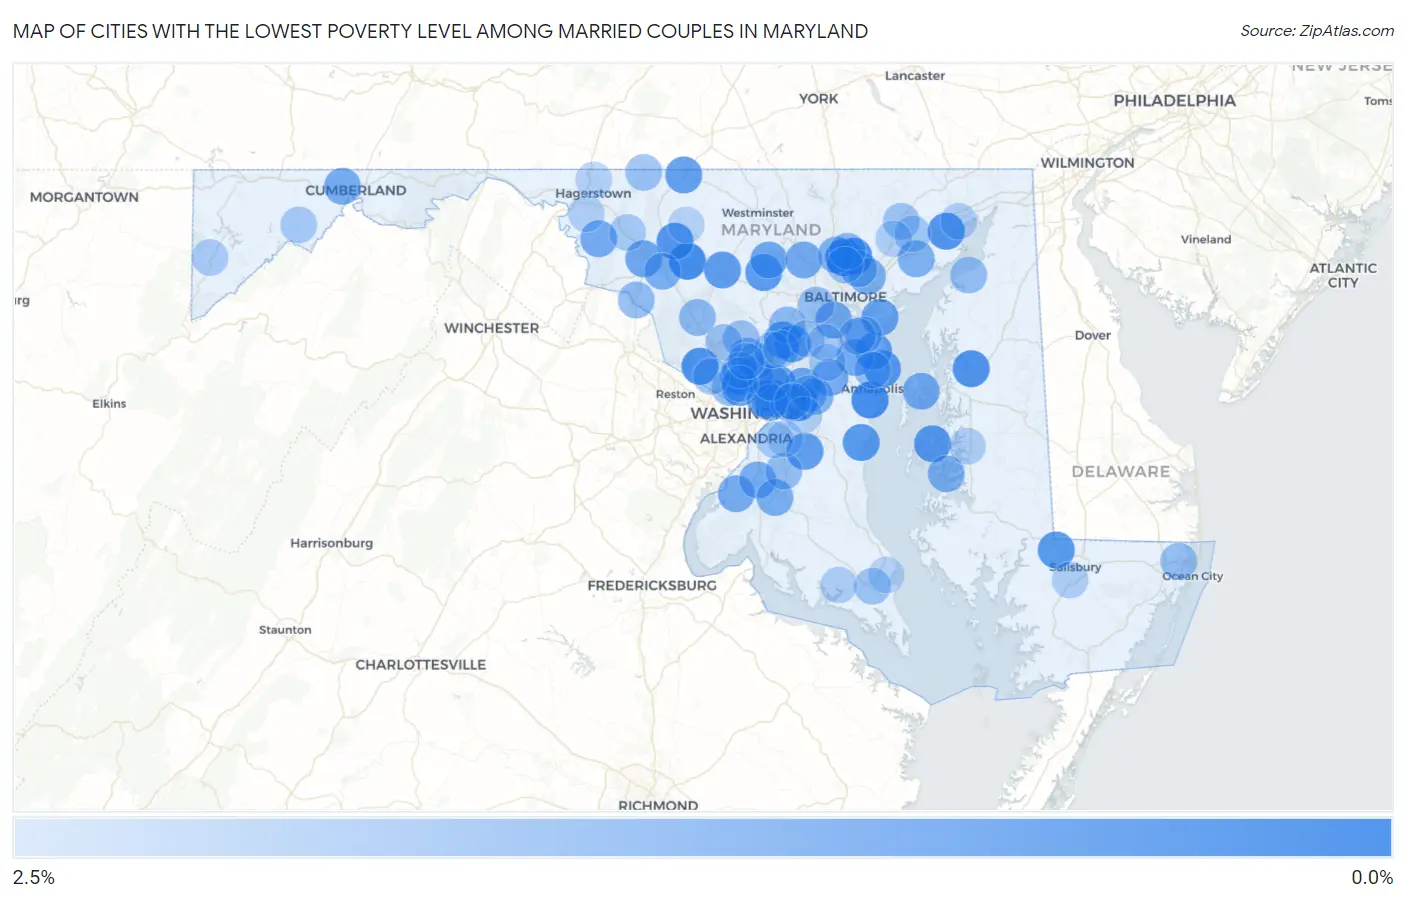
Map of Cities with the Lowest Poverty Level Among Married Couples in Maryland
2.5%
0.0%
Cities with the Lowest Poverty Level Among Married Couples in Maryland
| City | Married Couples Poverty | vs State | vs National | |
| 1. | Lutherville | 0.13% | 3.0%(-2.90)#1 | 4.5%(-4.33)#14 |
| 2. | Green Valley | 0.31% | 3.0%(-2.71)#2 | 4.5%(-4.15)#78 |
| 3. | Linganore | 0.34% | 3.0%(-2.69)#3 | 4.5%(-4.12)#92 |
| 4. | Annapolis Neck | 0.36% | 3.0%(-2.67)#4 | 4.5%(-4.11)#107 |
| 5. | Travilah | 0.44% | 3.0%(-2.59)#5 | 4.5%(-4.02)#185 |
| 6. | South Kensington | 0.45% | 3.0%(-2.57)#6 | 4.5%(-4.01)#196 |
| 7. | Hampton | 0.47% | 3.0%(-2.56)#7 | 4.5%(-4.00)#210 |
| 8. | Centreville | 0.48% | 3.0%(-2.55)#8 | 4.5%(-3.98)#221 |
| 9. | Mitchellville | 0.51% | 3.0%(-2.52)#9 | 4.5%(-3.95)#253 |
| 10. | Aberdeen | 0.52% | 3.0%(-2.51)#10 | 4.5%(-3.95)#263 |
| 11. | Walkersville | 0.59% | 3.0%(-2.44)#11 | 4.5%(-3.87)#359 |
| 12. | St Michaels | 0.60% | 3.0%(-2.42)#12 | 4.5%(-3.86)#383 |
| 13. | Cape St Claire | 0.63% | 3.0%(-2.40)#13 | 4.5%(-3.83)#422 |
| 14. | Hebron | 0.64% | 3.0%(-2.39)#14 | 4.5%(-3.82)#426 |
| 15. | Bladensburg | 0.66% | 3.0%(-2.37)#15 | 4.5%(-3.80)#456 |
| 16. | Deale | 0.66% | 3.0%(-2.37)#16 | 4.5%(-3.80)#467 |
| 17. | Berwyn Heights | 0.69% | 3.0%(-2.34)#17 | 4.5%(-3.77)#507 |
| 18. | Scaggsville | 0.69% | 3.0%(-2.33)#18 | 4.5%(-3.77)#516 |
| 19. | Sykesville | 0.70% | 3.0%(-2.33)#19 | 4.5%(-3.76)#523 |
| 20. | Mount Airy | 0.74% | 3.0%(-2.29)#20 | 4.5%(-3.72)#595 |
| 21. | Chevy Chase Section Three | 0.76% | 3.0%(-2.27)#21 | 4.5%(-3.70)#646 |
| 22. | North Laurel | 0.77% | 3.0%(-2.26)#22 | 4.5%(-3.69)#666 |
| 23. | Marlton | 0.78% | 3.0%(-2.25)#23 | 4.5%(-3.68)#696 |
| 24. | Emmitsburg | 0.80% | 3.0%(-2.23)#24 | 4.5%(-3.66)#760 |
| 25. | Lake Shore | 0.82% | 3.0%(-2.21)#25 | 4.5%(-3.65)#789 |
| 26. | Edgemere | 0.87% | 3.0%(-2.16)#26 | 4.5%(-3.60)#899 |
| 27. | Mount Rainier | 0.91% | 3.0%(-2.12)#27 | 4.5%(-3.55)#976 |
| 28. | Eldersburg | 0.97% | 3.0%(-2.06)#28 | 4.5%(-3.49)#1,128 |
| 29. | Braddock Heights | 0.97% | 3.0%(-2.06)#29 | 4.5%(-3.49)#1,130 |
| 30. | Linthicum | 0.98% | 3.0%(-2.05)#30 | 4.5%(-3.48)#1,163 |
| 31. | Glenn Dale | 1.0% | 3.0%(-2.03)#31 | 4.5%(-3.46)#1,214 |
| 32. | Severna Park | 1.0% | 3.0%(-1.99)#32 | 4.5%(-3.43)#1,290 |
| 33. | Owings Mills | 1.0% | 3.0%(-1.99)#33 | 4.5%(-3.42)#1,311 |
| 34. | Chester | 1.1% | 3.0%(-1.96)#34 | 4.5%(-3.39)#1,373 |
| 35. | Keedysville | 1.1% | 3.0%(-1.95)#35 | 4.5%(-3.38)#1,394 |
| 36. | Bryans Road | 1.1% | 3.0%(-1.92)#36 | 4.5%(-3.35)#1,445 |
| 37. | Crofton | 1.1% | 3.0%(-1.92)#37 | 4.5%(-3.35)#1,447 |
| 38. | Accokeek | 1.1% | 3.0%(-1.89)#38 | 4.5%(-3.33)#1,519 |
| 39. | La Vale | 1.1% | 3.0%(-1.88)#39 | 4.5%(-3.32)#1,540 |
| 40. | Four Corners | 1.1% | 3.0%(-1.88)#40 | 4.5%(-3.31)#1,553 |
| 41. | Ballenger Creek | 1.2% | 3.0%(-1.85)#41 | 4.5%(-3.28)#1,626 |
| 42. | Waldorf | 1.2% | 3.0%(-1.85)#42 | 4.5%(-3.28)#1,634 |
| 43. | Overlea | 1.2% | 3.0%(-1.84)#43 | 4.5%(-3.27)#1,665 |
| 44. | Oxford | 1.2% | 3.0%(-1.83)#44 | 4.5%(-3.27)#1,675 |
| 45. | Honeygo | 1.2% | 3.0%(-1.80)#45 | 4.5%(-3.23)#1,748 |
| 46. | Edgewood | 1.2% | 3.0%(-1.80)#46 | 4.5%(-3.23)#1,757 |
| 47. | Bowie | 1.3% | 3.0%(-1.77)#47 | 4.5%(-3.20)#1,806 |
| 48. | Parkville | 1.3% | 3.0%(-1.77)#48 | 4.5%(-3.20)#1,812 |
| 49. | Glenarden | 1.3% | 3.0%(-1.76)#49 | 4.5%(-3.19)#1,853 |
| 50. | Burnt Mills | 1.3% | 3.0%(-1.72)#50 | 4.5%(-3.15)#1,965 |
| 51. | Layhill | 1.3% | 3.0%(-1.72)#51 | 4.5%(-3.15)#1,967 |
| 52. | Mays Chapel | 1.3% | 3.0%(-1.72)#52 | 4.5%(-3.15)#1,969 |
| 53. | Fairwood | 1.4% | 3.0%(-1.67)#53 | 4.5%(-3.10)#2,099 |
| 54. | Riviera Beach | 1.4% | 3.0%(-1.61)#54 | 4.5%(-3.04)#2,249 |
| 55. | Columbia | 1.4% | 3.0%(-1.61)#55 | 4.5%(-3.04)#2,252 |
| 56. | Timonium | 1.4% | 3.0%(-1.59)#56 | 4.5%(-3.03)#2,299 |
| 57. | Colesville | 1.4% | 3.0%(-1.58)#57 | 4.5%(-3.02)#2,325 |
| 58. | Clarksburg | 1.4% | 3.0%(-1.58)#58 | 4.5%(-3.01)#2,332 |
| 59. | Colmar Manor | 1.5% | 3.0%(-1.56)#59 | 4.5%(-2.99)#2,396 |
| 60. | Pasadena | 1.5% | 3.0%(-1.53)#60 | 4.5%(-2.96)#2,481 |
| 61. | Point Of Rocks | 1.5% | 3.0%(-1.52)#61 | 4.5%(-2.95)#2,511 |
| 62. | Bethesda | 1.5% | 3.0%(-1.51)#62 | 4.5%(-2.95)#2,533 |
| 63. | Betterton | 1.5% | 3.0%(-1.49)#63 | 4.5%(-2.92)#2,580 |
| 64. | College Park | 1.5% | 3.0%(-1.49)#64 | 4.5%(-2.92)#2,586 |
| 65. | Arnold | 1.6% | 3.0%(-1.45)#65 | 4.5%(-2.89)#2,672 |
| 66. | Brandywine | 1.6% | 3.0%(-1.45)#66 | 4.5%(-2.89)#2,673 |
| 67. | Ocean Pines | 1.6% | 3.0%(-1.44)#67 | 4.5%(-2.88)#2,698 |
| 68. | Catonsville | 1.6% | 3.0%(-1.43)#68 | 4.5%(-2.87)#2,749 |
| 69. | Burtonsville | 1.6% | 3.0%(-1.41)#69 | 4.5%(-2.85)#2,797 |
| 70. | Olney | 1.6% | 3.0%(-1.39)#70 | 4.5%(-2.83)#2,848 |
| 71. | Redland | 1.6% | 3.0%(-1.38)#71 | 4.5%(-2.82)#2,882 |
| 72. | Highfield Cascade | 1.7% | 3.0%(-1.35)#72 | 4.5%(-2.79)#2,954 |
| 73. | West Laurel | 1.7% | 3.0%(-1.35)#73 | 4.5%(-2.78)#2,967 |
| 74. | Towson | 1.7% | 3.0%(-1.34)#74 | 4.5%(-2.78)#2,972 |
| 75. | California | 1.7% | 3.0%(-1.34)#75 | 4.5%(-2.77)#2,991 |
| 76. | Bel Air North | 1.7% | 3.0%(-1.33)#76 | 4.5%(-2.76)#3,014 |
| 77. | Jessup | 1.7% | 3.0%(-1.30)#77 | 4.5%(-2.73)#3,100 |
| 78. | Potomac | 1.7% | 3.0%(-1.28)#78 | 4.5%(-2.71)#3,134 |
| 79. | Odenton | 1.8% | 3.0%(-1.22)#79 | 4.5%(-2.65)#3,310 |
| 80. | Barton | 1.8% | 3.0%(-1.21)#80 | 4.5%(-2.64)#3,326 |
| 81. | Bel Air South | 1.8% | 3.0%(-1.19)#81 | 4.5%(-2.63)#3,362 |
| 82. | Camp Springs | 1.8% | 3.0%(-1.19)#82 | 4.5%(-2.62)#3,372 |
| 83. | North Kensington | 1.8% | 3.0%(-1.18)#83 | 4.5%(-2.61)#3,389 |
| 84. | Myersville | 1.9% | 3.0%(-1.16)#84 | 4.5%(-2.60)#3,435 |
| 85. | Oakland | 1.9% | 3.0%(-1.15)#85 | 4.5%(-2.58)#3,477 |
| 86. | Severn | 1.9% | 3.0%(-1.13)#86 | 4.5%(-2.56)#3,523 |
| 87. | Chevy Chase | 1.9% | 3.0%(-1.09)#87 | 4.5%(-2.53)#3,593 |
| 88. | Leonardtown | 1.9% | 3.0%(-1.08)#88 | 4.5%(-2.52)#3,609 |
| 89. | Glenmont | 1.9% | 3.0%(-1.08)#89 | 4.5%(-2.51)#3,622 |
| 90. | Fruitland | 2.0% | 3.0%(-1.08)#90 | 4.5%(-2.51)#3,623 |
| 91. | Pleasant Hills | 2.0% | 3.0%(-1.08)#91 | 4.5%(-2.51)#3,630 |
| 92. | Havre De Grace | 2.0% | 3.0%(-1.06)#92 | 4.5%(-2.50)#3,675 |
| 93. | Easton | 2.0% | 3.0%(-1.06)#93 | 4.5%(-2.50)#3,676 |
| 94. | Kettering | 2.0% | 3.0%(-1.05)#94 | 4.5%(-2.49)#3,706 |
| 95. | Springdale | 2.0% | 3.0%(-1.03)#95 | 4.5%(-2.46)#3,755 |
| 96. | St James | 2.0% | 3.0%(-1.02)#96 | 4.5%(-2.46)#3,773 |
| 97. | Fountainhead Orchard Hills | 2.0% | 3.0%(-1.01)#97 | 4.5%(-2.44)#3,819 |
| 98. | Woodsboro | 2.0% | 3.0%(-0.980)#98 | 4.5%(-2.41)#3,879 |
| 99. | Drum Point | 2.1% | 3.0%(-0.943)#99 | 4.5%(-2.38)#3,996 |
| 100. | Andrews Afb | 2.1% | 3.0%(-0.942)#100 | 4.5%(-2.37)#3,999 |
Common Questions
What are the Top 10 Cities with the Lowest Poverty Level Among Married Couples in Maryland?
Top 10 Cities with the Lowest Poverty Level Among Married Couples in Maryland are:
#1
0.13%
#2
0.34%
#3
0.36%
#4
0.44%
#5
0.45%
#6
0.47%
#7
0.48%
#8
0.51%
#9
0.52%
#10
0.59%
What city has the Lowest Poverty Level Among Married Couples in Maryland?
Lutherville has the Lowest Poverty Level Among Married Couples in Maryland with 0.13%.
What is the Poverty Level Among Married Couples in the State of Maryland?
Poverty Level Among Married Couples in Maryland is 3.0%.
What is the Poverty Level Among Married Couples in the United States?
Poverty Level Among Married Couples in the United States is 4.5%.