Cities with the Lowest Poverty Level Among Married Couples in New York
RELATED REPORTS & OPTIONS
Lowest Poverty | Married Couple
New York
Compare Cities
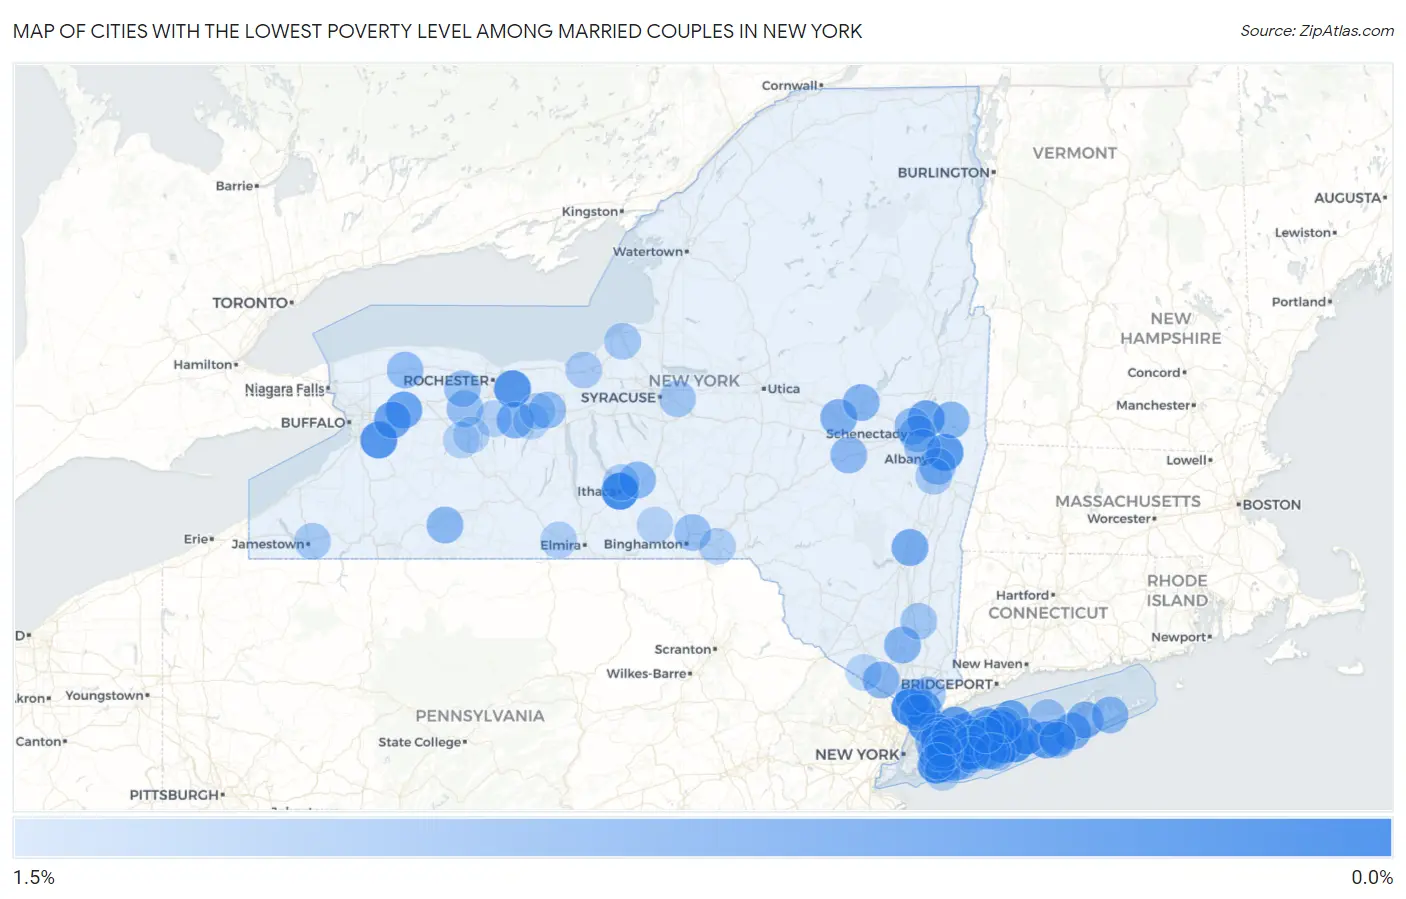
Map of Cities with the Lowest Poverty Level Among Married Couples in New York
1.5%
0.0%
Cities with the Lowest Poverty Level Among Married Couples in New York
| City | Married Couples Poverty | vs State | vs National | |
| 1. | Farmingdale | 0.13% | 5.3%(-5.17)#1 | 4.5%(-4.33)#12 |
| 2. | St James | 0.21% | 5.3%(-5.09)#2 | 4.5%(-4.26)#32 |
| 3. | Tappan | 0.23% | 5.3%(-5.07)#3 | 4.5%(-4.24)#40 |
| 4. | Ithaca | 0.25% | 5.3%(-5.05)#4 | 4.5%(-4.21)#48 |
| 5. | North Patchogue | 0.29% | 5.3%(-5.00)#5 | 4.5%(-4.17)#60 |
| 6. | Woodmere | 0.29% | 5.3%(-5.00)#6 | 4.5%(-4.17)#63 |
| 7. | Pelham | 0.33% | 5.3%(-4.97)#7 | 4.5%(-4.13)#85 |
| 8. | Bohemia | 0.33% | 5.3%(-4.97)#8 | 4.5%(-4.13)#86 |
| 9. | Fairport | 0.37% | 5.3%(-4.93)#9 | 4.5%(-4.09)#113 |
| 10. | East Aurora | 0.37% | 5.3%(-4.93)#10 | 4.5%(-4.09)#118 |
| 11. | Laurel Hollow | 0.39% | 5.3%(-4.91)#11 | 4.5%(-4.07)#128 |
| 12. | Wynantskill | 0.39% | 5.3%(-4.91)#12 | 4.5%(-4.07)#130 |
| 13. | Lake Delta | 0.40% | 5.3%(-4.89)#13 | 4.5%(-4.06)#144 |
| 14. | Loudonville | 0.42% | 5.3%(-4.88)#14 | 4.5%(-4.05)#160 |
| 15. | East Moriches | 0.45% | 5.3%(-4.84)#15 | 4.5%(-4.01)#197 |
| 16. | Bayville | 0.48% | 5.3%(-4.82)#16 | 4.5%(-3.98)#224 |
| 17. | Corfu | 0.51% | 5.3%(-4.78)#17 | 4.5%(-3.95)#258 |
| 18. | Port Jefferson | 0.53% | 5.3%(-4.77)#18 | 4.5%(-3.94)#273 |
| 19. | Alden | 0.53% | 5.3%(-4.76)#19 | 4.5%(-3.93)#282 |
| 20. | Yaphank | 0.54% | 5.3%(-4.76)#20 | 4.5%(-3.92)#295 |
| 21. | Country Knolls | 0.54% | 5.3%(-4.75)#21 | 4.5%(-3.92)#301 |
| 22. | East Setauket | 0.57% | 5.3%(-4.72)#22 | 4.5%(-3.89)#346 |
| 23. | Hampton Bays | 0.60% | 5.3%(-4.69)#23 | 4.5%(-3.86)#379 |
| 24. | Ardsley | 0.61% | 5.3%(-4.68)#24 | 4.5%(-3.85)#395 |
| 25. | Sands Point | 0.62% | 5.3%(-4.68)#25 | 4.5%(-3.85)#398 |
| 26. | Saugerties | 0.62% | 5.3%(-4.68)#26 | 4.5%(-3.84)#403 |
| 27. | Kings Park | 0.63% | 5.3%(-4.67)#27 | 4.5%(-3.83)#416 |
| 28. | Port Washington | 0.64% | 5.3%(-4.66)#28 | 4.5%(-3.82)#424 |
| 29. | East Rockaway | 0.66% | 5.3%(-4.64)#29 | 4.5%(-3.80)#459 |
| 30. | Palatine Bridge | 0.68% | 5.3%(-4.62)#30 | 4.5%(-3.78)#497 |
| 31. | Bloomfield | 0.68% | 5.3%(-4.61)#31 | 4.5%(-3.78)#500 |
| 32. | North Sea | 0.69% | 5.3%(-4.60)#32 | 4.5%(-3.77)#514 |
| 33. | Plainview | 0.71% | 5.3%(-4.58)#33 | 4.5%(-3.75)#548 |
| 34. | Tuxedo Park | 0.72% | 5.3%(-4.58)#34 | 4.5%(-3.75)#557 |
| 35. | Cornwall On Hudson | 0.72% | 5.3%(-4.58)#35 | 4.5%(-3.74)#563 |
| 36. | Johnstown | 0.72% | 5.3%(-4.57)#36 | 4.5%(-3.74)#567 |
| 37. | Fairview Cdp Dutchess County | 0.74% | 5.3%(-4.56)#37 | 4.5%(-3.73)#590 |
| 38. | Schaghticoke | 0.74% | 5.3%(-4.56)#38 | 4.5%(-3.72)#601 |
| 39. | Village Of The Branch | 0.75% | 5.3%(-4.55)#39 | 4.5%(-3.71)#618 |
| 40. | North Babylon | 0.75% | 5.3%(-4.55)#40 | 4.5%(-3.71)#620 |
| 41. | Belmont | 0.75% | 5.3%(-4.54)#41 | 4.5%(-3.71)#625 |
| 42. | Freeville | 0.75% | 5.3%(-4.54)#42 | 4.5%(-3.71)#626 |
| 43. | East Hampton North | 0.76% | 5.3%(-4.54)#43 | 4.5%(-3.70)#645 |
| 44. | Stewart Manor | 0.77% | 5.3%(-4.52)#44 | 4.5%(-3.69)#677 |
| 45. | East Greenbush | 0.77% | 5.3%(-4.52)#45 | 4.5%(-3.69)#681 |
| 46. | Cobleskill | 0.78% | 5.3%(-4.52)#46 | 4.5%(-3.69)#688 |
| 47. | Seaford | 0.78% | 5.3%(-4.51)#47 | 4.5%(-3.68)#704 |
| 48. | Westhampton | 0.78% | 5.3%(-4.51)#48 | 4.5%(-3.68)#711 |
| 49. | East Williston | 0.79% | 5.3%(-4.51)#49 | 4.5%(-3.67)#726 |
| 50. | Merrick | 0.79% | 5.3%(-4.51)#50 | 4.5%(-3.67)#730 |
| 51. | East Glenville | 0.79% | 5.3%(-4.50)#51 | 4.5%(-3.67)#737 |
| 52. | Bellerose | 0.80% | 5.3%(-4.50)#52 | 4.5%(-3.67)#748 |
| 53. | Clifton Springs | 0.81% | 5.3%(-4.49)#53 | 4.5%(-3.65)#776 |
| 54. | Niskayuna | 0.81% | 5.3%(-4.48)#54 | 4.5%(-3.65)#777 |
| 55. | Medina | 0.82% | 5.3%(-4.48)#55 | 4.5%(-3.64)#791 |
| 56. | Great Neck Estates | 0.82% | 5.3%(-4.47)#56 | 4.5%(-3.64)#804 |
| 57. | Caledonia | 0.83% | 5.3%(-4.47)#57 | 4.5%(-3.63)#817 |
| 58. | Fort Salonga | 0.84% | 5.3%(-4.46)#58 | 4.5%(-3.63)#836 |
| 59. | Plandome | 0.84% | 5.3%(-4.45)#59 | 4.5%(-3.62)#851 |
| 60. | East Farmingdale | 0.85% | 5.3%(-4.45)#60 | 4.5%(-3.61)#868 |
| 61. | Churchville | 0.85% | 5.3%(-4.44)#61 | 4.5%(-3.61)#874 |
| 62. | Nyack | 0.86% | 5.3%(-4.44)#62 | 4.5%(-3.61)#879 |
| 63. | Chenango Bridge | 0.86% | 5.3%(-4.43)#63 | 4.5%(-3.60)#888 |
| 64. | Tioga Terrace | 0.87% | 5.3%(-4.43)#64 | 4.5%(-3.60)#896 |
| 65. | Baiting Hollow | 0.87% | 5.3%(-4.42)#65 | 4.5%(-3.59)#910 |
| 66. | East Islip | 0.88% | 5.3%(-4.42)#66 | 4.5%(-3.59)#912 |
| 67. | Colonie | 0.89% | 5.3%(-4.41)#67 | 4.5%(-3.57)#933 |
| 68. | Hawthorne | 0.90% | 5.3%(-4.40)#68 | 4.5%(-3.56)#952 |
| 69. | Westhampton Beach | 0.91% | 5.3%(-4.38)#69 | 4.5%(-3.55)#988 |
| 70. | Myers Corner | 0.92% | 5.3%(-4.37)#70 | 4.5%(-3.54)#1,019 |
| 71. | Fayetteville | 0.93% | 5.3%(-4.37)#71 | 4.5%(-3.54)#1,021 |
| 72. | Garden City South | 0.93% | 5.3%(-4.37)#72 | 4.5%(-3.53)#1,029 |
| 73. | South Huntington | 0.93% | 5.3%(-4.36)#73 | 4.5%(-3.53)#1,039 |
| 74. | Minetto | 0.93% | 5.3%(-4.36)#74 | 4.5%(-3.53)#1,041 |
| 75. | Bay Shore | 0.95% | 5.3%(-4.35)#75 | 4.5%(-3.52)#1,070 |
| 76. | Hastings On Hudson | 0.95% | 5.3%(-4.35)#76 | 4.5%(-3.51)#1,077 |
| 77. | Stony Brook | 0.95% | 5.3%(-4.34)#77 | 4.5%(-3.51)#1,092 |
| 78. | Castleton On Hudson | 0.96% | 5.3%(-4.34)#78 | 4.5%(-3.50)#1,098 |
| 79. | Melville | 0.96% | 5.3%(-4.34)#79 | 4.5%(-3.50)#1,099 |
| 80. | North Amityville | 0.96% | 5.3%(-4.34)#80 | 4.5%(-3.50)#1,100 |
| 81. | Falconer | 0.96% | 5.3%(-4.34)#81 | 4.5%(-3.50)#1,102 |
| 82. | Garden City | 0.97% | 5.3%(-4.33)#82 | 4.5%(-3.50)#1,122 |
| 83. | Wolcott | 0.97% | 5.3%(-4.33)#83 | 4.5%(-3.49)#1,134 |
| 84. | Garden City Park | 0.98% | 5.3%(-4.31)#84 | 4.5%(-3.48)#1,164 |
| 85. | Lansing | 0.99% | 5.3%(-4.30)#85 | 4.5%(-3.47)#1,192 |
| 86. | South Corning | 1.0% | 5.3%(-4.30)#86 | 4.5%(-3.46)#1,205 |
| 87. | Long Beach | 1.0% | 5.3%(-4.28)#87 | 4.5%(-3.44)#1,249 |
| 88. | Old Brookville | 1.0% | 5.3%(-4.28)#88 | 4.5%(-3.44)#1,250 |
| 89. | Islip | 1.0% | 5.3%(-4.27)#89 | 4.5%(-3.44)#1,270 |
| 90. | Windsor | 1.0% | 5.3%(-4.27)#90 | 4.5%(-3.44)#1,275 |
| 91. | Lima | 1.0% | 5.3%(-4.26)#91 | 4.5%(-3.43)#1,293 |
| 92. | Leicester | 1.0% | 5.3%(-4.25)#92 | 4.5%(-3.42)#1,304 |
| 93. | Canandaigua | 1.0% | 5.3%(-4.25)#93 | 4.5%(-3.41)#1,319 |
| 94. | Geneseo | 1.0% | 5.3%(-4.25)#94 | 4.5%(-3.41)#1,320 |
| 95. | Newark Valley | 1.1% | 5.3%(-4.24)#95 | 4.5%(-3.41)#1,326 |
| 96. | Commack | 1.1% | 5.3%(-4.24)#96 | 4.5%(-3.41)#1,330 |
| 97. | Warwick | 1.1% | 5.3%(-4.24)#97 | 4.5%(-3.41)#1,335 |
| 98. | Highland-On-The-Lake | 1.1% | 5.3%(-4.24)#98 | 4.5%(-3.40)#1,339 |
| 99. | Shortsville | 1.1% | 5.3%(-4.24)#99 | 4.5%(-3.40)#1,340 |
| 100. | Valley Stream | 1.1% | 5.3%(-4.23)#100 | 4.5%(-3.40)#1,359 |
Common Questions
What are the Top 10 Cities with the Lowest Poverty Level Among Married Couples in New York?
Top 10 Cities with the Lowest Poverty Level Among Married Couples in New York are:
#1
0.13%
#2
0.21%
#3
0.23%
#4
0.25%
#5
0.29%
#6
0.29%
#7
0.33%
#8
0.33%
#9
0.37%
#10
0.37%
What city has the Lowest Poverty Level Among Married Couples in New York?
Farmingdale has the Lowest Poverty Level Among Married Couples in New York with 0.13%.
What is the Poverty Level Among Married Couples in the State of New York?
Poverty Level Among Married Couples in New York is 5.3%.
What is the Poverty Level Among Married Couples in the United States?
Poverty Level Among Married Couples in the United States is 4.5%.