Cities with the Lowest Poverty Level Among Married Couples in West Virginia
RELATED REPORTS & OPTIONS
Lowest Poverty | Married Couple
West Virginia
Compare Cities
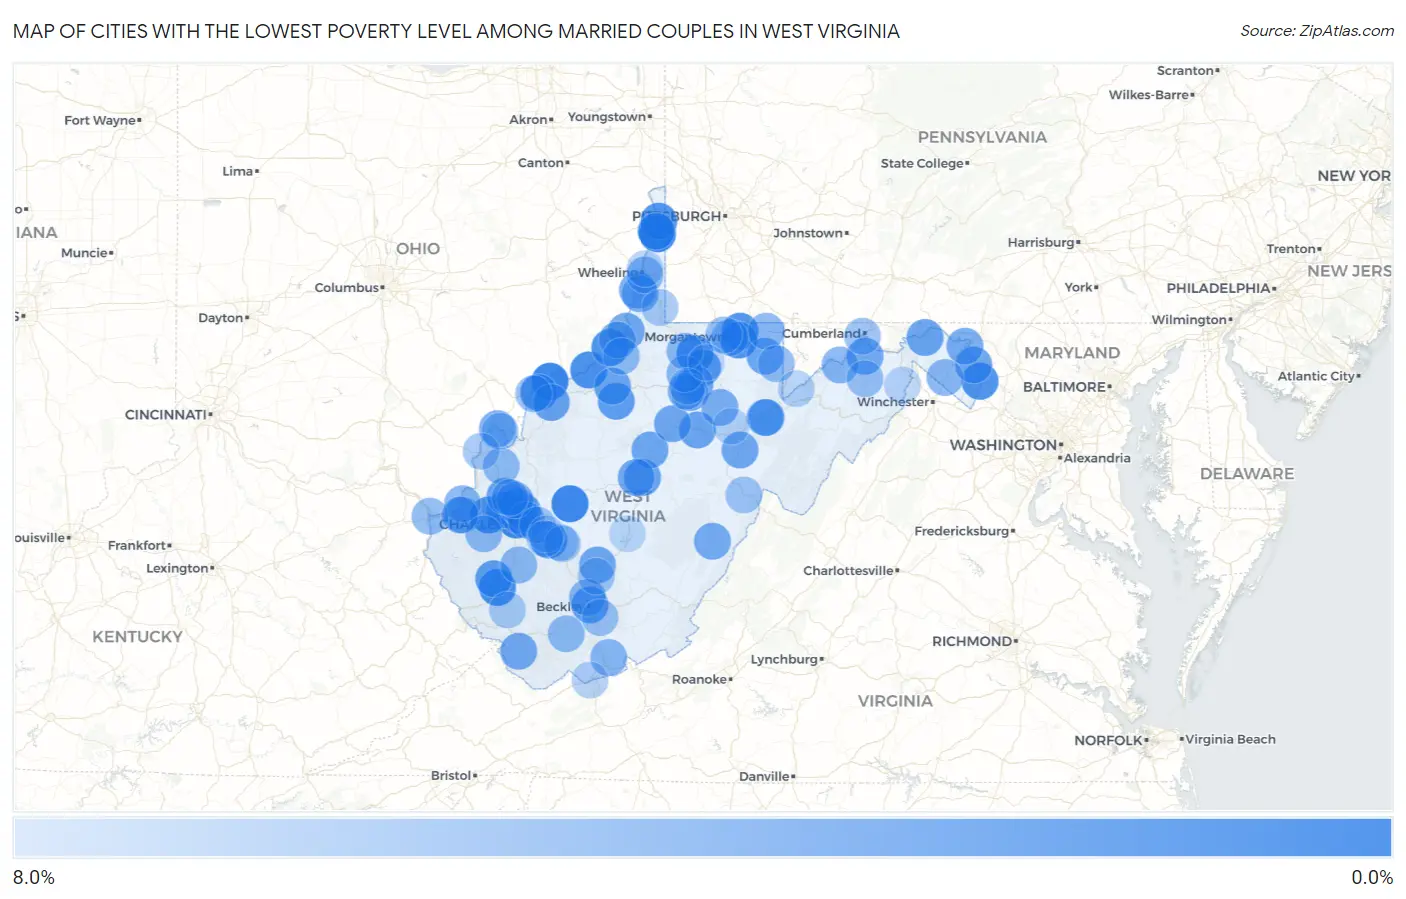
Map of Cities with the Lowest Poverty Level Among Married Couples in West Virginia
8.0%
0.0%
Cities with the Lowest Poverty Level Among Married Couples in West Virginia
| City | Married Couples Poverty | vs State | vs National | |
| 1. | Hooverson Heights | 0.37% | 6.6%(-6.21)#1 | 4.5%(-4.09)#120 |
| 2. | Clendenin | 0.56% | 6.6%(-6.03)#2 | 4.5%(-3.91)#316 |
| 3. | Vienna | 0.59% | 6.6%(-5.99)#3 | 4.5%(-3.87)#370 |
| 4. | St Albans | 0.60% | 6.6%(-5.99)#4 | 4.5%(-3.87)#372 |
| 5. | Teays Valley | 0.98% | 6.6%(-5.61)#5 | 4.5%(-3.48)#1,153 |
| 6. | Mitchell Heights | 1.1% | 6.6%(-5.47)#6 | 4.5%(-3.35)#1,456 |
| 7. | Farmington | 1.2% | 6.6%(-5.39)#7 | 4.5%(-3.27)#1,659 |
| 8. | St Marys | 1.2% | 6.6%(-5.35)#8 | 4.5%(-3.23)#1,755 |
| 9. | Culloden | 1.3% | 6.6%(-5.32)#9 | 4.5%(-3.20)#1,828 |
| 10. | Sistersville | 1.3% | 6.6%(-5.32)#10 | 4.5%(-3.20)#1,835 |
| 11. | Cheat Lake | 1.4% | 6.6%(-5.22)#11 | 4.5%(-3.10)#2,100 |
| 12. | Bolivar | 1.4% | 6.6%(-5.21)#12 | 4.5%(-3.09)#2,121 |
| 13. | Brookhaven | 1.4% | 6.6%(-5.21)#13 | 4.5%(-3.09)#2,130 |
| 14. | Belle | 1.5% | 6.6%(-5.13)#14 | 4.5%(-3.01)#2,362 |
| 15. | Weirton | 1.6% | 6.6%(-5.01)#15 | 4.5%(-2.88)#2,679 |
| 16. | Blennerhassett | 1.7% | 6.6%(-4.85)#16 | 4.5%(-2.73)#3,101 |
| 17. | Follansbee | 1.8% | 6.6%(-4.77)#17 | 4.5%(-2.64)#3,321 |
| 18. | Chapmanville | 2.1% | 6.6%(-4.47)#18 | 4.5%(-2.35)#4,065 |
| 19. | Pullman | 2.1% | 6.6%(-4.46)#19 | 4.5%(-2.33)#4,110 |
| 20. | White Hall | 2.4% | 6.6%(-4.23)#20 | 4.5%(-2.11)#4,683 |
| 21. | Nitro | 2.4% | 6.6%(-4.21)#21 | 4.5%(-2.09)#4,743 |
| 22. | Beckley | 2.4% | 6.6%(-4.20)#22 | 4.5%(-2.08)#4,748 |
| 23. | Poca | 2.4% | 6.6%(-4.20)#23 | 4.5%(-2.08)#4,758 |
| 24. | Cross Lanes | 2.7% | 6.6%(-3.93)#24 | 4.5%(-1.81)#5,453 |
| 25. | Mineralwells | 2.7% | 6.6%(-3.91)#25 | 4.5%(-1.79)#5,493 |
| 26. | Bath Berkeley Springs | 2.7% | 6.6%(-3.88)#26 | 4.5%(-1.76)#5,566 |
| 27. | Buckhannon | 2.7% | 6.6%(-3.85)#27 | 4.5%(-1.72)#5,651 |
| 28. | Sutton | 2.7% | 6.6%(-3.84)#28 | 4.5%(-1.72)#5,658 |
| 29. | Eleanor | 2.7% | 6.6%(-3.84)#29 | 4.5%(-1.71)#5,680 |
| 30. | Bridgeport | 2.8% | 6.6%(-3.83)#30 | 4.5%(-1.71)#5,697 |
| 31. | Shepherdstown | 2.8% | 6.6%(-3.81)#31 | 4.5%(-1.68)#5,748 |
| 32. | Pennsboro | 2.8% | 6.6%(-3.74)#32 | 4.5%(-1.62)#5,899 |
| 33. | Hambleton | 2.9% | 6.6%(-3.73)#33 | 4.5%(-1.60)#5,940 |
| 34. | Burnsville | 2.9% | 6.6%(-3.66)#34 | 4.5%(-1.54)#6,074 |
| 35. | Albright | 2.9% | 6.6%(-3.64)#35 | 4.5%(-1.52)#6,132 |
| 36. | Weston | 3.0% | 6.6%(-3.56)#36 | 4.5%(-1.44)#6,324 |
| 37. | Beverly | 3.1% | 6.6%(-3.52)#37 | 4.5%(-1.40)#6,413 |
| 38. | Fayetteville | 3.1% | 6.6%(-3.52)#38 | 4.5%(-1.39)#6,423 |
| 39. | New Martinsville | 3.1% | 6.6%(-3.49)#39 | 4.5%(-1.37)#6,483 |
| 40. | Fort Ashby | 3.2% | 6.6%(-3.41)#40 | 4.5%(-1.29)#6,659 |
| 41. | Gassaway | 3.2% | 6.6%(-3.41)#41 | 4.5%(-1.29)#6,662 |
| 42. | Iaeger | 3.2% | 6.6%(-3.41)#42 | 4.5%(-1.29)#6,672 |
| 43. | Stonewood | 3.2% | 6.6%(-3.39)#43 | 4.5%(-1.27)#6,713 |
| 44. | Marlinton | 3.3% | 6.6%(-3.28)#44 | 4.5%(-1.16)#6,957 |
| 45. | Falling Waters | 3.3% | 6.6%(-3.25)#45 | 4.5%(-1.13)#7,004 |
| 46. | Glen Dale | 3.3% | 6.6%(-3.24)#46 | 4.5%(-1.12)#7,047 |
| 47. | Barboursville | 3.4% | 6.6%(-3.23)#47 | 4.5%(-1.11)#7,064 |
| 48. | Hartford City | 3.4% | 6.6%(-3.14)#48 | 4.5%(-1.01)#7,265 |
| 49. | Dunbar | 3.5% | 6.6%(-3.07)#49 | 4.5%(-0.950)#7,433 |
| 50. | Paden City | 3.6% | 6.6%(-3.03)#50 | 4.5%(-0.910)#7,505 |
| 51. | Nutter Fort | 3.6% | 6.6%(-3.00)#51 | 4.5%(-0.876)#7,596 |
| 52. | Philippi | 3.6% | 6.6%(-2.97)#52 | 4.5%(-0.847)#7,643 |
| 53. | Moundsville | 3.6% | 6.6%(-2.96)#53 | 4.5%(-0.837)#7,664 |
| 54. | Arthurdale | 3.9% | 6.6%(-2.72)#54 | 4.5%(-0.599)#8,167 |
| 55. | Prosperity | 4.0% | 6.6%(-2.61)#55 | 4.5%(-0.486)#8,388 |
| 56. | Lesage | 4.1% | 6.6%(-2.52)#56 | 4.5%(-0.397)#8,558 |
| 57. | Keyser | 4.1% | 6.6%(-2.45)#57 | 4.5%(-0.332)#8,699 |
| 58. | Inwood | 4.1% | 6.6%(-2.44)#58 | 4.5%(-0.321)#8,716 |
| 59. | Athens | 4.2% | 6.6%(-2.42)#59 | 4.5%(-0.295)#8,759 |
| 60. | Bethlehem | 4.2% | 6.6%(-2.41)#60 | 4.5%(-0.289)#8,795 |
| 61. | Lumberport | 4.2% | 6.6%(-2.36)#61 | 4.5%(-0.237)#8,866 |
| 62. | Bancroft | 4.2% | 6.6%(-2.36)#62 | 4.5%(-0.237)#8,868 |
| 63. | Brandonville | 4.3% | 6.6%(-2.33)#63 | 4.5%(-0.207)#8,938 |
| 64. | Hamlin | 4.3% | 6.6%(-2.31)#64 | 4.5%(-0.188)#8,962 |
| 65. | Mannington | 4.3% | 6.6%(-2.28)#65 | 4.5%(-0.154)#9,009 |
| 66. | Madison | 4.3% | 6.6%(-2.26)#66 | 4.5%(-0.137)#9,030 |
| 67. | Mullens | 4.3% | 6.6%(-2.24)#67 | 4.5%(-0.114)#9,060 |
| 68. | Kenova | 4.4% | 6.6%(-2.16)#68 | 4.5%(-0.039)#9,224 |
| 69. | Hendricks | 4.4% | 6.6%(-2.14)#69 | 4.5%(-0.017)#9,262 |
| 70. | Middlebourne | 4.5% | 6.6%(-2.12)#70 | 4.5%(+0.002)#9,289 |
| 71. | Leon | 4.5% | 6.6%(-2.04)#71 | 4.5%(+0.084)#9,422 |
| 72. | Winfield | 4.6% | 6.6%(-1.95)#72 | 4.5%(+0.172)#9,582 |
| 73. | Morgantown | 4.7% | 6.6%(-1.92)#73 | 4.5%(+0.201)#9,657 |
| 74. | Terra Alta | 4.7% | 6.6%(-1.89)#74 | 4.5%(+0.236)#9,709 |
| 75. | Pea Ridge | 4.7% | 6.6%(-1.87)#75 | 4.5%(+0.249)#9,733 |
| 76. | Washington | 4.8% | 6.6%(-1.79)#76 | 4.5%(+0.335)#9,870 |
| 77. | Carpendale | 4.9% | 6.6%(-1.70)#77 | 4.5%(+0.427)#10,018 |
| 78. | Romney | 4.9% | 6.6%(-1.67)#78 | 4.5%(+0.456)#10,052 |
| 79. | Shady Spring | 5.0% | 6.6%(-1.62)#79 | 4.5%(+0.505)#10,132 |
| 80. | Westover | 5.0% | 6.6%(-1.56)#80 | 4.5%(+0.561)#10,243 |
| 81. | Durbin | 5.2% | 6.6%(-1.41)#81 | 4.5%(+0.710)#10,448 |
| 82. | New Haven | 5.2% | 6.6%(-1.36)#82 | 4.5%(+0.767)#10,526 |
| 83. | Point Pleasant | 5.3% | 6.6%(-1.28)#83 | 4.5%(+0.844)#10,654 |
| 84. | Charleston | 5.3% | 6.6%(-1.27)#84 | 4.5%(+0.854)#10,662 |
| 85. | Cedar Grove | 5.3% | 6.6%(-1.26)#85 | 4.5%(+0.857)#10,669 |
| 86. | Oak Hill | 5.4% | 6.6%(-1.22)#86 | 4.5%(+0.900)#10,744 |
| 87. | Cameron | 5.6% | 6.6%(-1.03)#87 | 4.5%(+1.09)#11,047 |
| 88. | Man | 5.7% | 6.6%(-0.932)#88 | 4.5%(+1.19)#11,190 |
| 89. | Ranson Corporation | 5.7% | 6.6%(-0.901)#89 | 4.5%(+1.22)#11,222 |
| 90. | Rand | 5.8% | 6.6%(-0.787)#90 | 4.5%(+1.34)#11,383 |
| 91. | Glasgow | 5.9% | 6.6%(-0.702)#91 | 4.5%(+1.42)#11,509 |
| 92. | Bluefield | 5.9% | 6.6%(-0.636)#92 | 4.5%(+1.49)#11,607 |
| 93. | Marmet | 6.0% | 6.6%(-0.628)#93 | 4.5%(+1.49)#11,616 |
| 94. | Bayard | 6.1% | 6.6%(-0.523)#94 | 4.5%(+1.60)#11,748 |
| 95. | Wheeling | 6.1% | 6.6%(-0.487)#95 | 4.5%(+1.64)#11,785 |
| 96. | Belington | 6.2% | 6.6%(-0.369)#96 | 4.5%(+1.75)#11,929 |
| 97. | Clarksburg | 6.3% | 6.6%(-0.257)#97 | 4.5%(+1.87)#12,068 |
| 98. | Capon Bridge | 6.3% | 6.6%(-0.235)#98 | 4.5%(+1.89)#12,105 |
| 99. | Summersville | 6.4% | 6.6%(-0.151)#99 | 4.5%(+1.97)#12,213 |
| 100. | Pleasant Valley | 6.6% | 6.6%(-0.029)#100 | 4.5%(+2.09)#12,371 |
Common Questions
What are the Top 10 Cities with the Lowest Poverty Level Among Married Couples in West Virginia?
Top 10 Cities with the Lowest Poverty Level Among Married Couples in West Virginia are:
#1
0.37%
#2
0.56%
#3
0.59%
#4
0.60%
#5
0.98%
#6
1.1%
#7
1.2%
#8
1.2%
#9
1.3%
#10
1.3%
What city has the Lowest Poverty Level Among Married Couples in West Virginia?
Hooverson Heights has the Lowest Poverty Level Among Married Couples in West Virginia with 0.37%.
What is the Poverty Level Among Married Couples in the State of West Virginia?
Poverty Level Among Married Couples in West Virginia is 6.6%.
What is the Poverty Level Among Married Couples in the United States?
Poverty Level Among Married Couples in the United States is 4.5%.