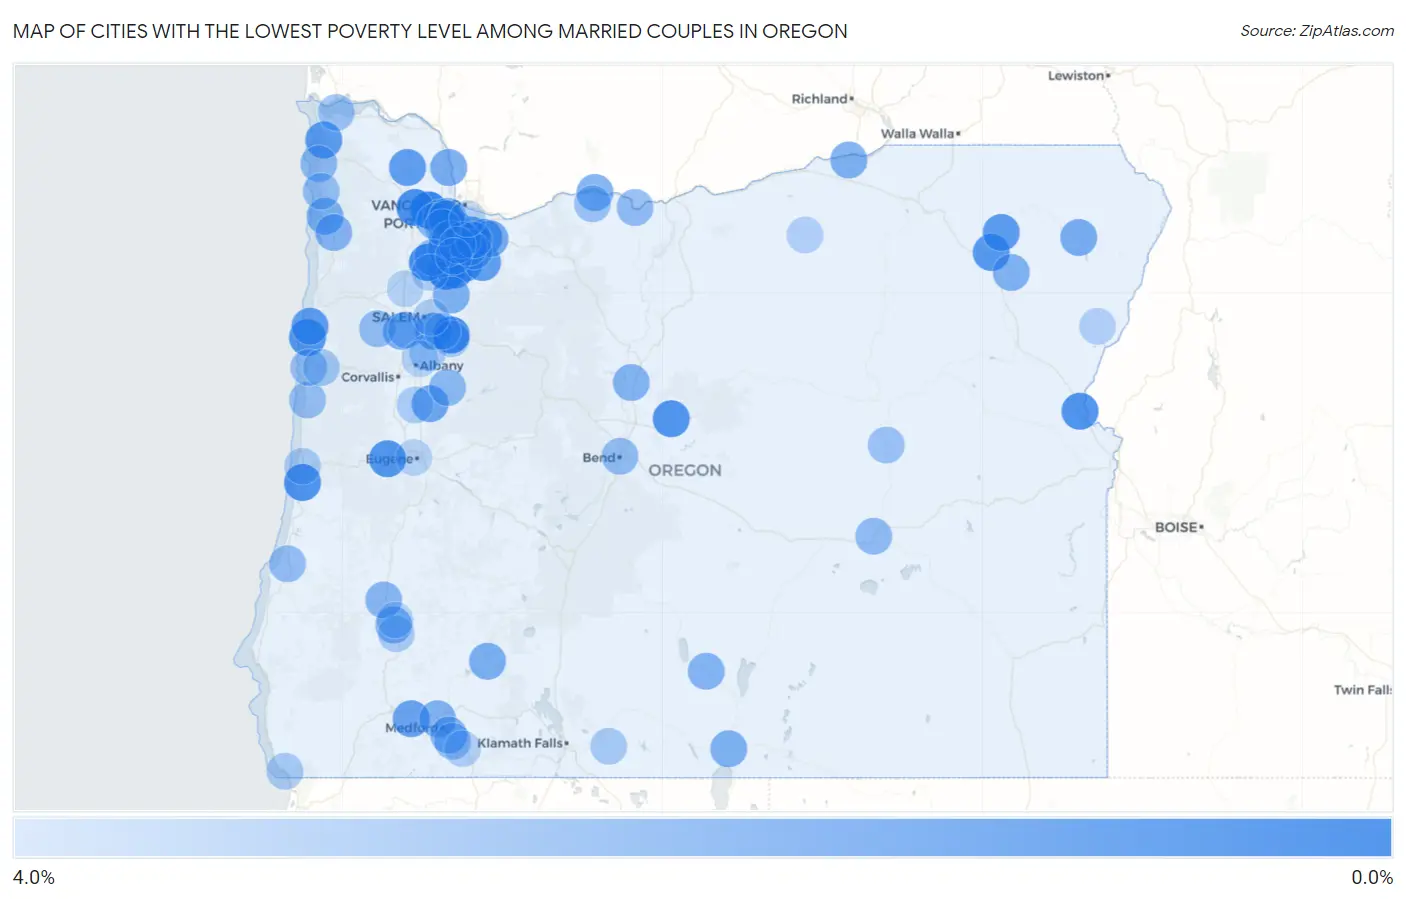
Cities with the Lowest Poverty Level Among Married Couples in Oregon
RELATED REPORTS & OPTIONS
Lowest Poverty | Married Couple
Oregon
Compare Cities
Map of Cities with the Lowest Poverty Level Among Married Couples in Oregon
4.0%
0.0%
Cities with the Lowest Poverty Level Among Married Couples in Oregon
| City | Married Couples Poverty | vs State | vs National | |
| 1. | Donald | 0.41% | 3.8%(-3.41)#1 | 4.5%(-4.05)#156 |
| 2. | North Plains | 0.42% | 3.8%(-3.41)#2 | 4.5%(-4.04)#163 |
| 3. | Dunthorpe | 0.59% | 3.8%(-3.24)#3 | 4.5%(-3.88)#357 |
| 4. | Dundee | 0.59% | 3.8%(-3.24)#4 | 4.5%(-3.87)#360 |
| 5. | Sublimity | 0.61% | 3.8%(-3.21)#5 | 4.5%(-3.85)#391 |
| 6. | Banks | 0.82% | 3.8%(-3.01)#6 | 4.5%(-3.64)#798 |
| 7. | Huntington | 0.93% | 3.8%(-2.89)#7 | 4.5%(-3.53)#1,042 |
| 8. | Dunes City | 0.95% | 3.8%(-2.87)#8 | 4.5%(-3.51)#1,086 |
| 9. | Depoe Bay | 0.96% | 3.8%(-2.86)#9 | 4.5%(-3.50)#1,106 |
| 10. | Cedar Hills | 0.96% | 3.8%(-2.86)#10 | 4.5%(-3.50)#1,111 |
| 11. | Prineville | 0.97% | 3.8%(-2.85)#11 | 4.5%(-3.49)#1,140 |
| 12. | Oak Grove | 0.98% | 3.8%(-2.84)#12 | 4.5%(-3.48)#1,169 |
| 13. | Veneta | 1.0% | 3.8%(-2.80)#13 | 4.5%(-3.44)#1,278 |
| 14. | Island City | 1.1% | 3.8%(-2.72)#14 | 4.5%(-3.35)#1,451 |
| 15. | Gearhart | 1.2% | 3.8%(-2.62)#15 | 4.5%(-3.26)#1,688 |
| 16. | Imbler | 1.2% | 3.8%(-2.62)#16 | 4.5%(-3.26)#1,701 |
| 17. | Canby | 1.2% | 3.8%(-2.60)#17 | 4.5%(-3.24)#1,739 |
| 18. | Aurora | 1.2% | 3.8%(-2.59)#18 | 4.5%(-3.23)#1,765 |
| 19. | Lincoln Beach | 1.3% | 3.8%(-2.53)#19 | 4.5%(-3.17)#1,910 |
| 20. | Vernonia | 1.3% | 3.8%(-2.53)#20 | 4.5%(-3.17)#1,921 |
| 21. | Milwaukie | 1.3% | 3.8%(-2.53)#21 | 4.5%(-3.16)#1,943 |
| 22. | Beavercreek | 1.3% | 3.8%(-2.48)#22 | 4.5%(-3.12)#2,060 |
| 23. | Raleigh Hills | 1.4% | 3.8%(-2.47)#23 | 4.5%(-3.11)#2,086 |
| 24. | Turner | 1.4% | 3.8%(-2.45)#24 | 4.5%(-3.08)#2,152 |
| 25. | Rockcreek | 1.4% | 3.8%(-2.43)#25 | 4.5%(-3.06)#2,203 |
| 26. | Bull Mountain | 1.4% | 3.8%(-2.43)#26 | 4.5%(-3.06)#2,206 |
| 27. | Happy Valley | 1.4% | 3.8%(-2.40)#27 | 4.5%(-3.03)#2,276 |
| 28. | Foots Creek | 1.5% | 3.8%(-2.31)#28 | 4.5%(-2.95)#2,518 |
| 29. | Tualatin | 1.6% | 3.8%(-2.20)#29 | 4.5%(-2.84)#2,815 |
| 30. | Brownsville | 1.6% | 3.8%(-2.19)#30 | 4.5%(-2.83)#2,837 |
| 31. | Sherwood | 1.7% | 3.8%(-2.14)#31 | 4.5%(-2.77)#2,986 |
| 32. | Garden Home Whitford | 1.8% | 3.8%(-2.02)#32 | 4.5%(-2.66)#3,289 |
| 33. | Enterprise | 1.8% | 3.8%(-2.02)#33 | 4.5%(-2.65)#3,297 |
| 34. | St Helens | 1.8% | 3.8%(-2.00)#34 | 4.5%(-2.64)#3,347 |
| 35. | Damascus | 1.8% | 3.8%(-1.99)#35 | 4.5%(-2.63)#3,369 |
| 36. | Oregon City | 1.9% | 3.8%(-1.93)#36 | 4.5%(-2.56)#3,522 |
| 37. | Garibaldi | 1.9% | 3.8%(-1.93)#37 | 4.5%(-2.56)#3,527 |
| 38. | Prospect | 1.9% | 3.8%(-1.92)#38 | 4.5%(-2.55)#3,546 |
| 39. | Monmouth | 1.9% | 3.8%(-1.91)#39 | 4.5%(-2.55)#3,547 |
| 40. | Metzger | 1.9% | 3.8%(-1.91)#40 | 4.5%(-2.54)#3,558 |
| 41. | Hood River | 2.0% | 3.8%(-1.87)#41 | 4.5%(-2.51)#3,625 |
| 42. | Lakeview | 2.0% | 3.8%(-1.86)#42 | 4.5%(-2.50)#3,674 |
| 43. | Umatilla | 2.0% | 3.8%(-1.86)#43 | 4.5%(-2.49)#3,688 |
| 44. | Mount Angel | 2.0% | 3.8%(-1.84)#44 | 4.5%(-2.47)#3,734 |
| 45. | Union | 2.0% | 3.8%(-1.81)#45 | 4.5%(-2.45)#3,796 |
| 46. | West Linn | 2.0% | 3.8%(-1.81)#46 | 4.5%(-2.44)#3,805 |
| 47. | Central Point | 2.1% | 3.8%(-1.77)#47 | 4.5%(-2.41)#3,889 |
| 48. | Phoenix | 2.1% | 3.8%(-1.77)#48 | 4.5%(-2.40)#3,893 |
| 49. | Santa Clara | 2.1% | 3.8%(-1.76)#49 | 4.5%(-2.40)#3,910 |
| 50. | Tri City | 2.1% | 3.8%(-1.75)#50 | 4.5%(-2.38)#3,966 |
| 51. | Tillamook | 2.1% | 3.8%(-1.74)#51 | 4.5%(-2.38)#3,971 |
| 52. | Culver | 2.1% | 3.8%(-1.72)#52 | 4.5%(-2.36)#4,035 |
| 53. | Paisley | 2.1% | 3.8%(-1.70)#53 | 4.5%(-2.33)#4,112 |
| 54. | Green | 2.2% | 3.8%(-1.62)#54 | 4.5%(-2.25)#4,309 |
| 55. | Hillsboro | 2.2% | 3.8%(-1.58)#55 | 4.5%(-2.21)#4,418 |
| 56. | Bethany | 2.3% | 3.8%(-1.57)#56 | 4.5%(-2.20)#4,439 |
| 57. | Oak Hills | 2.3% | 3.8%(-1.56)#57 | 4.5%(-2.20)#4,446 |
| 58. | Waterloo | 2.3% | 3.8%(-1.55)#58 | 4.5%(-2.19)#4,486 |
| 59. | Cannon Beach | 2.3% | 3.8%(-1.50)#59 | 4.5%(-2.14)#4,600 |
| 60. | The Dalles | 2.4% | 3.8%(-1.44)#60 | 4.5%(-2.07)#4,793 |
| 61. | Tigard | 2.4% | 3.8%(-1.43)#61 | 4.5%(-2.07)#4,802 |
| 62. | Hines | 2.4% | 3.8%(-1.42)#62 | 4.5%(-2.06)#4,823 |
| 63. | Lake Oswego | 2.4% | 3.8%(-1.42)#63 | 4.5%(-2.06)#4,833 |
| 64. | Bend | 2.4% | 3.8%(-1.40)#64 | 4.5%(-2.04)#4,868 |
| 65. | Falls City | 2.5% | 3.8%(-1.38)#65 | 4.5%(-2.01)#4,969 |
| 66. | Manzanita | 2.5% | 3.8%(-1.36)#66 | 4.5%(-1.99)#5,000 |
| 67. | Coos Bay | 2.5% | 3.8%(-1.33)#67 | 4.5%(-1.96)#5,055 |
| 68. | Waldport | 2.5% | 3.8%(-1.29)#68 | 4.5%(-1.93)#5,156 |
| 69. | Talent | 2.5% | 3.8%(-1.28)#69 | 4.5%(-1.92)#5,175 |
| 70. | Newport | 2.5% | 3.8%(-1.28)#70 | 4.5%(-1.92)#5,177 |
| 71. | Newberg | 2.6% | 3.8%(-1.26)#71 | 4.5%(-1.90)#5,216 |
| 72. | Odell | 2.6% | 3.8%(-1.19)#72 | 4.5%(-1.83)#5,393 |
| 73. | Seneca | 2.6% | 3.8%(-1.19)#73 | 4.5%(-1.83)#5,420 |
| 74. | Astoria | 2.6% | 3.8%(-1.19)#74 | 4.5%(-1.83)#5,422 |
| 75. | Independence | 2.7% | 3.8%(-1.13)#75 | 4.5%(-1.76)#5,553 |
| 76. | Mckay | 2.8% | 3.8%(-1.05)#76 | 4.5%(-1.68)#5,774 |
| 77. | Toledo | 2.8% | 3.8%(-0.998)#77 | 4.5%(-1.63)#5,864 |
| 78. | Jefferson | 2.8% | 3.8%(-0.983)#78 | 4.5%(-1.62)#5,892 |
| 79. | Running Y Ranch | 2.9% | 3.8%(-0.951)#79 | 4.5%(-1.59)#5,979 |
| 80. | Harbor | 2.9% | 3.8%(-0.928)#80 | 4.5%(-1.56)#6,024 |
| 81. | Bonanza | 2.9% | 3.8%(-0.928)#81 | 4.5%(-1.56)#6,030 |
| 82. | Florence | 2.9% | 3.8%(-0.890)#82 | 4.5%(-1.53)#6,106 |
| 83. | Stayton | 2.9% | 3.8%(-0.883)#83 | 4.5%(-1.52)#6,141 |
| 84. | Canyonville | 3.0% | 3.8%(-0.875)#84 | 4.5%(-1.51)#6,154 |
| 85. | Halsey | 3.0% | 3.8%(-0.841)#85 | 4.5%(-1.48)#6,228 |
| 86. | Oatfield | 3.0% | 3.8%(-0.832)#86 | 4.5%(-1.47)#6,255 |
| 87. | Aumsville | 3.0% | 3.8%(-0.808)#87 | 4.5%(-1.44)#6,310 |
| 88. | Aloha | 3.0% | 3.8%(-0.782)#88 | 4.5%(-1.42)#6,375 |
| 89. | Rivergrove | 3.1% | 3.8%(-0.773)#89 | 4.5%(-1.41)#6,392 |
| 90. | St Paul | 3.1% | 3.8%(-0.765)#90 | 4.5%(-1.40)#6,414 |
| 91. | Four Corners | 3.1% | 3.8%(-0.757)#91 | 4.5%(-1.39)#6,428 |
| 92. | Wilsonville | 3.1% | 3.8%(-0.742)#92 | 4.5%(-1.38)#6,458 |
| 93. | Ashland | 3.1% | 3.8%(-0.733)#93 | 4.5%(-1.37)#6,478 |
| 94. | Halfway | 3.1% | 3.8%(-0.701)#94 | 4.5%(-1.34)#6,555 |
| 95. | Lexington | 3.1% | 3.8%(-0.701)#95 | 4.5%(-1.34)#6,575 |
| 96. | Myrtle Creek | 3.2% | 3.8%(-0.652)#96 | 4.5%(-1.29)#6,658 |
| 97. | Amity | 3.2% | 3.8%(-0.639)#97 | 4.5%(-1.27)#6,694 |
| 98. | Millersburg | 3.2% | 3.8%(-0.616)#98 | 4.5%(-1.25)#6,741 |
| 99. | Portland | 3.2% | 3.8%(-0.604)#99 | 4.5%(-1.24)#6,762 |
| 100. | Eugene | 3.2% | 3.8%(-0.592)#100 | 4.5%(-1.23)#6,806 |
Common Questions
What are the Top 10 Cities with the Lowest Poverty Level Among Married Couples in Oregon?
Top 10 Cities with the Lowest Poverty Level Among Married Couples in Oregon are:
#1
0.41%
#2
0.42%
#3
0.59%
#4
0.61%
#5
0.82%
#6
0.93%
#7
0.95%
#8
0.96%
#9
0.96%
#10
0.97%
What city has the Lowest Poverty Level Among Married Couples in Oregon?
Donald has the Lowest Poverty Level Among Married Couples in Oregon with 0.41%.
What is the Poverty Level Among Married Couples in the State of Oregon?
Poverty Level Among Married Couples in Oregon is 3.8%.
What is the Poverty Level Among Married Couples in the United States?
Poverty Level Among Married Couples in the United States is 4.5%.