Cities with the Lowest Poverty Level Among Married Couples in Kansas
RELATED REPORTS & OPTIONS
Lowest Poverty | Married Couple
Kansas
Compare Cities
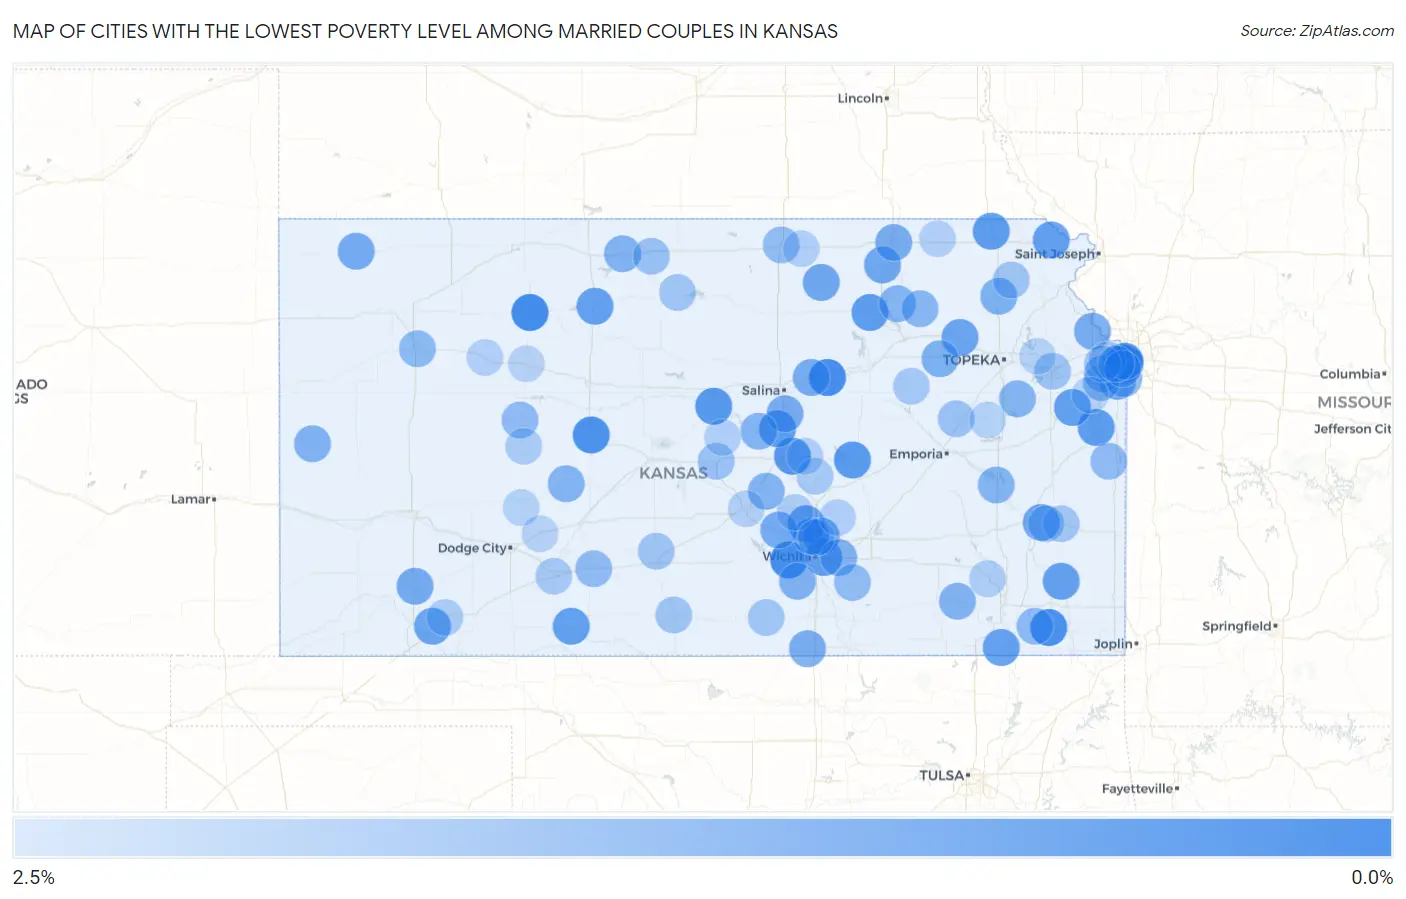
Map of Cities with the Lowest Poverty Level Among Married Couples in Kansas
2.5%
0.0%
Cities with the Lowest Poverty Level Among Married Couples in Kansas
| City | Married Couples Poverty | vs State | vs National | |
| 1. | Mission Hills | 0.096% | 3.9%(-3.76)#1 | 4.5%(-4.37)#6 |
| 2. | Hill City | 0.31% | 3.9%(-3.54)#2 | 4.5%(-4.15)#75 |
| 3. | Goddard | 0.37% | 3.9%(-3.49)#3 | 4.5%(-4.10)#111 |
| 4. | Abilene | 0.38% | 3.9%(-3.47)#4 | 4.5%(-4.08)#123 |
| 5. | Altamont | 0.47% | 3.9%(-3.39)#5 | 4.5%(-4.00)#209 |
| 6. | La Crosse | 0.48% | 3.9%(-3.37)#6 | 4.5%(-3.98)#225 |
| 7. | Galva | 0.65% | 3.9%(-3.21)#7 | 4.5%(-3.82)#436 |
| 8. | Ellsworth | 0.69% | 3.9%(-3.17)#8 | 4.5%(-3.77)#506 |
| 9. | Marion | 0.75% | 3.9%(-3.11)#9 | 4.5%(-3.72)#610 |
| 10. | Paola | 0.76% | 3.9%(-3.09)#10 | 4.5%(-3.70)#657 |
| 11. | Sabetha | 0.82% | 3.9%(-3.03)#11 | 4.5%(-3.64)#797 |
| 12. | Leonardville | 0.83% | 3.9%(-3.02)#12 | 4.5%(-3.63)#834 |
| 13. | Lindsborg | 0.85% | 3.9%(-3.01)#13 | 4.5%(-3.62)#858 |
| 14. | Protection | 0.88% | 3.9%(-2.97)#14 | 4.5%(-3.58)#925 |
| 15. | Wellsville | 0.90% | 3.9%(-2.96)#15 | 4.5%(-3.56)#950 |
| 16. | Eastborough | 0.93% | 3.9%(-2.92)#16 | 4.5%(-3.53)#1,030 |
| 17. | Stockton | 0.93% | 3.9%(-2.92)#17 | 4.5%(-3.53)#1,035 |
| 18. | Highland | 0.95% | 3.9%(-2.90)#18 | 4.5%(-3.51)#1,087 |
| 19. | Dearing | 0.95% | 3.9%(-2.90)#19 | 4.5%(-3.51)#1,090 |
| 20. | St Paul | 0.97% | 3.9%(-2.88)#20 | 4.5%(-3.49)#1,137 |
| 21. | Sedgwick | 0.99% | 3.9%(-2.86)#21 | 4.5%(-3.47)#1,184 |
| 22. | Kismet | 1.0% | 3.9%(-2.81)#22 | 4.5%(-3.42)#1,306 |
| 23. | St Marys | 1.0% | 3.9%(-2.80)#23 | 4.5%(-3.41)#1,317 |
| 24. | Kechi | 1.1% | 3.9%(-2.79)#24 | 4.5%(-3.40)#1,361 |
| 25. | Gas | 1.1% | 3.9%(-2.78)#25 | 4.5%(-3.39)#1,379 |
| 26. | Waterville | 1.1% | 3.9%(-2.70)#26 | 4.5%(-3.31)#1,557 |
| 27. | Clifton | 1.1% | 3.9%(-2.70)#27 | 4.5%(-3.31)#1,558 |
| 28. | Overland Park | 1.2% | 3.9%(-2.69)#28 | 4.5%(-3.30)#1,581 |
| 29. | Valley Center | 1.2% | 3.9%(-2.67)#29 | 4.5%(-3.28)#1,631 |
| 30. | Sublette | 1.2% | 3.9%(-2.61)#30 | 4.5%(-3.22)#1,783 |
| 31. | Mount Hope | 1.3% | 3.9%(-2.60)#31 | 4.5%(-3.20)#1,810 |
| 32. | Mcdonald | 1.3% | 3.9%(-2.59)#32 | 4.5%(-3.20)#1,846 |
| 33. | Solomon | 1.3% | 3.9%(-2.55)#33 | 4.5%(-3.16)#1,934 |
| 34. | Lansing | 1.3% | 3.9%(-2.55)#34 | 4.5%(-3.16)#1,950 |
| 35. | Assaria | 1.3% | 3.9%(-2.54)#35 | 4.5%(-3.15)#1,976 |
| 36. | South Haven | 1.3% | 3.9%(-2.52)#36 | 4.5%(-3.13)#2,024 |
| 37. | Marysville | 1.3% | 3.9%(-2.51)#37 | 4.5%(-3.12)#2,064 |
| 38. | Mcfarland | 1.4% | 3.9%(-2.44)#38 | 4.5%(-3.05)#2,235 |
| 39. | Holton | 1.4% | 3.9%(-2.42)#39 | 4.5%(-3.03)#2,296 |
| 40. | Clearwater | 1.5% | 3.9%(-2.40)#40 | 4.5%(-3.01)#2,365 |
| 41. | Tribune | 1.5% | 3.9%(-2.40)#41 | 4.5%(-3.01)#2,368 |
| 42. | Andover | 1.5% | 3.9%(-2.36)#42 | 4.5%(-2.97)#2,445 |
| 43. | Kensington | 1.5% | 3.9%(-2.34)#43 | 4.5%(-2.95)#2,521 |
| 44. | Longton | 1.5% | 3.9%(-2.34)#44 | 4.5%(-2.95)#2,526 |
| 45. | Lenexa | 1.5% | 3.9%(-2.33)#45 | 4.5%(-2.94)#2,539 |
| 46. | Burdett | 1.5% | 3.9%(-2.31)#46 | 4.5%(-2.92)#2,581 |
| 47. | Mission | 1.5% | 3.9%(-2.31)#47 | 4.5%(-2.92)#2,592 |
| 48. | Buhler | 1.5% | 3.9%(-2.31)#48 | 4.5%(-2.92)#2,595 |
| 49. | Overbrook | 1.6% | 3.9%(-2.29)#49 | 4.5%(-2.90)#2,632 |
| 50. | Marquette | 1.6% | 3.9%(-2.29)#50 | 4.5%(-2.90)#2,634 |
| 51. | Burlington | 1.6% | 3.9%(-2.28)#51 | 4.5%(-2.89)#2,658 |
| 52. | Olsburg | 1.6% | 3.9%(-2.27)#52 | 4.5%(-2.87)#2,723 |
| 53. | Westmoreland | 1.6% | 3.9%(-2.24)#53 | 4.5%(-2.85)#2,785 |
| 54. | Leawood | 1.7% | 3.9%(-2.15)#54 | 4.5%(-2.76)#3,020 |
| 55. | Oakley | 1.7% | 3.9%(-2.14)#55 | 4.5%(-2.75)#3,054 |
| 56. | Mound Valley | 1.7% | 3.9%(-2.13)#56 | 4.5%(-2.74)#3,083 |
| 57. | La Cygne | 1.8% | 3.9%(-2.08)#57 | 4.5%(-2.69)#3,187 |
| 58. | Greensburg | 1.8% | 3.9%(-2.08)#58 | 4.5%(-2.69)#3,189 |
| 59. | Ransom | 1.8% | 3.9%(-2.07)#59 | 4.5%(-2.68)#3,246 |
| 60. | Olathe | 1.8% | 3.9%(-2.05)#60 | 4.5%(-2.66)#3,292 |
| 61. | Belleville | 1.8% | 3.9%(-2.04)#61 | 4.5%(-2.65)#3,298 |
| 62. | Douglass | 1.8% | 3.9%(-2.04)#62 | 4.5%(-2.65)#3,308 |
| 63. | Westwood Hills | 1.8% | 3.9%(-2.04)#63 | 4.5%(-2.64)#3,331 |
| 64. | Westwood | 1.8% | 3.9%(-2.01)#64 | 4.5%(-2.62)#3,377 |
| 65. | Smith Center | 1.9% | 3.9%(-1.93)#65 | 4.5%(-2.54)#3,563 |
| 66. | Admire | 2.0% | 3.9%(-1.89)#66 | 4.5%(-2.50)#3,667 |
| 67. | Lyons | 2.0% | 3.9%(-1.87)#67 | 4.5%(-2.48)#3,725 |
| 68. | Lawrence | 2.0% | 3.9%(-1.85)#68 | 4.5%(-2.46)#3,754 |
| 69. | Whiting | 2.0% | 3.9%(-1.81)#69 | 4.5%(-2.42)#3,861 |
| 70. | Iuka | 2.0% | 3.9%(-1.81)#70 | 4.5%(-2.42)#3,865 |
| 71. | Lake Quivira | 2.0% | 3.9%(-1.81)#71 | 4.5%(-2.42)#3,877 |
| 72. | Medicine Lodge | 2.1% | 3.9%(-1.80)#72 | 4.5%(-2.40)#3,894 |
| 73. | Argonia | 2.1% | 3.9%(-1.77)#73 | 4.5%(-2.38)#3,981 |
| 74. | Downs | 2.1% | 3.9%(-1.76)#74 | 4.5%(-2.36)#4,021 |
| 75. | Shawnee | 2.1% | 3.9%(-1.71)#75 | 4.5%(-2.32)#4,138 |
| 76. | Moran | 2.2% | 3.9%(-1.70)#76 | 4.5%(-2.31)#4,171 |
| 77. | Prairie Village | 2.2% | 3.9%(-1.68)#77 | 4.5%(-2.29)#4,206 |
| 78. | Alta Vista | 2.2% | 3.9%(-1.68)#78 | 4.5%(-2.29)#4,221 |
| 79. | La Harpe | 2.2% | 3.9%(-1.66)#79 | 4.5%(-2.27)#4,261 |
| 80. | Goessel | 2.2% | 3.9%(-1.63)#80 | 4.5%(-2.24)#4,344 |
| 81. | Bucklin | 2.2% | 3.9%(-1.62)#81 | 4.5%(-2.23)#4,390 |
| 82. | Merriam | 2.2% | 3.9%(-1.62)#82 | 4.5%(-2.23)#4,393 |
| 83. | Plains | 2.3% | 3.9%(-1.57)#83 | 4.5%(-2.18)#4,514 |
| 84. | Ness City | 2.3% | 3.9%(-1.57)#84 | 4.5%(-2.17)#4,522 |
| 85. | Fredonia | 2.3% | 3.9%(-1.53)#85 | 4.5%(-2.14)#4,599 |
| 86. | Halstead | 2.3% | 3.9%(-1.52)#86 | 4.5%(-2.13)#4,629 |
| 87. | Park City | 2.4% | 3.9%(-1.50)#87 | 4.5%(-2.11)#4,693 |
| 88. | Canton | 2.4% | 3.9%(-1.47)#88 | 4.5%(-2.08)#4,765 |
| 89. | Whitewater | 2.4% | 3.9%(-1.45)#89 | 4.5%(-2.06)#4,827 |
| 90. | South Hutchinson | 2.4% | 3.9%(-1.43)#90 | 4.5%(-2.04)#4,870 |
| 91. | Quinter | 2.4% | 3.9%(-1.43)#91 | 4.5%(-2.03)#4,883 |
| 92. | Axtell | 2.4% | 3.9%(-1.41)#92 | 4.5%(-2.02)#4,921 |
| 93. | Cuba | 2.4% | 3.9%(-1.41)#93 | 4.5%(-2.02)#4,930 |
| 94. | Geneseo | 2.4% | 3.9%(-1.41)#94 | 4.5%(-2.02)#4,933 |
| 95. | Osage City | 2.4% | 3.9%(-1.41)#95 | 4.5%(-2.02)#4,946 |
| 96. | Jetmore | 2.5% | 3.9%(-1.38)#96 | 4.5%(-1.99)#4,999 |
| 97. | Gardner | 2.5% | 3.9%(-1.38)#97 | 4.5%(-1.99)#5,012 |
| 98. | Perry | 2.5% | 3.9%(-1.37)#98 | 4.5%(-1.98)#5,015 |
| 99. | Wakeeney | 2.5% | 3.9%(-1.36)#99 | 4.5%(-1.97)#5,034 |
| 100. | Spearville | 2.5% | 3.9%(-1.35)#100 | 4.5%(-1.96)#5,064 |
Common Questions
What are the Top 10 Cities with the Lowest Poverty Level Among Married Couples in Kansas?
Top 10 Cities with the Lowest Poverty Level Among Married Couples in Kansas are:
What city has the Lowest Poverty Level Among Married Couples in Kansas?
Mission Hills has the Lowest Poverty Level Among Married Couples in Kansas with 0.096%.
What is the Poverty Level Among Married Couples in the State of Kansas?
Poverty Level Among Married Couples in Kansas is 3.9%.
What is the Poverty Level Among Married Couples in the United States?
Poverty Level Among Married Couples in the United States is 4.5%.