Cities with the Lowest Poverty Level Among Married Couples in Missouri
RELATED REPORTS & OPTIONS
Lowest Poverty | Married Couple
Missouri
Compare Cities
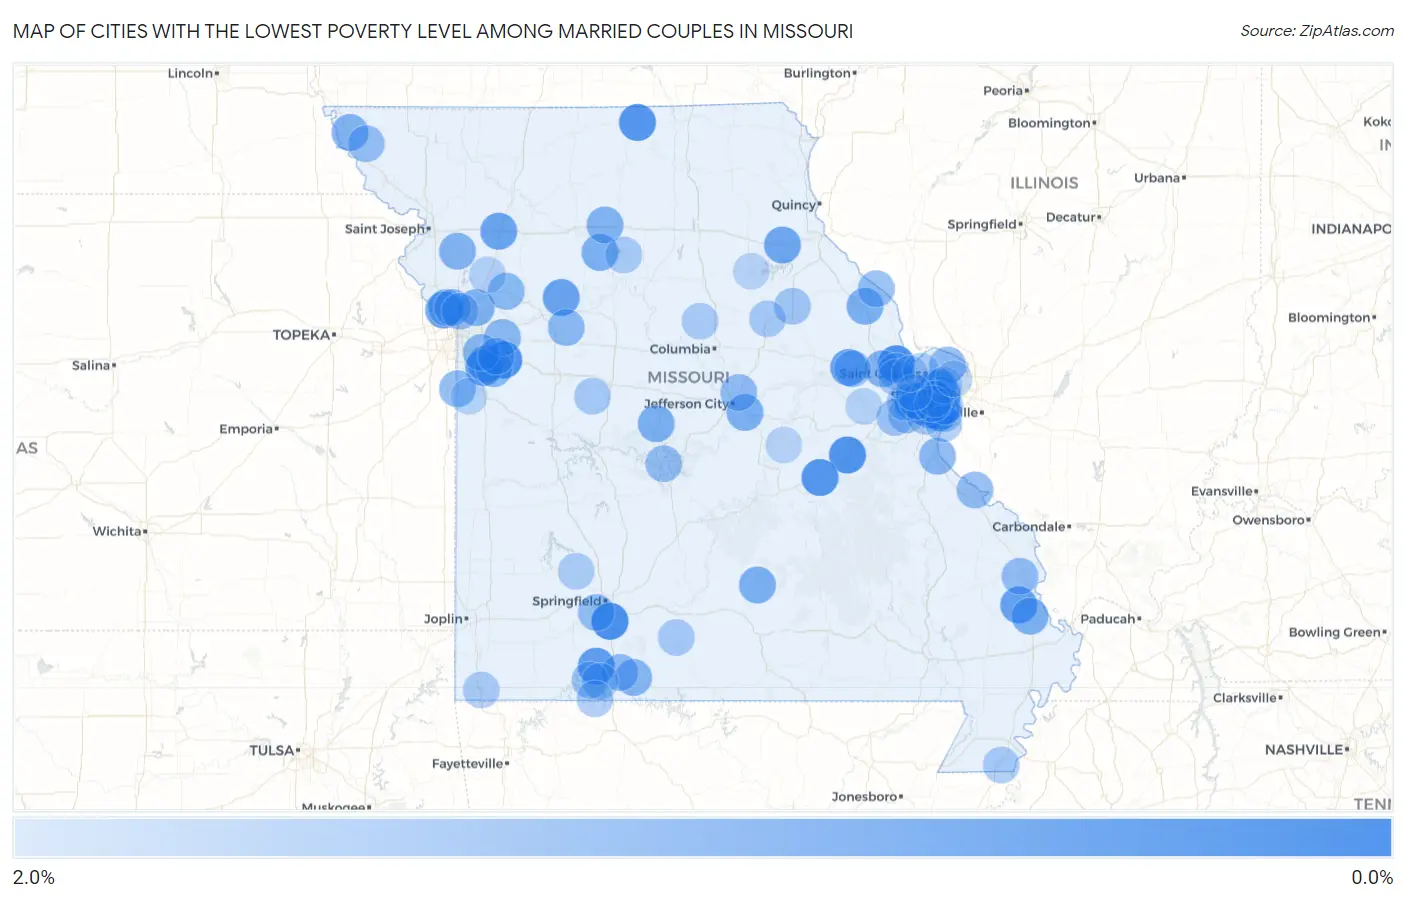
Map of Cities with the Lowest Poverty Level Among Married Couples in Missouri
2.0%
0.0%
Cities with the Lowest Poverty Level Among Married Couples in Missouri
| City | Married Couples Poverty | vs State | vs National | |
| 1. | Concord | 0.053% | 4.2%(-4.10)#1 | 4.5%(-4.41)#2 |
| 2. | Fremont Hills | 0.29% | 4.2%(-3.87)#2 | 4.5%(-4.17)#59 |
| 3. | Webster Groves | 0.31% | 4.2%(-3.85)#3 | 4.5%(-4.16)#72 |
| 4. | St Paul | 0.34% | 4.2%(-3.82)#4 | 4.5%(-4.12)#94 |
| 5. | Lone Jack | 0.34% | 4.2%(-3.81)#5 | 4.5%(-4.12)#97 |
| 6. | Sullivan | 0.39% | 4.2%(-3.77)#6 | 4.5%(-4.08)#127 |
| 7. | Cuba | 0.47% | 4.2%(-3.69)#7 | 4.5%(-3.99)#212 |
| 8. | Unionville | 0.48% | 4.2%(-3.68)#8 | 4.5%(-3.99)#219 |
| 9. | Ellisville | 0.48% | 4.2%(-3.67)#9 | 4.5%(-3.98)#226 |
| 10. | Des Peres | 0.60% | 4.2%(-3.55)#10 | 4.5%(-3.86)#382 |
| 11. | Reeds Spring | 0.62% | 4.2%(-3.54)#11 | 4.5%(-3.84)#408 |
| 12. | Chaffee | 0.67% | 4.2%(-3.49)#12 | 4.5%(-3.79)#476 |
| 13. | Warrenton | 0.68% | 4.2%(-3.48)#13 | 4.5%(-3.78)#494 |
| 14. | Fenton | 0.68% | 4.2%(-3.48)#14 | 4.5%(-3.78)#495 |
| 15. | Parkville | 0.72% | 4.2%(-3.44)#15 | 4.5%(-3.74)#560 |
| 16. | Greenwood | 0.72% | 4.2%(-3.44)#16 | 4.5%(-3.74)#566 |
| 17. | Norborne | 0.72% | 4.2%(-3.43)#17 | 4.5%(-3.74)#574 |
| 18. | Grantwood Village | 0.75% | 4.2%(-3.41)#18 | 4.5%(-3.71)#616 |
| 19. | Cameron | 0.76% | 4.2%(-3.40)#19 | 4.5%(-3.70)#644 |
| 20. | Lake Winnebago | 0.78% | 4.2%(-3.38)#20 | 4.5%(-3.69)#685 |
| 21. | Winchester | 0.79% | 4.2%(-3.36)#21 | 4.5%(-3.67)#739 |
| 22. | Monroe City | 0.82% | 4.2%(-3.34)#22 | 4.5%(-3.64)#800 |
| 23. | Affton | 0.92% | 4.2%(-3.23)#23 | 4.5%(-3.54)#1,017 |
| 24. | Hale | 0.98% | 4.2%(-3.18)#24 | 4.5%(-3.48)#1,158 |
| 25. | Versailles | 0.98% | 4.2%(-3.17)#25 | 4.5%(-3.48)#1,165 |
| 26. | Houston | 0.99% | 4.2%(-3.17)#26 | 4.5%(-3.48)#1,173 |
| 27. | Olivette | 0.99% | 4.2%(-3.17)#27 | 4.5%(-3.47)#1,179 |
| 28. | Taos | 1.0% | 4.2%(-3.16)#28 | 4.5%(-3.46)#1,204 |
| 29. | Eolia | 1.0% | 4.2%(-3.16)#29 | 4.5%(-3.46)#1,210 |
| 30. | Benton | 1.0% | 4.2%(-3.13)#30 | 4.5%(-3.43)#1,283 |
| 31. | Ladue | 1.0% | 4.2%(-3.12)#31 | 4.5%(-3.43)#1,292 |
| 32. | Liberty | 1.0% | 4.2%(-3.12)#32 | 4.5%(-3.42)#1,301 |
| 33. | Rock Port | 1.1% | 4.2%(-3.09)#33 | 4.5%(-3.40)#1,352 |
| 34. | Wentzville | 1.1% | 4.2%(-3.09)#34 | 4.5%(-3.40)#1,366 |
| 35. | Glendale | 1.1% | 4.2%(-3.09)#35 | 4.5%(-3.39)#1,368 |
| 36. | Meadville | 1.1% | 4.2%(-3.08)#36 | 4.5%(-3.39)#1,381 |
| 37. | Gower | 1.1% | 4.2%(-3.08)#37 | 4.5%(-3.38)#1,389 |
| 38. | Creve Coeur | 1.1% | 4.2%(-3.05)#38 | 4.5%(-3.35)#1,448 |
| 39. | Kissee Mills | 1.1% | 4.2%(-3.03)#39 | 4.5%(-3.34)#1,479 |
| 40. | Crystal City | 1.2% | 4.2%(-2.99)#40 | 4.5%(-3.30)#1,597 |
| 41. | Pleasant Hill | 1.2% | 4.2%(-2.96)#41 | 4.5%(-3.27)#1,667 |
| 42. | Grain Valley | 1.2% | 4.2%(-2.96)#42 | 4.5%(-3.27)#1,668 |
| 43. | Wood Heights | 1.2% | 4.2%(-2.96)#43 | 4.5%(-3.26)#1,677 |
| 44. | Corder | 1.2% | 4.2%(-2.95)#44 | 4.5%(-3.26)#1,696 |
| 45. | Lee S Summit | 1.2% | 4.2%(-2.95)#45 | 4.5%(-3.25)#1,706 |
| 46. | Cleveland | 1.2% | 4.2%(-2.92)#46 | 4.5%(-3.23)#1,766 |
| 47. | Lake Lotawana | 1.3% | 4.2%(-2.89)#47 | 4.5%(-3.20)#1,829 |
| 48. | Jackson | 1.3% | 4.2%(-2.89)#48 | 4.5%(-3.19)#1,850 |
| 49. | Weatherby Lake | 1.3% | 4.2%(-2.89)#49 | 4.5%(-3.19)#1,855 |
| 50. | Holts Summit | 1.3% | 4.2%(-2.88)#50 | 4.5%(-3.18)#1,874 |
| 51. | Rockaway Beach | 1.3% | 4.2%(-2.88)#51 | 4.5%(-3.18)#1,887 |
| 52. | Richmond Heights | 1.3% | 4.2%(-2.87)#52 | 4.5%(-3.18)#1,894 |
| 53. | Ste Genevieve | 1.3% | 4.2%(-2.86)#53 | 4.5%(-3.17)#1,913 |
| 54. | Old Jamestown | 1.3% | 4.2%(-2.86)#54 | 4.5%(-3.17)#1,919 |
| 55. | Clarksville | 1.3% | 4.2%(-2.86)#55 | 4.5%(-3.16)#1,937 |
| 56. | Sunset Hills | 1.3% | 4.2%(-2.86)#56 | 4.5%(-3.16)#1,944 |
| 57. | Lake Waukomis | 1.3% | 4.2%(-2.84)#57 | 4.5%(-3.14)#1,981 |
| 58. | Battlefield | 1.3% | 4.2%(-2.83)#58 | 4.5%(-3.14)#1,995 |
| 59. | Fairfax | 1.4% | 4.2%(-2.81)#59 | 4.5%(-3.11)#2,078 |
| 60. | Sunrise Beach | 1.4% | 4.2%(-2.81)#60 | 4.5%(-3.11)#2,079 |
| 61. | Oakview | 1.4% | 4.2%(-2.77)#61 | 4.5%(-3.07)#2,176 |
| 62. | Truesdale | 1.4% | 4.2%(-2.74)#62 | 4.5%(-3.04)#2,248 |
| 63. | Overland | 1.4% | 4.2%(-2.74)#63 | 4.5%(-3.04)#2,255 |
| 64. | Kimberling City | 1.4% | 4.2%(-2.73)#64 | 4.5%(-3.04)#2,265 |
| 65. | Pacific | 1.4% | 4.2%(-2.72)#65 | 4.5%(-3.02)#2,317 |
| 66. | Mehlville | 1.5% | 4.2%(-2.70)#66 | 4.5%(-3.01)#2,369 |
| 67. | Rock Hill | 1.5% | 4.2%(-2.66)#67 | 4.5%(-2.97)#2,447 |
| 68. | Laddonia | 1.5% | 4.2%(-2.66)#68 | 4.5%(-2.97)#2,453 |
| 69. | Eureka | 1.5% | 4.2%(-2.66)#69 | 4.5%(-2.97)#2,465 |
| 70. | O Fallon | 1.5% | 4.2%(-2.63)#70 | 4.5%(-2.93)#2,555 |
| 71. | Sappington | 1.5% | 4.2%(-2.63)#71 | 4.5%(-2.93)#2,556 |
| 72. | Valley Park | 1.6% | 4.2%(-2.61)#72 | 4.5%(-2.91)#2,611 |
| 73. | Green Ridge | 1.6% | 4.2%(-2.58)#73 | 4.5%(-2.89)#2,669 |
| 74. | Mexico | 1.6% | 4.2%(-2.58)#74 | 4.5%(-2.88)#2,686 |
| 75. | Ava | 1.6% | 4.2%(-2.58)#75 | 4.5%(-2.88)#2,689 |
| 76. | Indian Point | 1.6% | 4.2%(-2.57)#76 | 4.5%(-2.87)#2,713 |
| 77. | Blue Eye | 1.6% | 4.2%(-2.57)#77 | 4.5%(-2.87)#2,715 |
| 78. | Cooter | 1.6% | 4.2%(-2.57)#78 | 4.5%(-2.87)#2,717 |
| 79. | Wildwood | 1.6% | 4.2%(-2.57)#79 | 4.5%(-2.87)#2,729 |
| 80. | Mendon | 1.6% | 4.2%(-2.54)#80 | 4.5%(-2.85)#2,793 |
| 81. | Murphy | 1.6% | 4.2%(-2.54)#81 | 4.5%(-2.84)#2,806 |
| 82. | Pineville | 1.6% | 4.2%(-2.54)#82 | 4.5%(-2.84)#2,810 |
| 83. | Ballwin | 1.6% | 4.2%(-2.53)#83 | 4.5%(-2.84)#2,813 |
| 84. | Dardenne Prairie | 1.6% | 4.2%(-2.52)#84 | 4.5%(-2.83)#2,842 |
| 85. | Oakville | 1.6% | 4.2%(-2.52)#85 | 4.5%(-2.82)#2,851 |
| 86. | Harrisburg | 1.6% | 4.2%(-2.52)#86 | 4.5%(-2.82)#2,866 |
| 87. | Wilbur Park | 1.6% | 4.2%(-2.52)#87 | 4.5%(-2.82)#2,867 |
| 88. | St Charles | 1.7% | 4.2%(-2.50)#88 | 4.5%(-2.81)#2,900 |
| 89. | Walnut Grove | 1.7% | 4.2%(-2.50)#89 | 4.5%(-2.81)#2,910 |
| 90. | Bel Nor | 1.7% | 4.2%(-2.45)#90 | 4.5%(-2.75)#3,032 |
| 91. | Warson Woods | 1.7% | 4.2%(-2.44)#91 | 4.5%(-2.75)#3,050 |
| 92. | Kirkwood | 1.8% | 4.2%(-2.41)#92 | 4.5%(-2.71)#3,140 |
| 93. | Holt | 1.8% | 4.2%(-2.40)#93 | 4.5%(-2.71)#3,150 |
| 94. | Bellefontaine Neighbors | 1.8% | 4.2%(-2.40)#94 | 4.5%(-2.70)#3,162 |
| 95. | Freeman | 1.8% | 4.2%(-2.39)#95 | 4.5%(-2.69)#3,190 |
| 96. | Washington | 1.8% | 4.2%(-2.38)#96 | 4.5%(-2.69)#3,206 |
| 97. | Chesterfield | 1.8% | 4.2%(-2.38)#97 | 4.5%(-2.68)#3,221 |
| 98. | Belle | 1.8% | 4.2%(-2.36)#98 | 4.5%(-2.66)#3,282 |
| 99. | St Peters | 1.8% | 4.2%(-2.35)#99 | 4.5%(-2.66)#3,290 |
| 100. | Paris | 1.8% | 4.2%(-2.35)#100 | 4.5%(-2.65)#3,303 |
Common Questions
What are the Top 10 Cities with the Lowest Poverty Level Among Married Couples in Missouri?
Top 10 Cities with the Lowest Poverty Level Among Married Couples in Missouri are:
#1
0.053%
#2
0.29%
#3
0.31%
#4
0.34%
#5
0.34%
#6
0.39%
#7
0.47%
#8
0.48%
#9
0.48%
#10
0.60%
What city has the Lowest Poverty Level Among Married Couples in Missouri?
Concord has the Lowest Poverty Level Among Married Couples in Missouri with 0.053%.
What is the Poverty Level Among Married Couples in the State of Missouri?
Poverty Level Among Married Couples in Missouri is 4.2%.
What is the Poverty Level Among Married Couples in the United States?
Poverty Level Among Married Couples in the United States is 4.5%.