Cities with the Lowest Poverty Level Among Married Couples in Vermont
RELATED REPORTS & OPTIONS
Lowest Poverty | Married Couple
Vermont
Compare Cities
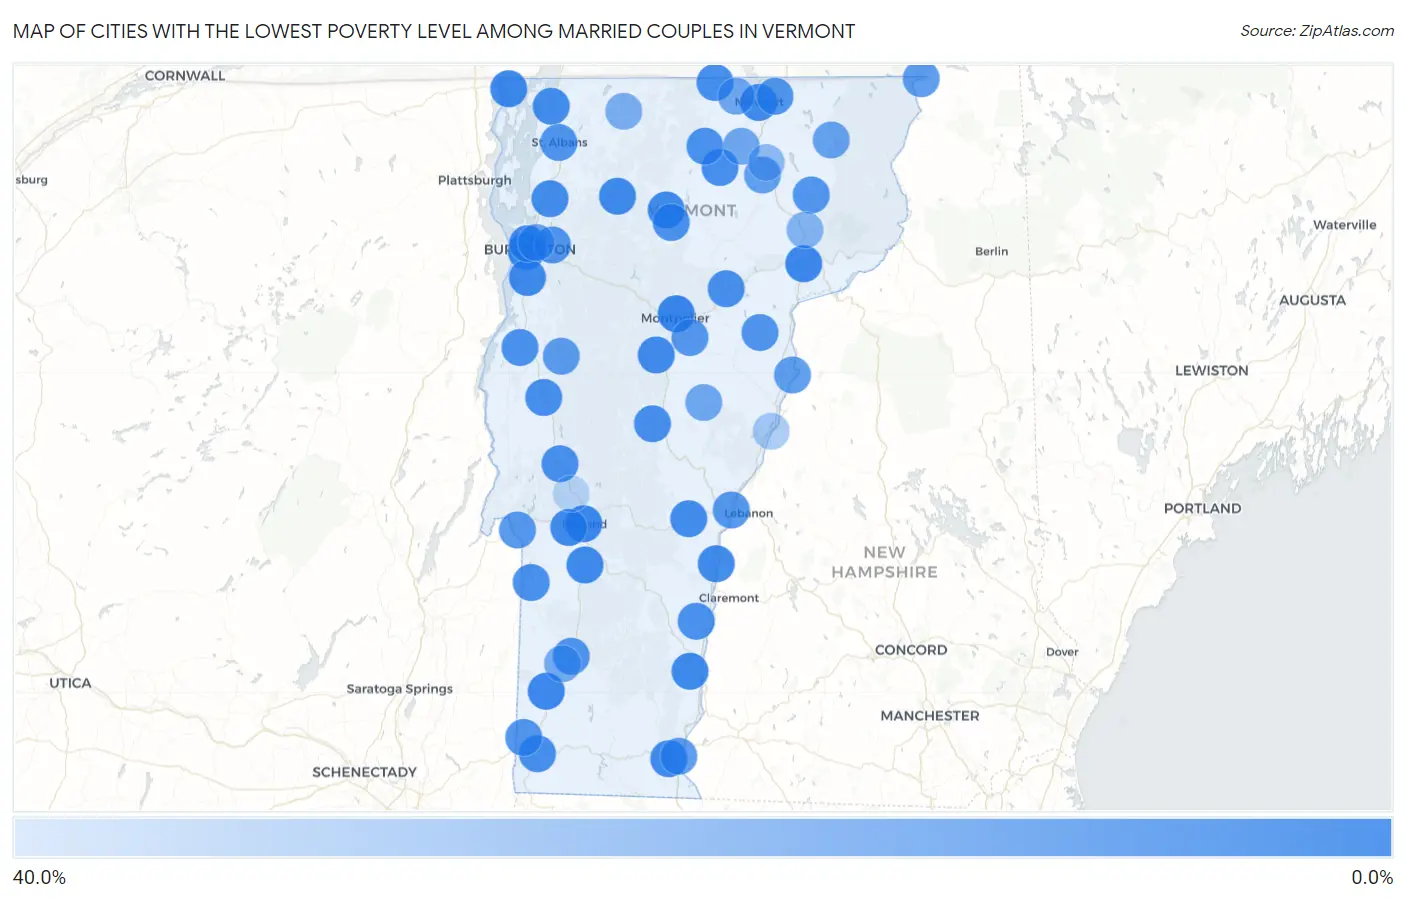
Map of Cities with the Lowest Poverty Level Among Married Couples in Vermont
40.0%
0.0%
Cities with the Lowest Poverty Level Among Married Couples in Vermont
| City | Married Couples Poverty | vs State | vs National | |
| 1. | Montpelier | 0.37% | 2.8%(-2.40)#1 | 4.5%(-4.10)#112 |
| 2. | South Burlington | 0.79% | 2.8%(-1.98)#2 | 4.5%(-3.68)#714 |
| 3. | Rutland | 0.96% | 2.8%(-1.81)#3 | 4.5%(-3.50)#1,105 |
| 4. | St Johnsbury | 1.4% | 2.8%(-1.35)#4 | 4.5%(-3.05)#2,245 |
| 5. | Alburgh | 1.5% | 2.8%(-1.30)#5 | 4.5%(-2.99)#2,402 |
| 6. | Arlington | 1.6% | 2.8%(-1.20)#6 | 4.5%(-2.89)#2,657 |
| 7. | Jeffersonville | 1.8% | 2.8%(-0.984)#7 | 4.5%(-2.68)#3,234 |
| 8. | Saxtons River | 1.8% | 2.8%(-0.941)#8 | 4.5%(-2.63)#3,353 |
| 9. | Wallingford | 2.0% | 2.8%(-0.809)#9 | 4.5%(-2.50)#3,656 |
| 10. | Shelburne | 2.1% | 2.8%(-0.702)#10 | 4.5%(-2.39)#3,925 |
| 11. | Burlington | 2.1% | 2.8%(-0.684)#11 | 4.5%(-2.38)#3,994 |
| 12. | Hyde Park | 2.1% | 2.8%(-0.642)#12 | 4.5%(-2.33)#4,108 |
| 13. | Northfield | 2.5% | 2.8%(-0.296)#13 | 4.5%(-1.99)#5,008 |
| 14. | West Brattleboro | 2.6% | 2.8%(-0.219)#14 | 4.5%(-1.91)#5,197 |
| 15. | West Rutland | 2.8% | 2.8%(-0.008)#15 | 4.5%(-1.70)#5,716 |
| 16. | Windsor | 2.8% | 2.8%(+0.076)#16 | 4.5%(-1.62)#5,898 |
| 17. | Newport | 2.9% | 2.8%(+0.107)#17 | 4.5%(-1.59)#5,982 |
| 18. | Swanton | 2.9% | 2.8%(+0.165)#18 | 4.5%(-1.53)#6,102 |
| 19. | Woodstock | 3.2% | 2.8%(+0.421)#19 | 4.5%(-1.27)#6,698 |
| 20. | Stamford | 3.3% | 2.8%(+0.563)#20 | 4.5%(-1.13)#7,013 |
| 21. | Milton | 3.4% | 2.8%(+0.648)#21 | 4.5%(-1.04)#7,198 |
| 22. | North Troy | 3.6% | 2.8%(+0.844)#22 | 4.5%(-0.847)#7,647 |
| 23. | Bennington | 4.1% | 2.8%(+1.34)#23 | 4.5%(-0.355)#8,650 |
| 24. | Marshfield | 4.2% | 2.8%(+1.46)#24 | 4.5%(-0.237)#8,870 |
| 25. | Middlebury | 4.2% | 2.8%(+1.47)#25 | 4.5%(-0.223)#8,899 |
| 26. | Brandon | 4.3% | 2.8%(+1.55)#26 | 4.5%(-0.138)#9,025 |
| 27. | Albany | 4.3% | 2.8%(+1.58)#27 | 4.5%(-0.114)#9,088 |
| 28. | Randolph | 4.6% | 2.8%(+1.79)#28 | 4.5%(+0.096)#9,454 |
| 29. | Wells | 4.6% | 2.8%(+1.85)#29 | 4.5%(+0.153)#9,556 |
| 30. | Lowell | 4.9% | 2.8%(+2.11)#30 | 4.5%(+0.416)#10,002 |
| 31. | Morrisville | 4.9% | 2.8%(+2.13)#31 | 4.5%(+0.438)#10,028 |
| 32. | Springfield | 5.2% | 2.8%(+2.42)#32 | 4.5%(+0.731)#10,471 |
| 33. | Vergennes | 5.4% | 2.8%(+2.63)#33 | 4.5%(+0.938)#10,808 |
| 34. | St Albans | 6.4% | 2.8%(+3.59)#34 | 4.5%(+1.90)#12,121 |
| 35. | North Bennington | 6.6% | 2.8%(+3.81)#35 | 4.5%(+2.12)#12,396 |
| 36. | Groton | 6.6% | 2.8%(+3.84)#36 | 4.5%(+2.15)#12,442 |
| 37. | Manchester Center | 6.7% | 2.8%(+3.90)#37 | 4.5%(+2.20)#12,476 |
| 38. | Essex Junction | 6.7% | 2.8%(+3.97)#38 | 4.5%(+2.28)#12,589 |
| 39. | Derby Center | 6.9% | 2.8%(+4.13)#39 | 4.5%(+2.43)#12,745 |
| 40. | West Burke | 7.1% | 2.8%(+4.37)#40 | 4.5%(+2.68)#13,047 |
| 41. | White River Junction | 7.6% | 2.8%(+4.79)#41 | 4.5%(+3.10)#13,471 |
| 42. | Fair Haven | 8.3% | 2.8%(+5.48)#42 | 4.5%(+3.79)#14,096 |
| 43. | Barre | 8.5% | 2.8%(+5.71)#43 | 4.5%(+4.01)#14,292 |
| 44. | Brattleboro | 9.2% | 2.8%(+6.40)#44 | 4.5%(+4.71)#14,814 |
| 45. | Bristol | 9.2% | 2.8%(+6.43)#45 | 4.5%(+4.74)#14,836 |
| 46. | Beecher Falls | 9.4% | 2.8%(+6.60)#46 | 4.5%(+4.91)#14,965 |
| 47. | Danby | 9.8% | 2.8%(+6.99)#47 | 4.5%(+5.29)#15,217 |
| 48. | Newbury | 10.1% | 2.8%(+7.36)#48 | 4.5%(+5.66)#15,464 |
| 49. | Glover | 11.8% | 2.8%(+8.99)#49 | 4.5%(+7.30)#16,348 |
| 50. | Island Pond | 12.8% | 2.8%(+10.0)#50 | 4.5%(+8.34)#16,798 |
| 51. | Winooski | 14.1% | 2.8%(+11.3)#51 | 4.5%(+9.63)#17,257 |
| 52. | Irasburg | 14.8% | 2.8%(+12.0)#52 | 4.5%(+10.4)#17,500 |
| 53. | Newport Center | 15.0% | 2.8%(+12.2)#53 | 4.5%(+10.5)#17,551 |
| 54. | Chelsea | 15.1% | 2.8%(+12.3)#54 | 4.5%(+10.6)#17,565 |
| 55. | Manchester | 16.1% | 2.8%(+13.3)#55 | 4.5%(+11.6)#17,820 |
| 56. | Enosburg Falls | 17.6% | 2.8%(+14.8)#56 | 4.5%(+13.1)#18,136 |
| 57. | Lyndonville | 20.5% | 2.8%(+17.7)#57 | 4.5%(+16.0)#18,647 |
| 58. | Lunenburg | 21.2% | 2.8%(+18.4)#58 | 4.5%(+16.8)#18,747 |
| 59. | Barton | 23.3% | 2.8%(+20.6)#59 | 4.5%(+18.9)#19,005 |
| 60. | Algiers | 26.1% | 2.8%(+23.3)#60 | 4.5%(+21.6)#19,309 |
| 61. | Sheffield | 27.3% | 2.8%(+24.5)#61 | 4.5%(+22.8)#19,404 |
| 62. | Fairlee | 28.6% | 2.8%(+25.8)#62 | 4.5%(+24.1)#19,515 |
| 63. | Pittsford | 34.2% | 2.8%(+31.5)#63 | 4.5%(+29.8)#19,795 |
1
2Common Questions
What are the Top 10 Cities with the Lowest Poverty Level Among Married Couples in Vermont?
Top 10 Cities with the Lowest Poverty Level Among Married Couples in Vermont are:
#1
0.0%
#2
0.0%
#3
0.0%
#4
0.0%
#5
0.0%
#6
0.0%
#7
0.0%
#8
0.0%
#9
0.0%
#10
0.0%
What city has the Lowest Poverty Level Among Married Couples in Vermont?
Montpelier has the Lowest Poverty Level Among Married Couples in Vermont with 0.37%.
What is the Poverty Level Among Married Couples in the State of Vermont?
Poverty Level Among Married Couples in Vermont is 2.8%.
What is the Poverty Level Among Married Couples in the United States?
Poverty Level Among Married Couples in the United States is 4.5%.