Cities with the Lowest Poverty Level Among Married Couples in Ohio
RELATED REPORTS & OPTIONS
Lowest Poverty | Married Couple
Ohio
Compare Cities
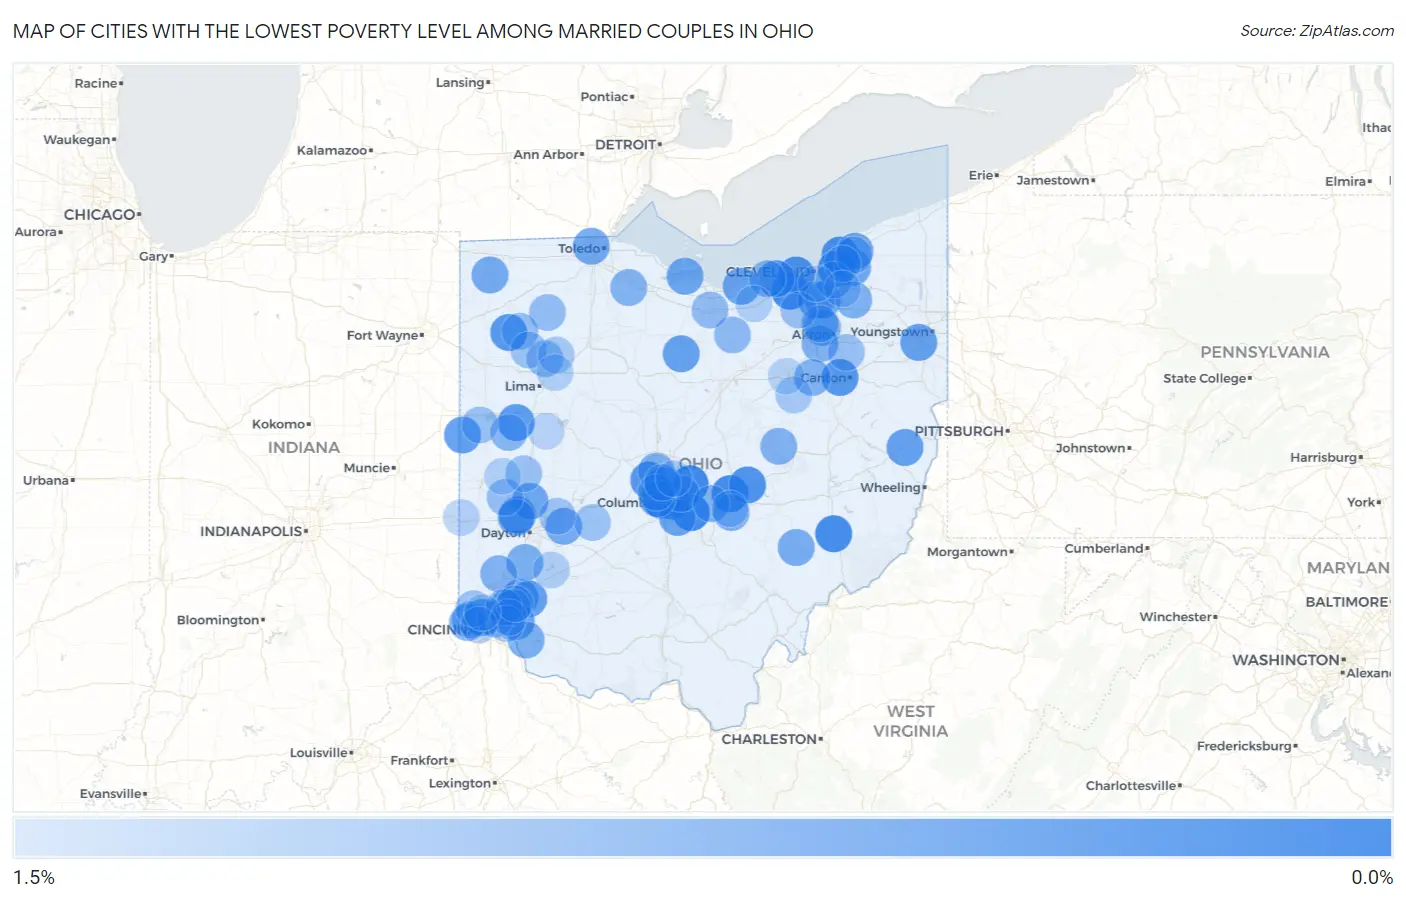
Map of Cities with the Lowest Poverty Level Among Married Couples in Ohio
1.5%
0.0%
Cities with the Lowest Poverty Level Among Married Couples in Ohio
| City | Married Couples Poverty | vs State | vs National | |
| 1. | Grandview Heights | 0.14% | 3.7%(-3.52)#1 | 4.5%(-4.32)#17 |
| 2. | New Albany | 0.22% | 3.7%(-3.44)#2 | 4.5%(-4.25)#37 |
| 3. | Pickerington | 0.24% | 3.7%(-3.42)#3 | 4.5%(-4.23)#43 |
| 4. | Heath | 0.25% | 3.7%(-3.41)#4 | 4.5%(-4.21)#47 |
| 5. | Caldwell | 0.26% | 3.7%(-3.40)#5 | 4.5%(-4.20)#53 |
| 6. | Olmsted Falls | 0.27% | 3.7%(-3.39)#6 | 4.5%(-4.19)#54 |
| 7. | Wickliffe | 0.31% | 3.7%(-3.35)#7 | 4.5%(-4.16)#70 |
| 8. | Lyndhurst | 0.31% | 3.7%(-3.35)#8 | 4.5%(-4.15)#73 |
| 9. | Rocky River | 0.34% | 3.7%(-3.32)#9 | 4.5%(-4.12)#91 |
| 10. | Hanover | 0.35% | 3.7%(-3.31)#10 | 4.5%(-4.12)#99 |
| 11. | Oakwood | 0.42% | 3.7%(-3.24)#11 | 4.5%(-4.04)#166 |
| 12. | Dublin | 0.42% | 3.7%(-3.24)#12 | 4.5%(-4.04)#167 |
| 13. | Avon | 0.42% | 3.7%(-3.24)#13 | 4.5%(-4.04)#168 |
| 14. | Perry Heights | 0.42% | 3.7%(-3.24)#14 | 4.5%(-4.04)#171 |
| 15. | New Knoxville | 0.45% | 3.7%(-3.21)#15 | 4.5%(-4.01)#191 |
| 16. | Bexley | 0.49% | 3.7%(-3.17)#16 | 4.5%(-3.97)#231 |
| 17. | Clayton | 0.51% | 3.7%(-3.15)#17 | 4.5%(-3.95)#256 |
| 18. | Fort Recovery | 0.51% | 3.7%(-3.15)#18 | 4.5%(-3.95)#257 |
| 19. | Hopedale | 0.53% | 3.7%(-3.13)#19 | 4.5%(-3.94)#275 |
| 20. | Landen | 0.54% | 3.7%(-3.12)#20 | 4.5%(-3.93)#284 |
| 21. | Maineville | 0.54% | 3.7%(-3.12)#21 | 4.5%(-3.92)#292 |
| 22. | Terrace Park | 0.55% | 3.7%(-3.11)#22 | 4.5%(-3.91)#308 |
| 23. | Monfort Heights | 0.55% | 3.7%(-3.10)#23 | 4.5%(-3.91)#313 |
| 24. | Canfield | 0.56% | 3.7%(-3.10)#24 | 4.5%(-3.90)#319 |
| 25. | New Washington | 0.56% | 3.7%(-3.10)#25 | 4.5%(-3.90)#321 |
| 26. | Groveport | 0.57% | 3.7%(-3.09)#26 | 4.5%(-3.89)#342 |
| 27. | Vermilion | 0.58% | 3.7%(-3.08)#27 | 4.5%(-3.88)#355 |
| 28. | Bay View | 0.60% | 3.7%(-3.06)#28 | 4.5%(-3.86)#374 |
| 29. | Gahanna | 0.60% | 3.7%(-3.06)#29 | 4.5%(-3.86)#375 |
| 30. | Tipp City | 0.63% | 3.7%(-3.03)#30 | 4.5%(-3.84)#412 |
| 31. | Chesterland | 0.63% | 3.7%(-3.03)#31 | 4.5%(-3.83)#414 |
| 32. | Kirtland Hills | 0.63% | 3.7%(-3.03)#32 | 4.5%(-3.83)#420 |
| 33. | Blue Ash | 0.64% | 3.7%(-3.02)#33 | 4.5%(-3.83)#423 |
| 34. | Broadview Heights | 0.64% | 3.7%(-3.02)#34 | 4.5%(-3.82)#430 |
| 35. | Bryan | 0.66% | 3.7%(-3.00)#35 | 4.5%(-3.81)#448 |
| 36. | Ottawa Hills | 0.67% | 3.7%(-2.99)#36 | 4.5%(-3.79)#473 |
| 37. | Yellow Springs | 0.67% | 3.7%(-2.99)#37 | 4.5%(-3.79)#484 |
| 38. | Montgomery | 0.68% | 3.7%(-2.98)#38 | 4.5%(-3.78)#499 |
| 39. | Mcconnelsville | 0.69% | 3.7%(-2.97)#39 | 4.5%(-3.77)#512 |
| 40. | Brecksville | 0.70% | 3.7%(-2.95)#40 | 4.5%(-3.76)#532 |
| 41. | Englewood | 0.71% | 3.7%(-2.95)#41 | 4.5%(-3.75)#540 |
| 42. | Fairlawn | 0.73% | 3.7%(-2.93)#42 | 4.5%(-3.73)#582 |
| 43. | Powell | 0.73% | 3.7%(-2.93)#43 | 4.5%(-3.73)#583 |
| 44. | Springboro | 0.75% | 3.7%(-2.91)#44 | 4.5%(-3.72)#609 |
| 45. | North Bend | 0.75% | 3.7%(-2.90)#45 | 4.5%(-3.71)#631 |
| 46. | Riverlea | 0.76% | 3.7%(-2.89)#46 | 4.5%(-3.70)#654 |
| 47. | Amelia | 0.77% | 3.7%(-2.89)#47 | 4.5%(-3.70)#660 |
| 48. | Aurora | 0.77% | 3.7%(-2.89)#48 | 4.5%(-3.69)#675 |
| 49. | Norton | 0.78% | 3.7%(-2.88)#49 | 4.5%(-3.69)#684 |
| 50. | Marble Cliff | 0.79% | 3.7%(-2.87)#50 | 4.5%(-3.67)#733 |
| 51. | Warsaw | 0.79% | 3.7%(-2.86)#51 | 4.5%(-3.67)#743 |
| 52. | Dalton | 0.80% | 3.7%(-2.86)#52 | 4.5%(-3.66)#749 |
| 53. | Trenton | 0.80% | 3.7%(-2.86)#53 | 4.5%(-3.66)#750 |
| 54. | Thornville | 0.80% | 3.7%(-2.86)#54 | 4.5%(-3.66)#752 |
| 55. | Gibsonburg | 0.81% | 3.7%(-2.85)#55 | 4.5%(-3.65)#779 |
| 56. | Kirkersville | 0.81% | 3.7%(-2.85)#56 | 4.5%(-3.65)#782 |
| 57. | Miami Heights | 0.83% | 3.7%(-2.83)#57 | 4.5%(-3.64)#811 |
| 58. | Montrose Ghent | 0.84% | 3.7%(-2.82)#58 | 4.5%(-3.62)#841 |
| 59. | New Bremen | 0.84% | 3.7%(-2.82)#59 | 4.5%(-3.62)#848 |
| 60. | Warrensville Heights | 0.86% | 3.7%(-2.80)#60 | 4.5%(-3.60)#880 |
| 61. | Sheffield | 0.87% | 3.7%(-2.79)#61 | 4.5%(-3.59)#905 |
| 62. | Upper Arlington | 0.87% | 3.7%(-2.79)#62 | 4.5%(-3.59)#907 |
| 63. | Worthington | 0.88% | 3.7%(-2.77)#63 | 4.5%(-3.58)#924 |
| 64. | St Bernard | 0.91% | 3.7%(-2.75)#64 | 4.5%(-3.55)#975 |
| 65. | New London | 0.91% | 3.7%(-2.75)#65 | 4.5%(-3.55)#977 |
| 66. | Norwalk | 0.92% | 3.7%(-2.74)#66 | 4.5%(-3.54)#996 |
| 67. | Columbus Grove | 0.93% | 3.7%(-2.73)#67 | 4.5%(-3.53)#1,027 |
| 68. | Hamler | 0.95% | 3.7%(-2.71)#68 | 4.5%(-3.51)#1,088 |
| 69. | Kirtland | 0.97% | 3.7%(-2.69)#69 | 4.5%(-3.49)#1,141 |
| 70. | Laura | 0.98% | 3.7%(-2.68)#70 | 4.5%(-3.48)#1,157 |
| 71. | Continental | 0.99% | 3.7%(-2.67)#71 | 4.5%(-3.48)#1,174 |
| 72. | Uniontown | 1.00% | 3.7%(-2.66)#72 | 4.5%(-3.47)#1,197 |
| 73. | Brunswick | 1.0% | 3.7%(-2.66)#73 | 4.5%(-3.46)#1,215 |
| 74. | Coldwater | 1.0% | 3.7%(-2.65)#74 | 4.5%(-3.45)#1,230 |
| 75. | Taylor Creek | 1.0% | 3.7%(-2.64)#75 | 4.5%(-3.45)#1,238 |
| 76. | Piqua | 1.0% | 3.7%(-2.63)#76 | 4.5%(-3.44)#1,268 |
| 77. | Kalida | 1.0% | 3.7%(-2.62)#77 | 4.5%(-3.42)#1,297 |
| 78. | South Charleston | 1.0% | 3.7%(-2.61)#78 | 4.5%(-3.42)#1,312 |
| 79. | Evendale | 1.1% | 3.7%(-2.61)#79 | 4.5%(-3.41)#1,325 |
| 80. | Green Meadows | 1.1% | 3.7%(-2.59)#80 | 4.5%(-3.40)#1,350 |
| 81. | Fairfax | 1.1% | 3.7%(-2.59)#81 | 4.5%(-3.39)#1,369 |
| 82. | Fredericksburg | 1.1% | 3.7%(-2.55)#82 | 4.5%(-3.35)#1,455 |
| 83. | Westerville | 1.1% | 3.7%(-2.53)#83 | 4.5%(-3.33)#1,494 |
| 84. | Mayfield | 1.1% | 3.7%(-2.53)#84 | 4.5%(-3.33)#1,499 |
| 85. | Pandora | 1.1% | 3.7%(-2.52)#85 | 4.5%(-3.33)#1,516 |
| 86. | Thornport | 1.1% | 3.7%(-2.52)#86 | 4.5%(-3.32)#1,530 |
| 87. | Madeira | 1.2% | 3.7%(-2.51)#87 | 4.5%(-3.31)#1,564 |
| 88. | Solon | 1.2% | 3.7%(-2.48)#88 | 4.5%(-3.29)#1,614 |
| 89. | Covedale | 1.2% | 3.7%(-2.48)#89 | 4.5%(-3.28)#1,633 |
| 90. | Harveysburg | 1.2% | 3.7%(-2.47)#90 | 4.5%(-3.28)#1,638 |
| 91. | Oberlin | 1.2% | 3.7%(-2.46)#91 | 4.5%(-3.27)#1,672 |
| 92. | Beaverdam | 1.2% | 3.7%(-2.45)#92 | 4.5%(-3.26)#1,699 |
| 93. | Bradford | 1.2% | 3.7%(-2.45)#93 | 4.5%(-3.25)#1,707 |
| 94. | Reedurban | 1.2% | 3.7%(-2.45)#94 | 4.5%(-3.25)#1,708 |
| 95. | New Paris | 1.2% | 3.7%(-2.44)#95 | 4.5%(-3.24)#1,727 |
| 96. | Brooklyn Heights | 1.2% | 3.7%(-2.42)#96 | 4.5%(-3.23)#1,764 |
| 97. | Wooster | 1.3% | 3.7%(-2.40)#97 | 4.5%(-3.21)#1,803 |
| 98. | Jackson Center | 1.3% | 3.7%(-2.40)#98 | 4.5%(-3.20)#1,819 |
| 99. | Sixteen Mile Stand | 1.3% | 3.7%(-2.40)#99 | 4.5%(-3.20)#1,822 |
| 100. | White Oak | 1.3% | 3.7%(-2.40)#100 | 4.5%(-3.20)#1,823 |
Common Questions
What are the Top 10 Cities with the Lowest Poverty Level Among Married Couples in Ohio?
Top 10 Cities with the Lowest Poverty Level Among Married Couples in Ohio are:
#1
0.14%
#2
0.22%
#3
0.24%
#4
0.25%
#5
0.26%
#6
0.27%
#7
0.31%
#8
0.31%
#9
0.34%
#10
0.35%
What city has the Lowest Poverty Level Among Married Couples in Ohio?
Grandview Heights has the Lowest Poverty Level Among Married Couples in Ohio with 0.14%.
What is the Poverty Level Among Married Couples in the State of Ohio?
Poverty Level Among Married Couples in Ohio is 3.7%.
What is the Poverty Level Among Married Couples in the United States?
Poverty Level Among Married Couples in the United States is 4.5%.