Cities with the Lowest Poverty Level Among Married Couples in the United States
RELATED REPORTS & OPTIONS
Lowest Poverty | Married Couple
United States
Compare Cities
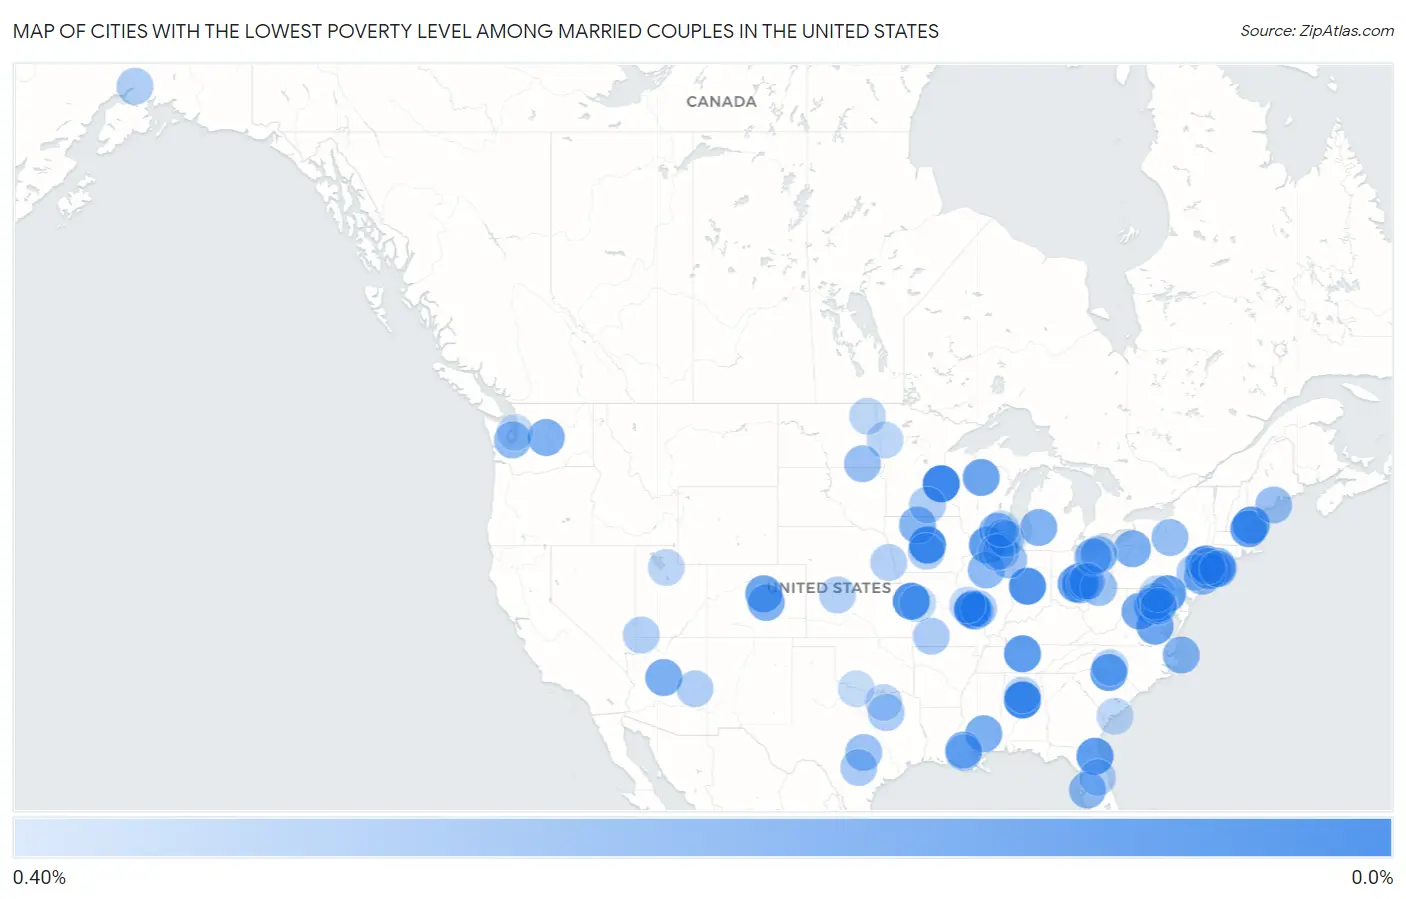
Map of Cities with the Lowest Poverty Level Among Married Couples in the United States
0.40%
0.0%
Cities with the Lowest Poverty Level Among Married Couples in the United States
| City | Married Couples Poverty | vs State | vs National | |
| 1. | New Richmond | 0.051% | 3.0%(-3.00)#1 | 4.5%(-4.41)#1 |
| 2. | Concord | 0.053% | 4.2%(-4.10)#1 | 4.5%(-4.41)#2 |
| 3. | Homewood | 0.063% | 5.1%(-5.00)#1 | 4.5%(-4.40)#3 |
| 4. | Nevada | 0.075% | 3.2%(-3.08)#1 | 4.5%(-4.39)#4 |
| 5. | Pittsboro | 0.093% | 3.7%(-3.63)#1 | 4.5%(-4.37)#5 |
| 6. | Mission Hills | 0.096% | 3.9%(-3.76)#1 | 4.5%(-4.37)#6 |
| 7. | Media Borough | 0.10% | 3.5%(-3.36)#1 | 4.5%(-4.36)#7 |
| 8. | Conshohocken Borough | 0.12% | 3.5%(-3.35)#2 | 4.5%(-4.35)#8 |
| 9. | Portsmouth | 0.12% | 2.1%(-1.96)#1 | 4.5%(-4.34)#9 |
| 10. | Belle Meade | 0.13% | 4.9%(-4.74)#1 | 4.5%(-4.34)#10 |
| 11. | Oregon | 0.13% | 3.8%(-3.63)#1 | 4.5%(-4.33)#11 |
| 12. | Farmingdale | 0.13% | 5.3%(-5.17)#1 | 4.5%(-4.33)#12 |
| 13. | Asbury Lake | 0.13% | 5.4%(-5.24)#1 | 4.5%(-4.33)#13 |
| 14. | Lutherville | 0.13% | 3.0%(-2.90)#1 | 4.5%(-4.33)#14 |
| 15. | Ridgewood | 0.13% | 3.4%(-3.30)#1 | 4.5%(-4.33)#15 |
| 16. | Weddington | 0.14% | 4.5%(-4.35)#1 | 4.5%(-4.32)#16 |
| 17. | Grandview Heights | 0.14% | 3.7%(-3.52)#1 | 4.5%(-4.32)#17 |
| 18. | New Baltimore | 0.14% | 3.2%(-3.06)#1 | 4.5%(-4.32)#18 |
| 19. | Amesbury Town | 0.15% | 3.0%(-2.81)#1 | 4.5%(-4.31)#19 |
| 20. | Tomahawk | 0.16% | 3.0%(-2.89)#2 | 4.5%(-4.30)#20 |
| 21. | Laurel | 0.16% | 3.2%(-3.05)#2 | 4.5%(-4.30)#21 |
| 22. | Roxborough Park | 0.16% | 3.2%(-3.05)#1 | 4.5%(-4.30)#22 |
| 23. | Oakland Borough | 0.16% | 3.4%(-3.27)#2 | 4.5%(-4.30)#23 |
| 24. | Shenandoah | 0.18% | 3.2%(-3.03)#3 | 4.5%(-4.28)#24 |
| 25. | Clarkdale | 0.19% | 5.2%(-5.04)#1 | 4.5%(-4.28)#25 |
| 26. | Sumrall | 0.19% | 6.0%(-5.82)#1 | 4.5%(-4.27)#26 |
| 27. | Warren | 0.20% | 3.5%(-3.27)#3 | 4.5%(-4.27)#27 |
| 28. | Denham Springs | 0.20% | 5.7%(-5.48)#1 | 4.5%(-4.26)#28 |
| 29. | Walker | 0.20% | 4.2%(-3.97)#1 | 4.5%(-4.26)#29 |
| 30. | East Wenatchee | 0.20% | 3.3%(-3.08)#1 | 4.5%(-4.26)#30 |
| 31. | Air Force Academy | 0.20% | 3.2%(-3.01)#2 | 4.5%(-4.26)#31 |
| 32. | St James | 0.21% | 5.3%(-5.09)#2 | 4.5%(-4.26)#32 |
| 33. | Lauderdale Lakes | 0.21% | 3.0%(-2.84)#3 | 4.5%(-4.25)#33 |
| 34. | Kill Devil Hills | 0.21% | 4.5%(-4.28)#2 | 4.5%(-4.25)#34 |
| 35. | Newtown Borough | 0.21% | 2.9%(-2.71)#1 | 4.5%(-4.25)#35 |
| 36. | Algona | 0.21% | 3.2%(-2.94)#2 | 4.5%(-4.25)#36 |
| 37. | New Albany | 0.22% | 3.7%(-3.44)#2 | 4.5%(-4.25)#37 |
| 38. | Strathmore | 0.22% | 3.4%(-3.21)#3 | 4.5%(-4.24)#38 |
| 39. | Seffner | 0.22% | 5.4%(-5.15)#2 | 4.5%(-4.24)#39 |
| 40. | Tappan | 0.23% | 5.3%(-5.07)#3 | 4.5%(-4.24)#40 |
| 41. | Washington | 0.23% | 3.8%(-3.53)#2 | 4.5%(-4.23)#41 |
| 42. | Dunn Loring | 0.23% | 3.2%(-2.97)#4 | 4.5%(-4.23)#42 |
| 43. | Pickerington | 0.24% | 3.7%(-3.42)#3 | 4.5%(-4.23)#43 |
| 44. | Artondale | 0.24% | 3.3%(-3.05)#2 | 4.5%(-4.22)#44 |
| 45. | Columbia | 0.24% | 3.8%(-3.52)#3 | 4.5%(-4.22)#45 |
| 46. | Haddon Heights Borough | 0.25% | 3.4%(-3.18)#4 | 4.5%(-4.22)#46 |
| 47. | Heath | 0.25% | 3.7%(-3.41)#4 | 4.5%(-4.21)#47 |
| 48. | Ithaca | 0.25% | 5.3%(-5.05)#4 | 4.5%(-4.21)#48 |
| 49. | Oakes | 0.25% | 3.2%(-2.98)#1 | 4.5%(-4.21)#49 |
| 50. | Thomaston | 0.26% | 3.2%(-2.92)#1 | 4.5%(-4.21)#50 |
| 51. | Bee Cave | 0.26% | 5.9%(-5.67)#1 | 4.5%(-4.21)#51 |
| 52. | Manteno | 0.26% | 3.8%(-3.50)#4 | 4.5%(-4.20)#52 |
| 53. | Caldwell | 0.26% | 3.7%(-3.40)#5 | 4.5%(-4.20)#53 |
| 54. | Olmsted Falls | 0.27% | 3.7%(-3.39)#6 | 4.5%(-4.19)#54 |
| 55. | Broadlands | 0.27% | 3.2%(-2.93)#5 | 4.5%(-4.19)#55 |
| 56. | Spring Grove | 0.27% | 3.8%(-3.49)#5 | 4.5%(-4.19)#56 |
| 57. | Oswego | 0.27% | 3.8%(-3.49)#6 | 4.5%(-4.19)#57 |
| 58. | China Grove | 0.29% | 5.9%(-5.64)#2 | 4.5%(-4.17)#58 |
| 59. | Fremont Hills | 0.29% | 4.2%(-3.87)#2 | 4.5%(-4.17)#59 |
| 60. | North Patchogue | 0.29% | 5.3%(-5.00)#5 | 4.5%(-4.17)#60 |
| 61. | Talty | 0.29% | 5.9%(-5.64)#3 | 4.5%(-4.17)#61 |
| 62. | Bradley Gardens | 0.29% | 3.4%(-3.14)#5 | 4.5%(-4.17)#62 |
| 63. | Woodmere | 0.29% | 5.3%(-5.00)#6 | 4.5%(-4.17)#63 |
| 64. | Gateway | 0.30% | 3.7%(-3.36)#1 | 4.5%(-4.16)#64 |
| 65. | Waseca | 0.30% | 2.6%(-2.27)#1 | 4.5%(-4.16)#65 |
| 66. | Pinetop Country Club | 0.30% | 5.2%(-4.92)#2 | 4.5%(-4.16)#66 |
| 67. | Gurnee | 0.30% | 3.8%(-3.46)#7 | 4.5%(-4.16)#67 |
| 68. | Mount Plymouth | 0.30% | 5.4%(-5.07)#3 | 4.5%(-4.16)#68 |
| 69. | Ankeny | 0.30% | 3.2%(-2.85)#3 | 4.5%(-4.16)#69 |
| 70. | Wickliffe | 0.31% | 3.7%(-3.35)#7 | 4.5%(-4.16)#70 |
| 71. | Prairieville | 0.31% | 5.7%(-5.37)#2 | 4.5%(-4.16)#71 |
| 72. | Webster Groves | 0.31% | 4.2%(-3.85)#3 | 4.5%(-4.16)#72 |
| 73. | Lyndhurst | 0.31% | 3.7%(-3.35)#8 | 4.5%(-4.15)#73 |
| 74. | O Fallon | 0.31% | 3.8%(-3.45)#8 | 4.5%(-4.15)#74 |
| 75. | Hill City | 0.31% | 3.9%(-3.54)#2 | 4.5%(-4.15)#75 |
| 76. | Gretna | 0.31% | 3.3%(-2.99)#1 | 4.5%(-4.15)#76 |
| 77. | Santa Clara | 0.31% | 3.8%(-3.44)#1 | 4.5%(-4.15)#77 |
| 78. | Green Valley | 0.31% | 3.0%(-2.71)#2 | 4.5%(-4.15)#78 |
| 79. | Ada | 0.32% | 2.6%(-2.25)#2 | 4.5%(-4.14)#79 |
| 80. | Melissa | 0.33% | 5.9%(-5.61)#4 | 4.5%(-4.14)#80 |
| 81. | North Salt Lake | 0.33% | 3.8%(-3.43)#2 | 4.5%(-4.14)#81 |
| 82. | Morris | 0.33% | 5.1%(-4.74)#2 | 4.5%(-4.14)#82 |
| 83. | Park River | 0.33% | 3.2%(-2.90)#2 | 4.5%(-4.14)#83 |
| 84. | Lake Holiday | 0.33% | 3.8%(-3.43)#9 | 4.5%(-4.13)#84 |
| 85. | Pelham | 0.33% | 5.3%(-4.97)#7 | 4.5%(-4.13)#85 |
| 86. | Bohemia | 0.33% | 5.3%(-4.97)#8 | 4.5%(-4.13)#86 |
| 87. | Picacho Hills | 0.33% | 7.7%(-7.41)#1 | 4.5%(-4.13)#87 |
| 88. | Edisto Beach | 0.33% | 4.6%(-4.28)#1 | 4.5%(-4.13)#88 |
| 89. | Harrisburg | 0.33% | 4.5%(-4.15)#3 | 4.5%(-4.13)#89 |
| 90. | Westmont | 0.34% | 3.4%(-3.09)#6 | 4.5%(-4.12)#90 |
| 91. | Rocky River | 0.34% | 3.7%(-3.32)#9 | 4.5%(-4.12)#91 |
| 92. | Linganore | 0.34% | 3.0%(-2.69)#3 | 4.5%(-4.12)#92 |
| 93. | South Run | 0.34% | 3.2%(-2.87)#6 | 4.5%(-4.12)#93 |
| 94. | St Paul | 0.34% | 4.2%(-3.82)#4 | 4.5%(-4.12)#94 |
| 95. | Bainbridge Island | 0.34% | 3.3%(-2.94)#3 | 4.5%(-4.12)#95 |
| 96. | Essex Fells Borough | 0.34% | 3.4%(-3.09)#7 | 4.5%(-4.12)#96 |
| 97. | Lone Jack | 0.34% | 4.2%(-3.81)#5 | 4.5%(-4.12)#97 |
| 98. | Mukwonago | 0.34% | 3.0%(-2.70)#4 | 4.5%(-4.12)#98 |
| 99. | Hanover | 0.35% | 3.7%(-3.31)#10 | 4.5%(-4.12)#99 |
| 100. | Burkburnett | 0.35% | 5.9%(-5.58)#5 | 4.5%(-4.12)#100 |
Common Questions
What are the Top 10 Cities with the Lowest Poverty Level Among Married Couples in the United States?
Top 10 Cities with the Lowest Poverty Level Among Married Couples in the United States are:
#1
0.051%
#2
0.053%
#3
0.063%
#4
0.075%
#5
0.093%
#6
0.096%
#7
0.12%
#8
0.13%
#9
0.13%
#10
0.13%
What city has the Lowest Poverty Level Among Married Couples in the United States?
New Richmond has the Lowest Poverty Level Among Married Couples in the United States with 0.051%.
What is the Poverty Level Among Married Couples in the United States?
Poverty Level Among Married Couples in the United States is 4.5%.