Cities with the Lowest Poverty Level Among Married Couples in Indiana
RELATED REPORTS & OPTIONS
Lowest Poverty | Married Couple
Indiana
Compare Cities
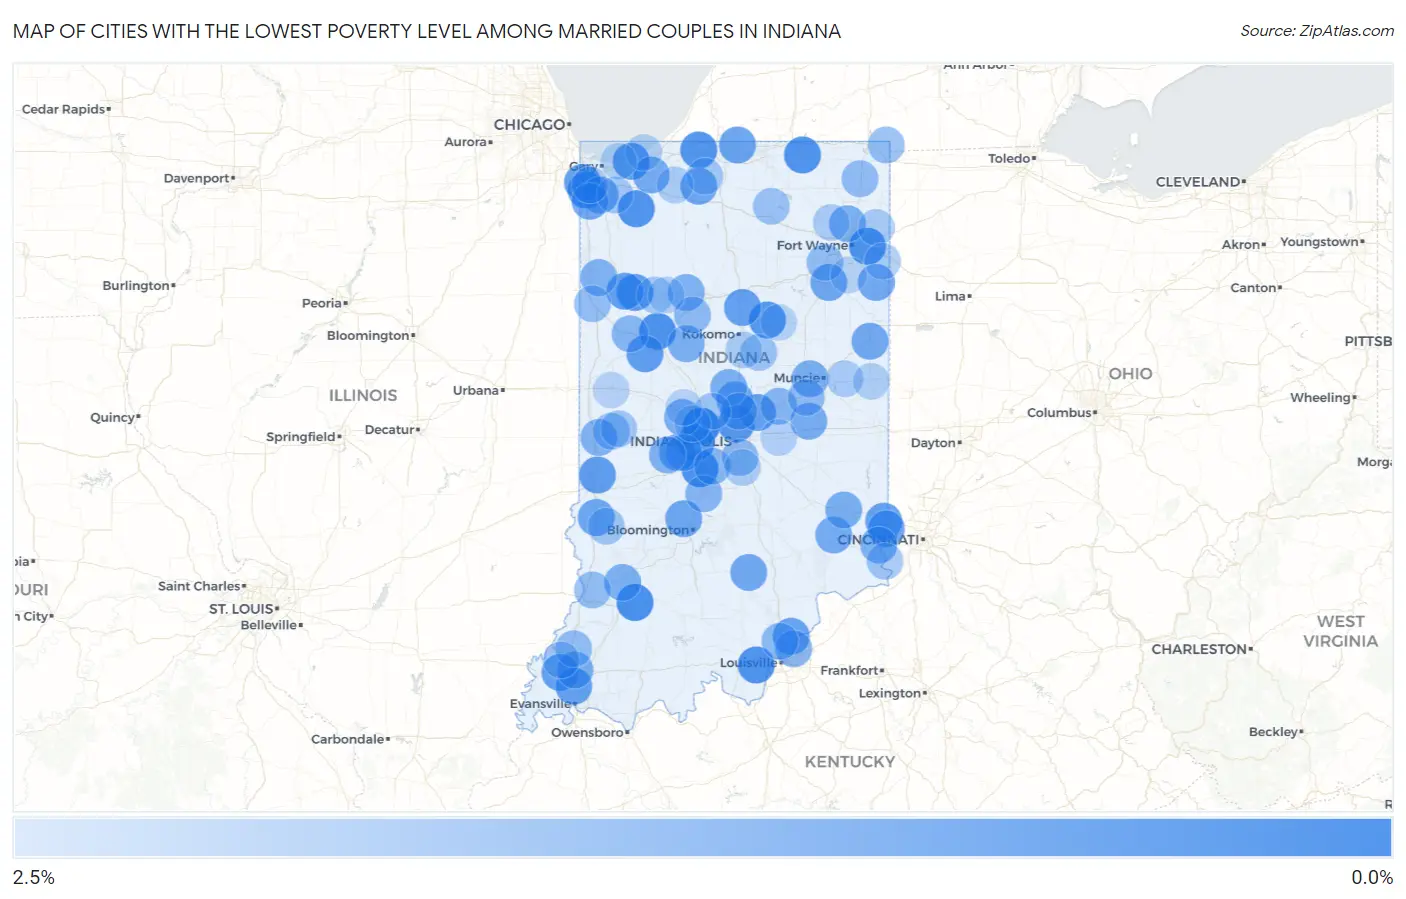
Map of Cities with the Lowest Poverty Level Among Married Couples in Indiana
2.5%
0.0%
Cities with the Lowest Poverty Level Among Married Couples in Indiana
| City | Married Couples Poverty | vs State | vs National | |
| 1. | Pittsboro | 0.093% | 3.7%(-3.63)#1 | 4.5%(-4.37)#5 |
| 2. | Monrovia | 0.35% | 3.7%(-3.37)#2 | 4.5%(-4.11)#102 |
| 3. | Montgomery | 0.35% | 3.7%(-3.37)#3 | 4.5%(-4.11)#106 |
| 4. | St John | 0.38% | 3.7%(-3.35)#4 | 4.5%(-4.09)#122 |
| 5. | Battle Ground | 0.41% | 3.7%(-3.31)#5 | 4.5%(-4.05)#154 |
| 6. | New Haven | 0.43% | 3.7%(-3.29)#6 | 4.5%(-4.03)#178 |
| 7. | Lanesville | 0.45% | 3.7%(-3.27)#7 | 4.5%(-4.01)#199 |
| 8. | Shipshewana | 0.45% | 3.7%(-3.27)#8 | 4.5%(-4.01)#200 |
| 9. | Kouts | 0.46% | 3.7%(-3.27)#9 | 4.5%(-4.01)#201 |
| 10. | New Carlisle | 0.51% | 3.7%(-3.21)#10 | 4.5%(-3.95)#259 |
| 11. | Converse | 0.54% | 3.7%(-3.18)#11 | 4.5%(-3.92)#293 |
| 12. | Meridian Hills | 0.59% | 3.7%(-3.13)#12 | 4.5%(-3.87)#361 |
| 13. | Danville | 0.60% | 3.7%(-3.12)#13 | 4.5%(-3.86)#376 |
| 14. | Porter | 0.61% | 3.7%(-3.11)#14 | 4.5%(-3.85)#394 |
| 15. | Wolcott | 0.68% | 3.7%(-3.05)#15 | 4.5%(-3.79)#487 |
| 16. | Dyer | 0.71% | 3.7%(-3.01)#16 | 4.5%(-3.75)#538 |
| 17. | North Terre Haute | 0.72% | 3.7%(-3.00)#17 | 4.5%(-3.74)#559 |
| 18. | Shadeland | 0.72% | 3.7%(-3.00)#18 | 4.5%(-3.74)#561 |
| 19. | Remington | 0.75% | 3.7%(-2.97)#19 | 4.5%(-3.71)#630 |
| 20. | Cynthiana | 0.77% | 3.7%(-2.95)#20 | 4.5%(-3.69)#668 |
| 21. | Bright | 0.78% | 3.7%(-2.95)#21 | 4.5%(-3.69)#689 |
| 22. | Darmstadt | 0.78% | 3.7%(-2.94)#22 | 4.5%(-3.68)#693 |
| 23. | Bunker Hill | 0.79% | 3.7%(-2.93)#23 | 4.5%(-3.67)#742 |
| 24. | Fishers | 0.82% | 3.7%(-2.90)#24 | 4.5%(-3.64)#793 |
| 25. | Charlestown | 0.84% | 3.7%(-2.88)#25 | 4.5%(-3.62)#846 |
| 26. | Hidden Valley | 0.85% | 3.7%(-2.87)#26 | 4.5%(-3.61)#860 |
| 27. | Granger | 0.86% | 3.7%(-2.86)#27 | 4.5%(-3.60)#883 |
| 28. | Ellettsville | 0.90% | 3.7%(-2.82)#28 | 4.5%(-3.56)#954 |
| 29. | Farmersburg | 0.92% | 3.7%(-2.80)#29 | 4.5%(-3.54)#998 |
| 30. | Markle | 0.95% | 3.7%(-2.77)#30 | 4.5%(-3.51)#1,073 |
| 31. | Walkerton | 0.95% | 3.7%(-2.77)#31 | 4.5%(-3.51)#1,078 |
| 32. | Brownstown | 0.96% | 3.7%(-2.76)#32 | 4.5%(-3.50)#1,115 |
| 33. | Crown Point | 0.97% | 3.7%(-2.76)#33 | 4.5%(-3.50)#1,118 |
| 34. | Decatur | 0.97% | 3.7%(-2.76)#34 | 4.5%(-3.50)#1,123 |
| 35. | Cedar Lake | 0.97% | 3.7%(-2.75)#35 | 4.5%(-3.49)#1,126 |
| 36. | Portland | 0.97% | 3.7%(-2.75)#36 | 4.5%(-3.49)#1,147 |
| 37. | Coatesville | 0.99% | 3.7%(-2.73)#37 | 4.5%(-3.47)#1,188 |
| 38. | Westfield | 1.0% | 3.7%(-2.72)#38 | 4.5%(-3.46)#1,219 |
| 39. | Westville | 1.0% | 3.7%(-2.70)#39 | 4.5%(-3.44)#1,274 |
| 40. | Osgood | 1.0% | 3.7%(-2.67)#40 | 4.5%(-3.41)#1,314 |
| 41. | Kennard | 1.1% | 3.7%(-2.63)#41 | 4.5%(-3.37)#1,405 |
| 42. | Yorktown | 1.1% | 3.7%(-2.63)#42 | 4.5%(-3.37)#1,413 |
| 43. | Batesville | 1.1% | 3.7%(-2.62)#43 | 4.5%(-3.36)#1,420 |
| 44. | Jamestown | 1.1% | 3.7%(-2.61)#44 | 4.5%(-3.35)#1,450 |
| 45. | Sheridan | 1.1% | 3.7%(-2.59)#45 | 4.5%(-3.33)#1,498 |
| 46. | Haubstadt | 1.1% | 3.7%(-2.59)#46 | 4.5%(-3.33)#1,506 |
| 47. | Huntertown | 1.1% | 3.7%(-2.58)#47 | 4.5%(-3.32)#1,524 |
| 48. | Rossville | 1.1% | 3.7%(-2.58)#48 | 4.5%(-3.32)#1,542 |
| 49. | Aurora | 1.1% | 3.7%(-2.57)#49 | 4.5%(-3.31)#1,548 |
| 50. | Amo | 1.2% | 3.7%(-2.56)#50 | 4.5%(-3.30)#1,594 |
| 51. | Plainville | 1.2% | 3.7%(-2.55)#51 | 4.5%(-3.29)#1,623 |
| 52. | Fillmore | 1.2% | 3.7%(-2.52)#52 | 4.5%(-3.26)#1,695 |
| 53. | Burnettsville | 1.2% | 3.7%(-2.52)#53 | 4.5%(-3.26)#1,700 |
| 54. | Brook | 1.2% | 3.7%(-2.51)#54 | 4.5%(-3.25)#1,718 |
| 55. | Utica | 1.2% | 3.7%(-2.50)#55 | 4.5%(-3.24)#1,728 |
| 56. | Carmel | 1.2% | 3.7%(-2.50)#56 | 4.5%(-3.24)#1,735 |
| 57. | Montezuma | 1.2% | 3.7%(-2.48)#57 | 4.5%(-3.22)#1,777 |
| 58. | Otterbein | 1.3% | 3.7%(-2.39)#58 | 4.5%(-3.13)#2,014 |
| 59. | Pendleton | 1.3% | 3.7%(-2.38)#59 | 4.5%(-3.12)#2,032 |
| 60. | Martinsville | 1.3% | 3.7%(-2.38)#60 | 4.5%(-3.12)#2,034 |
| 61. | Mooresville | 1.4% | 3.7%(-2.34)#61 | 4.5%(-3.08)#2,162 |
| 62. | Sellersburg | 1.4% | 3.7%(-2.33)#62 | 4.5%(-3.07)#2,186 |
| 63. | Southport | 1.4% | 3.7%(-2.30)#63 | 4.5%(-3.04)#2,269 |
| 64. | Camden | 1.4% | 3.7%(-2.28)#64 | 4.5%(-3.02)#2,314 |
| 65. | Middletown | 1.5% | 3.7%(-2.27)#65 | 4.5%(-3.01)#2,360 |
| 66. | Ashley | 1.5% | 3.7%(-2.27)#66 | 4.5%(-3.01)#2,367 |
| 67. | Princeton | 1.5% | 3.7%(-2.24)#67 | 4.5%(-2.98)#2,428 |
| 68. | Bruceville | 1.5% | 3.7%(-2.23)#68 | 4.5%(-2.97)#2,456 |
| 69. | Roanoke | 1.5% | 3.7%(-2.22)#69 | 4.5%(-2.96)#2,474 |
| 70. | Clear Lake | 1.5% | 3.7%(-2.22)#70 | 4.5%(-2.96)#2,492 |
| 71. | Bloomingdale | 1.5% | 3.7%(-2.18)#71 | 4.5%(-2.92)#2,579 |
| 72. | Earl Park | 1.5% | 3.7%(-2.18)#72 | 4.5%(-2.92)#2,583 |
| 73. | Leesburg | 1.6% | 3.7%(-2.11)#73 | 4.5%(-2.85)#2,779 |
| 74. | Windfall City | 1.6% | 3.7%(-2.10)#74 | 4.5%(-2.84)#2,820 |
| 75. | Whitestown | 1.7% | 3.7%(-2.07)#75 | 4.5%(-2.81)#2,913 |
| 76. | Hymera | 1.7% | 3.7%(-2.04)#76 | 4.5%(-2.78)#2,960 |
| 77. | Rising Sun | 1.7% | 3.7%(-2.02)#77 | 4.5%(-2.76)#3,013 |
| 78. | Lakes Of The Four Seasons | 1.7% | 3.7%(-2.00)#78 | 4.5%(-2.74)#3,069 |
| 79. | Marshall | 1.7% | 3.7%(-2.00)#79 | 4.5%(-2.74)#3,084 |
| 80. | Owensville | 1.7% | 3.7%(-1.98)#80 | 4.5%(-2.72)#3,131 |
| 81. | North Liberty | 1.8% | 3.7%(-1.95)#81 | 4.5%(-2.69)#3,186 |
| 82. | Reynolds | 1.8% | 3.7%(-1.92)#82 | 4.5%(-2.66)#3,284 |
| 83. | Harlan | 1.8% | 3.7%(-1.90)#83 | 4.5%(-2.64)#3,344 |
| 84. | Monroeville | 1.8% | 3.7%(-1.89)#84 | 4.5%(-2.63)#3,364 |
| 85. | Parker City | 1.8% | 3.7%(-1.88)#85 | 4.5%(-2.62)#3,374 |
| 86. | Churubusco | 1.9% | 3.7%(-1.86)#86 | 4.5%(-2.60)#3,429 |
| 87. | Schererville | 1.9% | 3.7%(-1.85)#87 | 4.5%(-2.59)#3,458 |
| 88. | Greenwood | 1.9% | 3.7%(-1.85)#88 | 4.5%(-2.59)#3,466 |
| 89. | Kingsford Heights | 1.9% | 3.7%(-1.84)#89 | 4.5%(-2.58)#3,472 |
| 90. | Sharpsville | 1.9% | 3.7%(-1.84)#90 | 4.5%(-2.58)#3,489 |
| 91. | Winchester | 1.9% | 3.7%(-1.81)#91 | 4.5%(-2.55)#3,542 |
| 92. | Lizton | 1.9% | 3.7%(-1.81)#92 | 4.5%(-2.55)#3,545 |
| 93. | Beverly Shores | 2.0% | 3.7%(-1.77)#93 | 4.5%(-2.51)#3,627 |
| 94. | Monticello | 2.0% | 3.7%(-1.77)#94 | 4.5%(-2.51)#3,640 |
| 95. | Greenfield | 2.0% | 3.7%(-1.72)#95 | 4.5%(-2.46)#3,753 |
| 96. | Sweetser | 2.0% | 3.7%(-1.71)#96 | 4.5%(-2.45)#3,801 |
| 97. | Ogden Dunes | 2.0% | 3.7%(-1.70)#97 | 4.5%(-2.44)#3,816 |
| 98. | Ossian | 2.0% | 3.7%(-1.69)#98 | 4.5%(-2.43)#3,840 |
| 99. | Advance | 2.0% | 3.7%(-1.68)#99 | 4.5%(-2.42)#3,857 |
| 100. | Veedersburg | 2.1% | 3.7%(-1.67)#100 | 4.5%(-2.41)#3,881 |
Common Questions
What are the Top 10 Cities with the Lowest Poverty Level Among Married Couples in Indiana?
Top 10 Cities with the Lowest Poverty Level Among Married Couples in Indiana are:
#1
0.093%
#2
0.35%
#3
0.35%
#4
0.38%
#5
0.41%
#6
0.43%
#7
0.45%
#8
0.45%
#9
0.46%
#10
0.51%
What city has the Lowest Poverty Level Among Married Couples in Indiana?
Pittsboro has the Lowest Poverty Level Among Married Couples in Indiana with 0.093%.
What is the Poverty Level Among Married Couples in the State of Indiana?
Poverty Level Among Married Couples in Indiana is 3.7%.
What is the Poverty Level Among Married Couples in the United States?
Poverty Level Among Married Couples in the United States is 4.5%.