Cities with the Lowest Poverty Level Among Married Couples in Iowa
RELATED REPORTS & OPTIONS
Lowest Poverty | Married Couple
Iowa
Compare Cities
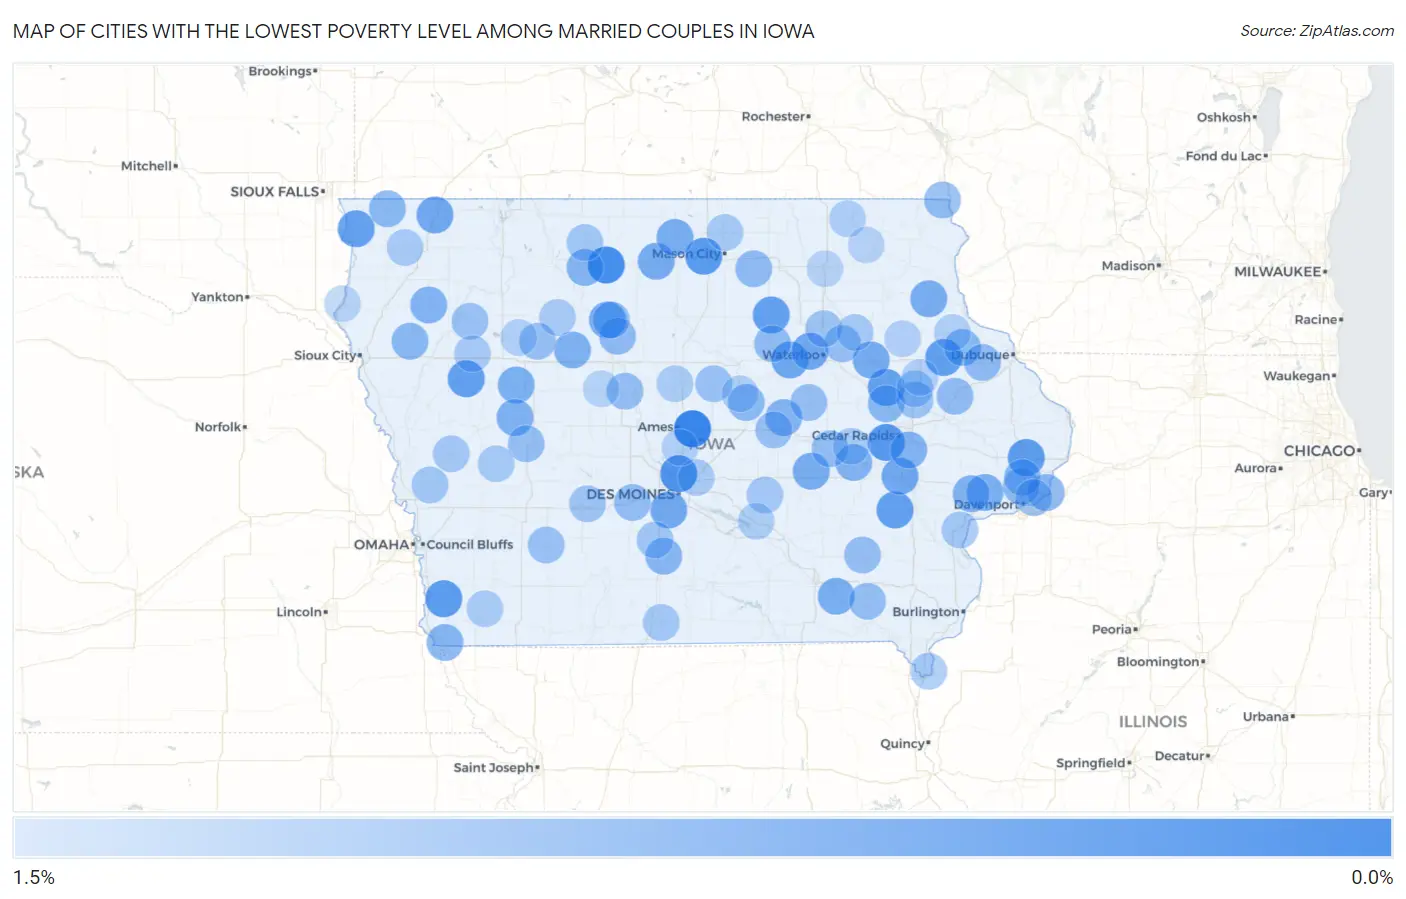
Map of Cities with the Lowest Poverty Level Among Married Couples in Iowa
1.5%
0.0%
Cities with the Lowest Poverty Level Among Married Couples in Iowa
| City | Married Couples Poverty | vs State | vs National | |
| 1. | Nevada | 0.075% | 3.2%(-3.08)#1 | 4.5%(-4.39)#4 |
| 2. | Algona | 0.21% | 3.2%(-2.94)#2 | 4.5%(-4.25)#36 |
| 3. | Ankeny | 0.30% | 3.2%(-2.85)#3 | 4.5%(-4.16)#69 |
| 4. | Fairfax | 0.40% | 3.2%(-2.75)#4 | 4.5%(-4.06)#143 |
| 5. | Clear Lake | 0.42% | 3.2%(-2.73)#5 | 4.5%(-4.04)#170 |
| 6. | Tabor | 0.43% | 3.2%(-2.72)#6 | 4.5%(-4.03)#175 |
| 7. | Dewitt | 0.46% | 3.2%(-2.69)#7 | 4.5%(-4.00)#208 |
| 8. | Kalona | 0.50% | 3.2%(-2.65)#8 | 4.5%(-3.96)#248 |
| 9. | Earlville | 0.51% | 3.2%(-2.65)#9 | 4.5%(-3.96)#250 |
| 10. | Ida Grove | 0.51% | 3.2%(-2.65)#10 | 4.5%(-3.95)#254 |
| 11. | Allison | 0.53% | 3.2%(-2.63)#11 | 4.5%(-3.94)#276 |
| 12. | Walker | 0.54% | 3.2%(-2.61)#12 | 4.5%(-3.92)#294 |
| 13. | Inwood | 0.56% | 3.2%(-2.60)#13 | 4.5%(-3.91)#317 |
| 14. | Dike | 0.64% | 3.2%(-2.52)#14 | 4.5%(-3.82)#425 |
| 15. | Tiffin | 0.65% | 3.2%(-2.51)#15 | 4.5%(-3.81)#441 |
| 16. | Cedar Falls | 0.65% | 3.2%(-2.50)#16 | 4.5%(-3.81)#446 |
| 17. | Sibley | 0.66% | 3.2%(-2.49)#17 | 4.5%(-3.80)#457 |
| 18. | Norwalk | 0.67% | 3.2%(-2.49)#18 | 4.5%(-3.79)#478 |
| 19. | Humboldt | 0.67% | 3.2%(-2.48)#19 | 4.5%(-3.79)#479 |
| 20. | Britt | 0.72% | 3.2%(-2.44)#20 | 4.5%(-3.74)#558 |
| 21. | Independence | 0.73% | 3.2%(-2.43)#21 | 4.5%(-3.74)#575 |
| 22. | Forest City | 0.74% | 3.2%(-2.42)#22 | 4.5%(-3.72)#596 |
| 23. | Brooklyn | 0.75% | 3.2%(-2.41)#23 | 4.5%(-3.72)#611 |
| 24. | Elkader | 0.75% | 3.2%(-2.40)#24 | 4.5%(-3.71)#624 |
| 25. | Durant | 0.76% | 3.2%(-2.40)#25 | 4.5%(-3.70)#642 |
| 26. | Eldon | 0.76% | 3.2%(-2.39)#26 | 4.5%(-3.70)#653 |
| 27. | Lake View | 0.79% | 3.2%(-2.37)#27 | 4.5%(-3.67)#719 |
| 28. | Manson | 0.80% | 3.2%(-2.35)#28 | 4.5%(-3.66)#762 |
| 29. | Arcadia | 0.81% | 3.2%(-2.35)#29 | 4.5%(-3.66)#765 |
| 30. | Wilton | 0.84% | 3.2%(-2.32)#30 | 4.5%(-3.62)#843 |
| 31. | Marengo | 0.85% | 3.2%(-2.31)#31 | 4.5%(-3.61)#861 |
| 32. | Garwin | 0.85% | 3.2%(-2.31)#32 | 4.5%(-3.61)#863 |
| 33. | Marcus | 0.86% | 3.2%(-2.30)#33 | 4.5%(-3.60)#882 |
| 34. | Ely | 0.86% | 3.2%(-2.29)#34 | 4.5%(-3.60)#890 |
| 35. | Whittemore | 0.87% | 3.2%(-2.29)#35 | 4.5%(-3.59)#901 |
| 36. | Hamburg | 0.89% | 3.2%(-2.27)#36 | 4.5%(-3.57)#930 |
| 37. | Le Claire | 0.89% | 3.2%(-2.26)#37 | 4.5%(-3.57)#936 |
| 38. | New Virginia | 0.90% | 3.2%(-2.25)#38 | 4.5%(-3.56)#959 |
| 39. | Center Point | 0.91% | 3.2%(-2.25)#39 | 4.5%(-3.55)#973 |
| 40. | Rock Rapids | 0.91% | 3.2%(-2.24)#40 | 4.5%(-3.55)#984 |
| 41. | Kingsley | 0.91% | 3.2%(-2.24)#41 | 4.5%(-3.55)#991 |
| 42. | New Vienna | 0.92% | 3.2%(-2.24)#42 | 4.5%(-3.54)#1,003 |
| 43. | Liscomb | 0.93% | 3.2%(-2.22)#43 | 4.5%(-3.53)#1,043 |
| 44. | Badger | 0.96% | 3.2%(-2.19)#44 | 4.5%(-3.50)#1,108 |
| 45. | Eldridge | 0.97% | 3.2%(-2.19)#45 | 4.5%(-3.50)#1,117 |
| 46. | Long Grove | 0.97% | 3.2%(-2.19)#46 | 4.5%(-3.50)#1,121 |
| 47. | Rockford | 0.98% | 3.2%(-2.17)#47 | 4.5%(-3.48)#1,155 |
| 48. | Epworth | 0.99% | 3.2%(-2.17)#48 | 4.5%(-3.48)#1,171 |
| 49. | Dakota City | 1.00% | 3.2%(-2.16)#49 | 4.5%(-3.47)#1,196 |
| 50. | Parkersburg | 1.00% | 3.2%(-2.16)#50 | 4.5%(-3.46)#1,198 |
| 51. | Monticello | 1.00% | 3.2%(-2.16)#51 | 4.5%(-3.46)#1,200 |
| 52. | New Albin | 1.0% | 3.2%(-2.16)#52 | 4.5%(-3.46)#1,209 |
| 53. | De Soto | 1.0% | 3.2%(-2.13)#53 | 4.5%(-3.44)#1,258 |
| 54. | Fonda | 1.0% | 3.2%(-2.11)#54 | 4.5%(-3.42)#1,302 |
| 55. | Birmingham | 1.0% | 3.2%(-2.11)#55 | 4.5%(-3.42)#1,303 |
| 56. | Richland | 1.0% | 3.2%(-2.11)#56 | 4.5%(-3.42)#1,305 |
| 57. | Templeton | 1.0% | 3.2%(-2.11)#57 | 4.5%(-3.42)#1,309 |
| 58. | Dunkerton | 1.0% | 3.2%(-2.11)#58 | 4.5%(-3.41)#1,316 |
| 59. | Traer | 1.1% | 3.2%(-2.10)#59 | 4.5%(-3.41)#1,333 |
| 60. | Belle Plaine | 1.1% | 3.2%(-2.10)#60 | 4.5%(-3.40)#1,336 |
| 61. | Dayton | 1.1% | 3.2%(-2.10)#61 | 4.5%(-3.40)#1,342 |
| 62. | Le Grand | 1.1% | 3.2%(-2.09)#62 | 4.5%(-3.40)#1,354 |
| 63. | Bettendorf | 1.1% | 3.2%(-2.09)#63 | 4.5%(-3.39)#1,370 |
| 64. | Hubbard | 1.1% | 3.2%(-2.07)#64 | 4.5%(-3.38)#1,390 |
| 65. | Massena | 1.1% | 3.2%(-2.07)#65 | 4.5%(-3.37)#1,407 |
| 66. | Aurelia | 1.1% | 3.2%(-2.06)#66 | 4.5%(-3.36)#1,425 |
| 67. | Central City | 1.1% | 3.2%(-2.04)#67 | 4.5%(-3.34)#1,470 |
| 68. | Menlo | 1.1% | 3.2%(-2.03)#68 | 4.5%(-3.34)#1,482 |
| 69. | Denver | 1.1% | 3.2%(-2.01)#69 | 4.5%(-3.32)#1,539 |
| 70. | Coggon | 1.2% | 3.2%(-2.00)#70 | 4.5%(-3.31)#1,570 |
| 71. | St Charles | 1.2% | 3.2%(-1.99)#71 | 4.5%(-3.29)#1,607 |
| 72. | Logan | 1.2% | 3.2%(-1.98)#72 | 4.5%(-3.29)#1,611 |
| 73. | Fruitland | 1.2% | 3.2%(-1.98)#73 | 4.5%(-3.29)#1,620 |
| 74. | Fenton | 1.2% | 3.2%(-1.98)#74 | 4.5%(-3.29)#1,625 |
| 75. | Leon | 1.2% | 3.2%(-1.96)#75 | 4.5%(-3.27)#1,651 |
| 76. | Dunlap | 1.2% | 3.2%(-1.96)#76 | 4.5%(-3.27)#1,670 |
| 77. | Sully | 1.2% | 3.2%(-1.96)#77 | 4.5%(-3.27)#1,674 |
| 78. | Keokuk | 1.2% | 3.2%(-1.95)#78 | 4.5%(-3.26)#1,691 |
| 79. | Fairbank | 1.2% | 3.2%(-1.94)#79 | 4.5%(-3.25)#1,717 |
| 80. | Irwin | 1.2% | 3.2%(-1.94)#80 | 4.5%(-3.24)#1,733 |
| 81. | Manly | 1.2% | 3.2%(-1.93)#81 | 4.5%(-3.23)#1,749 |
| 82. | Boyden | 1.2% | 3.2%(-1.92)#82 | 4.5%(-3.23)#1,767 |
| 83. | Pocahontas | 1.2% | 3.2%(-1.91)#83 | 4.5%(-3.22)#1,776 |
| 84. | Galva | 1.3% | 3.2%(-1.91)#84 | 4.5%(-3.21)#1,791 |
| 85. | Bondurant | 1.3% | 3.2%(-1.90)#85 | 4.5%(-3.20)#1,814 |
| 86. | Jewell Junction | 1.3% | 3.2%(-1.89)#86 | 4.5%(-3.20)#1,834 |
| 87. | Essex | 1.3% | 3.2%(-1.88)#87 | 4.5%(-3.19)#1,866 |
| 88. | Blairstown | 1.3% | 3.2%(-1.88)#88 | 4.5%(-3.19)#1,867 |
| 89. | Pella | 1.3% | 3.2%(-1.88)#89 | 4.5%(-3.18)#1,875 |
| 90. | Union | 1.3% | 3.2%(-1.87)#90 | 4.5%(-3.18)#1,888 |
| 91. | Cresco | 1.3% | 3.2%(-1.86)#91 | 4.5%(-3.17)#1,912 |
| 92. | Colesburg | 1.3% | 3.2%(-1.86)#92 | 4.5%(-3.16)#1,935 |
| 93. | Newell | 1.3% | 3.2%(-1.83)#93 | 4.5%(-3.14)#1,992 |
| 94. | Lamont | 1.3% | 3.2%(-1.82)#94 | 4.5%(-3.13)#2,019 |
| 95. | Ryan | 1.3% | 3.2%(-1.82)#95 | 4.5%(-3.13)#2,021 |
| 96. | Huxley | 1.3% | 3.2%(-1.82)#96 | 4.5%(-3.13)#2,029 |
| 97. | Gowrie | 1.4% | 3.2%(-1.80)#97 | 4.5%(-3.11)#2,074 |
| 98. | Akron | 1.4% | 3.2%(-1.79)#98 | 4.5%(-3.09)#2,119 |
| 99. | Spillville | 1.4% | 3.2%(-1.79)#99 | 4.5%(-3.09)#2,125 |
| 100. | New Hampton | 1.4% | 3.2%(-1.78)#100 | 4.5%(-3.09)#2,134 |
Common Questions
What are the Top 10 Cities with the Lowest Poverty Level Among Married Couples in Iowa?
Top 10 Cities with the Lowest Poverty Level Among Married Couples in Iowa are:
What city has the Lowest Poverty Level Among Married Couples in Iowa?
Nevada has the Lowest Poverty Level Among Married Couples in Iowa with 0.075%.
What is the Poverty Level Among Married Couples in the State of Iowa?
Poverty Level Among Married Couples in Iowa is 3.2%.
What is the Poverty Level Among Married Couples in the United States?
Poverty Level Among Married Couples in the United States is 4.5%.