Spring Valley Lake, CA Map & Demographics
Spring Valley Lake Map
Spring Valley Lake Overview
$40,042
PER CAPITA INCOME
$91,928
AVG FAMILY INCOME
$90,663
AVG HOUSEHOLD INCOME
52.5%
WAGE / INCOME GAP [ % ]
47.5¢/ $1
WAGE / INCOME GAP [ $ ]
0.43
INEQUALITY / GINI INDEX
8,764
TOTAL POPULATION
4,174
MALE POPULATION
4,590
FEMALE POPULATION
90.94
MALES / 100 FEMALES
109.97
FEMALES / 100 MALES
39.0
MEDIAN AGE
3.4
AVG FAMILY SIZE
3.0
AVG HOUSEHOLD SIZE
3,759
LABOR FORCE [ PEOPLE ]
55.3%
PERCENT IN LABOR FORCE
6.2%
UNEMPLOYMENT RATE
Income in Spring Valley Lake
Income Overview in Spring Valley Lake
Per Capita Income in Spring Valley Lake is $40,042, while median incomes of families and households are $91,928 and $90,663 respectively.
| Characteristic | Number | Measure |
| Per Capita Income | 8,764 | $40,042 |
| Median Family Income | 2,292 | $91,928 |
| Mean Family Income | 2,292 | $120,530 |
| Median Household Income | 2,958 | $90,663 |
| Mean Household Income | 2,958 | $117,092 |
| Income Deficit | 2,292 | $0 |
| Wage / Income Gap (%) | 8,764 | 52.49% |
| Wage / Income Gap ($) | 8,764 | 47.51¢ per $1 |
| Gini / Inequality Index | 8,764 | 0.43 |
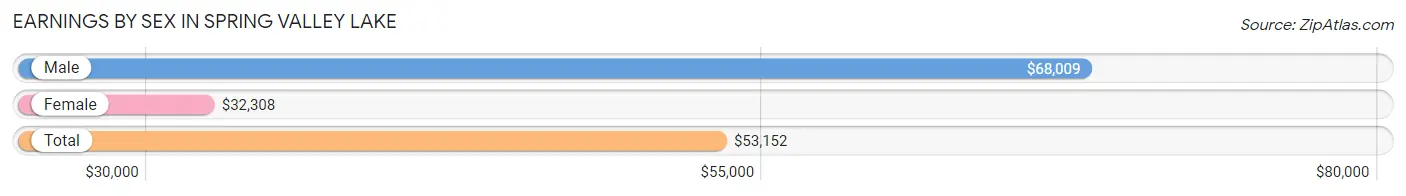
Earnings by Sex in Spring Valley Lake
Average Earnings in Spring Valley Lake are $53,152, $68,009 for men and $32,308 for women, a difference of 52.5%.
| Sex | Number | Average Earnings |
| Male | 2,025 (51.1%) | $68,009 |
| Female | 1,936 (48.9%) | $32,308 |
| Total | 3,961 (100.0%) | $53,152 |
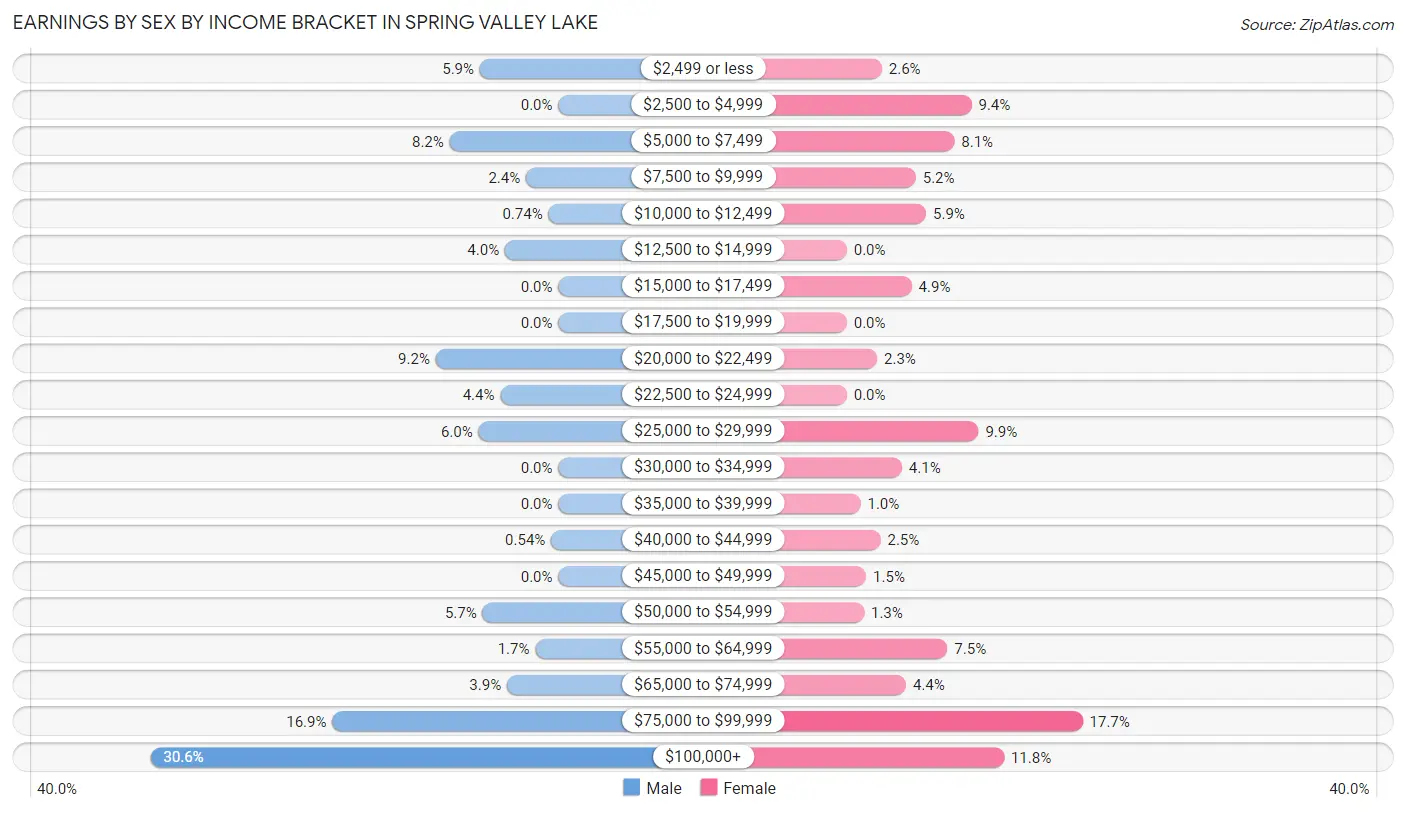
Earnings by Sex by Income Bracket in Spring Valley Lake
The most common earnings brackets in Spring Valley Lake are $100,000+ for men (619 | 30.6%) and $75,000 to $99,999 for women (342 | 17.7%).
| Income | Male | Female |
| $2,499 or less | 119 (5.9%) | 51 (2.6%) |
| $2,500 to $4,999 | 0 (0.0%) | 181 (9.3%) |
| $5,000 to $7,499 | 165 (8.2%) | 156 (8.1%) |
| $7,500 to $9,999 | 49 (2.4%) | 100 (5.2%) |
| $10,000 to $12,499 | 15 (0.7%) | 115 (5.9%) |
| $12,500 to $14,999 | 81 (4.0%) | 0 (0.0%) |
| $15,000 to $17,499 | 0 (0.0%) | 94 (4.9%) |
| $17,500 to $19,999 | 0 (0.0%) | 0 (0.0%) |
| $20,000 to $22,499 | 186 (9.2%) | 44 (2.3%) |
| $22,500 to $24,999 | 88 (4.3%) | 0 (0.0%) |
| $25,000 to $29,999 | 121 (6.0%) | 191 (9.9%) |
| $30,000 to $34,999 | 0 (0.0%) | 80 (4.1%) |
| $35,000 to $39,999 | 0 (0.0%) | 20 (1.0%) |
| $40,000 to $44,999 | 11 (0.5%) | 49 (2.5%) |
| $45,000 to $49,999 | 0 (0.0%) | 28 (1.5%) |
| $50,000 to $54,999 | 115 (5.7%) | 25 (1.3%) |
| $55,000 to $64,999 | 35 (1.7%) | 146 (7.5%) |
| $65,000 to $74,999 | 78 (3.8%) | 86 (4.4%) |
| $75,000 to $99,999 | 343 (16.9%) | 342 (17.7%) |
| $100,000+ | 619 (30.6%) | 228 (11.8%) |
| Total | 2,025 (100.0%) | 1,936 (100.0%) |
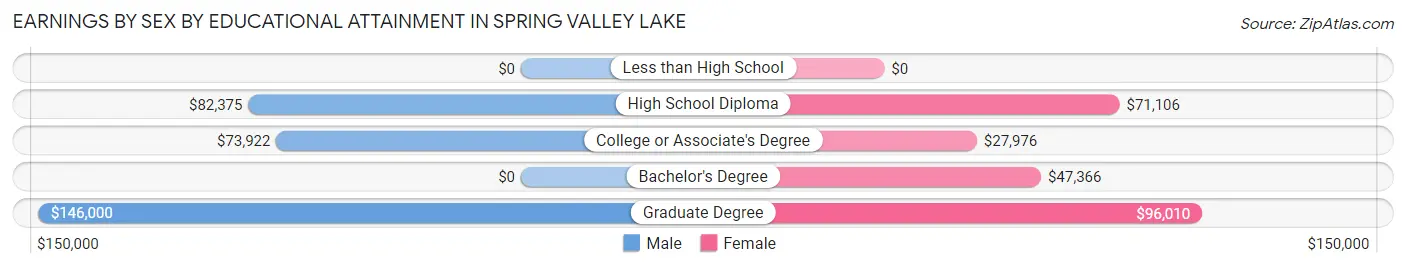
Earnings by Sex by Educational Attainment in Spring Valley Lake
Average earnings in Spring Valley Lake are $83,365 for men and $57,892 for women, a difference of 30.6%. Men with an educational attainment of graduate degree enjoy the highest average annual earnings of $146,000, while those with college or associate's degree education earn the least with $73,922. Women with an educational attainment of graduate degree earn the most with the average annual earnings of $96,010, while those with college or associate's degree education have the smallest earnings of $27,976.
| Educational Attainment | Male Income | Female Income |
| Less than High School | - | - |
| High School Diploma | $82,375 | $71,106 |
| College or Associate's Degree | $73,922 | $27,976 |
| Bachelor's Degree | - | - |
| Graduate Degree | $146,000 | $96,010 |
| Total | $83,365 | $57,892 |
Family Income in Spring Valley Lake
Family Income Brackets in Spring Valley Lake
According to the Spring Valley Lake family income data, there are 474 families falling into the $100,000 to $149,999 income range, which is the most common income bracket and makes up 20.7% of all families. Conversely, the $10,000 to $14,999 income bracket is the least frequent group with only 16 families (0.7%) belonging to this category.
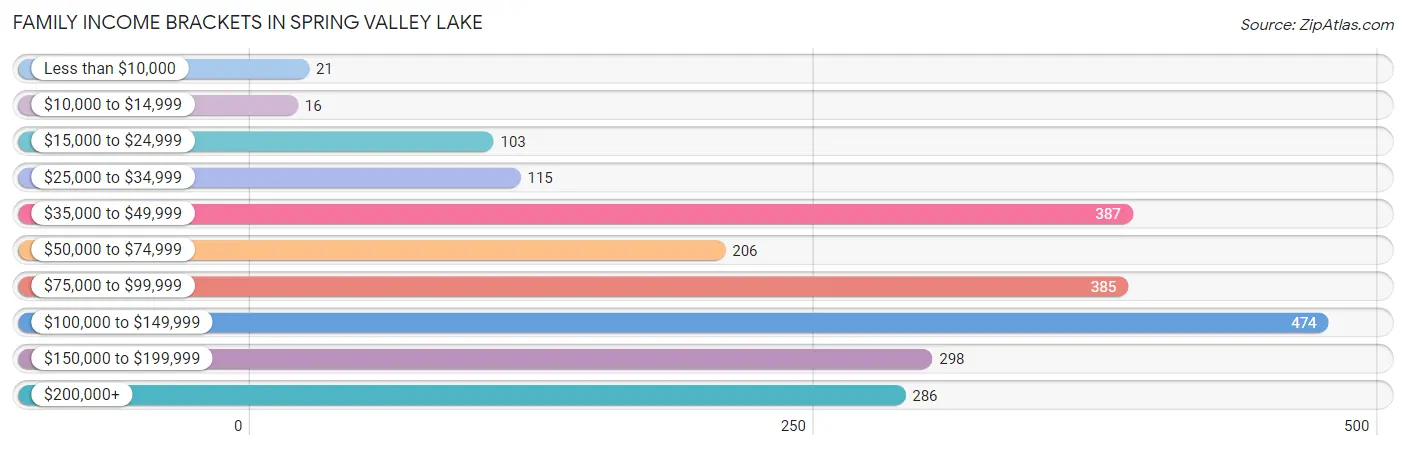
| Income Bracket | # Families | % Families |
| Less than $10,000 | 21 | 0.9% |
| $10,000 to $14,999 | 16 | 0.7% |
| $15,000 to $24,999 | 103 | 4.5% |
| $25,000 to $34,999 | 115 | 5.0% |
| $35,000 to $49,999 | 387 | 16.9% |
| $50,000 to $74,999 | 206 | 9.0% |
| $75,000 to $99,999 | 385 | 16.8% |
| $100,000 to $149,999 | 474 | 20.7% |
| $150,000 to $199,999 | 298 | 13.0% |
| $200,000+ | 286 | 12.5% |
Family Income by Famaliy Size in Spring Valley Lake
5-person families (207 | 9.0%) account for the highest median family income in Spring Valley Lake with $184,977 per family, while 2-person families (970 | 42.3%) have the highest median income of $43,534 per family member.
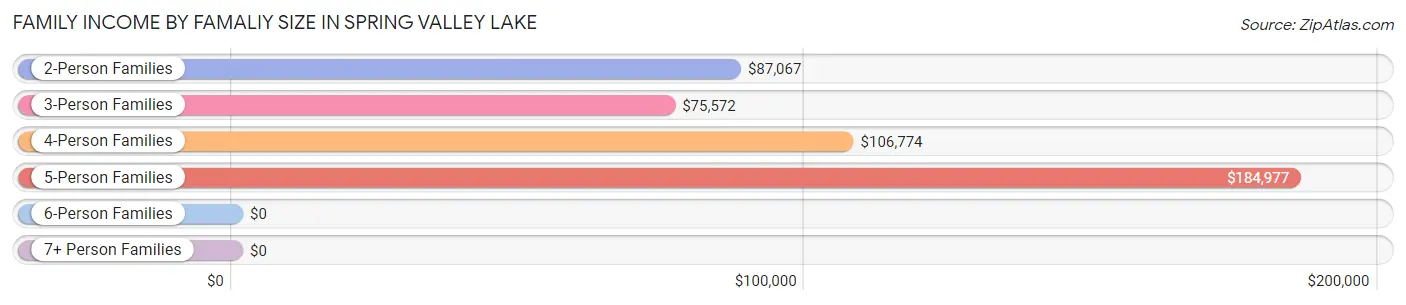
| Income Bracket | # Families | Median Income |
| 2-Person Families | 970 (42.3%) | $87,067 |
| 3-Person Families | 527 (23.0%) | $75,572 |
| 4-Person Families | 498 (21.7%) | $106,774 |
| 5-Person Families | 207 (9.0%) | $184,977 |
| 6-Person Families | 50 (2.2%) | $0 |
| 7+ Person Families | 40 (1.8%) | $0 |
| Total | 2,292 (100.0%) | $91,928 |
Family Income by Number of Earners in Spring Valley Lake
The median family income in Spring Valley Lake is $91,928, with families comprising 3+ earners (258) having the highest median family income of $183,636, while families with no earners (633) have the lowest median family income of $54,609, accounting for 11.3% and 27.6% of families, respectively.
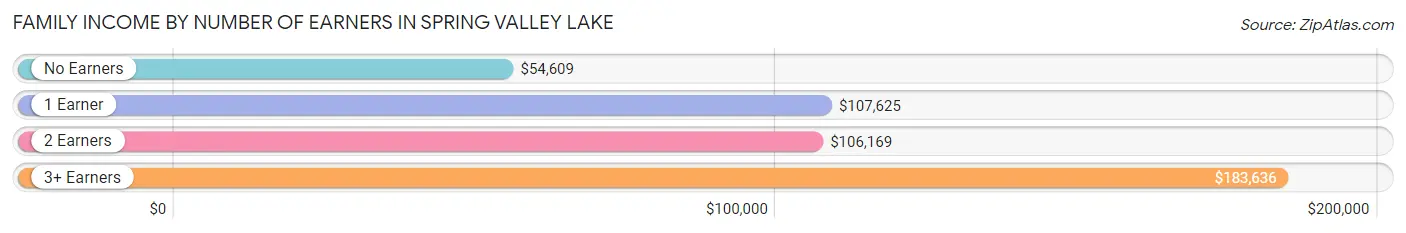
| Number of Earners | # Families | Median Income |
| No Earners | 633 (27.6%) | $54,609 |
| 1 Earner | 458 (20.0%) | $107,625 |
| 2 Earners | 943 (41.1%) | $106,169 |
| 3+ Earners | 258 (11.3%) | $183,636 |
| Total | 2,292 (100.0%) | $91,928 |
Household Income in Spring Valley Lake
Household Income Brackets in Spring Valley Lake
With 544 households falling in the category, the $35,000 to $49,999 income range is the most frequent in Spring Valley Lake, accounting for 18.4% of all households. In contrast, only 33 households (1.1%) fall into the less than $10,000 income bracket, making it the least populous group.
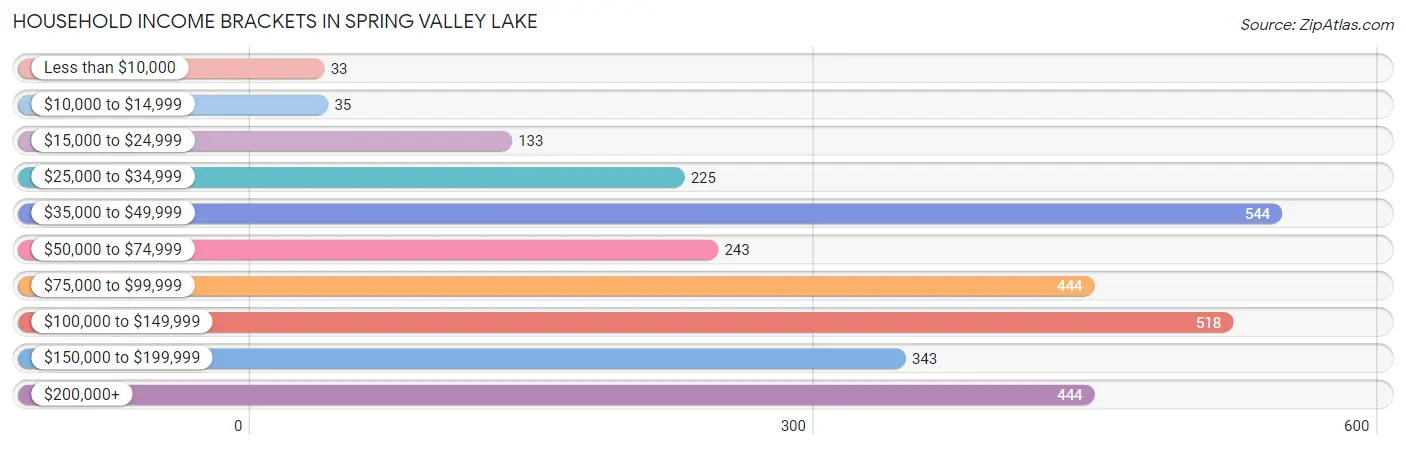
| Income Bracket | # Households | % Households |
| Less than $10,000 | 33 | 1.1% |
| $10,000 to $14,999 | 35 | 1.2% |
| $15,000 to $24,999 | 133 | 4.5% |
| $25,000 to $34,999 | 225 | 7.6% |
| $35,000 to $49,999 | 544 | 18.4% |
| $50,000 to $74,999 | 243 | 8.2% |
| $75,000 to $99,999 | 444 | 15.0% |
| $100,000 to $149,999 | 518 | 17.5% |
| $150,000 to $199,999 | 343 | 11.6% |
| $200,000+ | 444 | 15.0% |
Household Income by Householder Age in Spring Valley Lake
The median household income in Spring Valley Lake is $90,663, with the highest median household income of $124,311 found in the 25 to 44 years age bracket for the primary householder. A total of 759 households (25.7%) fall into this category. Meanwhile, the 15 to 24 years age bracket for the primary householder has the lowest median household income of $0, with 85 households (2.9%) in this group.
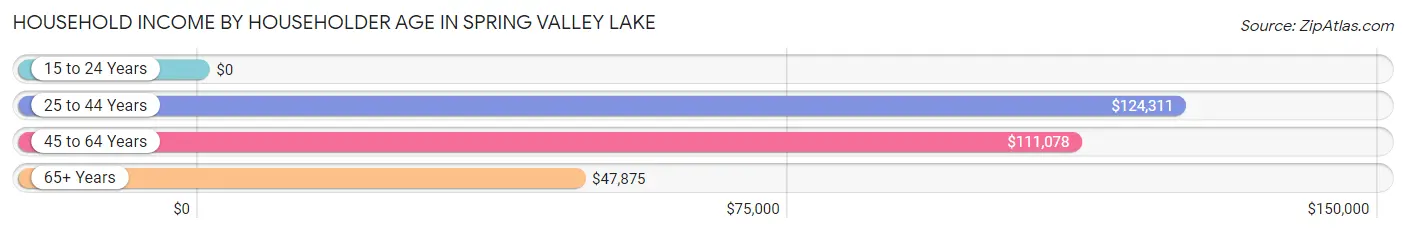
| Income Bracket | # Households | Median Income |
| 15 to 24 Years | 85 (2.9%) | $0 |
| 25 to 44 Years | 759 (25.7%) | $124,311 |
| 45 to 64 Years | 1,115 (37.7%) | $111,078 |
| 65+ Years | 999 (33.8%) | $47,875 |
| Total | 2,958 (100.0%) | $90,663 |
Poverty in Spring Valley Lake
Income Below Poverty by Sex and Age in Spring Valley Lake
With 5.3% poverty level for males and 5.6% for females among the residents of Spring Valley Lake, 18 to 24 year old males and under 5 year old females are the most vulnerable to poverty, with 106 males (22.9%) and 49 females (20.8%) in their respective age groups living below the poverty level.
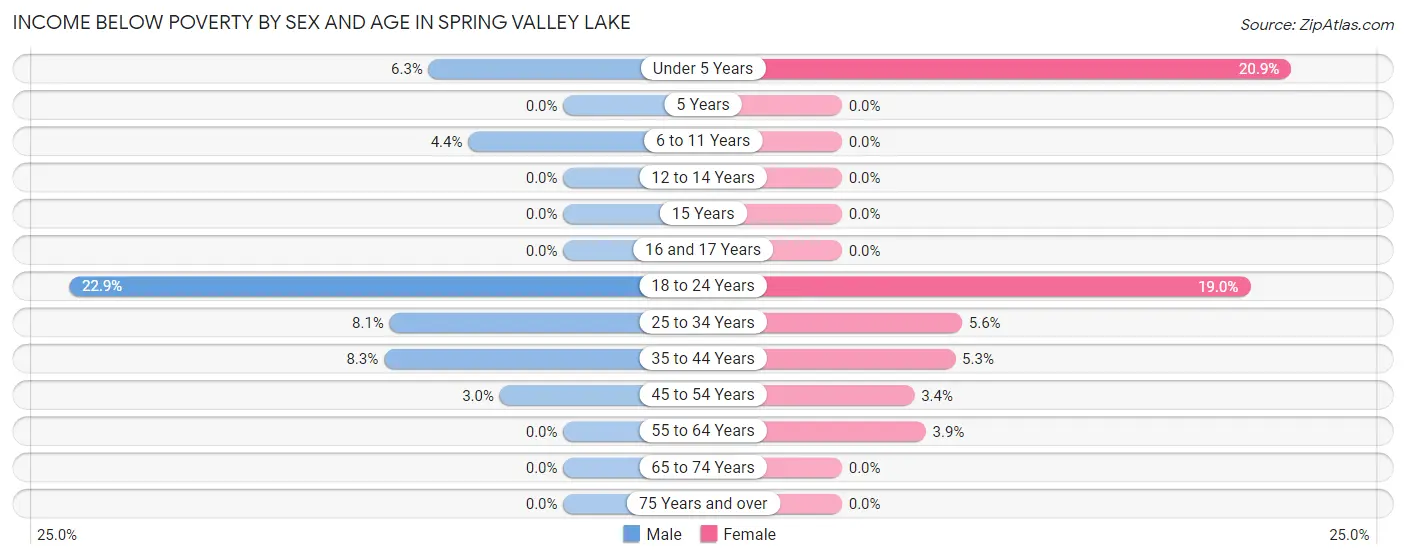
| Age Bracket | Male | Female |
| Under 5 Years | 15 (6.2%) | 49 (20.8%) |
| 5 Years | 0 (0.0%) | 0 (0.0%) |
| 6 to 11 Years | 13 (4.4%) | 0 (0.0%) |
| 12 to 14 Years | 0 (0.0%) | 0 (0.0%) |
| 15 Years | 0 (0.0%) | 0 (0.0%) |
| 16 and 17 Years | 0 (0.0%) | 0 (0.0%) |
| 18 to 24 Years | 106 (22.9%) | 116 (19.0%) |
| 25 to 34 Years | 35 (8.1%) | 18 (5.6%) |
| 35 to 44 Years | 38 (8.3%) | 32 (5.3%) |
| 45 to 54 Years | 14 (2.9%) | 13 (3.4%) |
| 55 to 64 Years | 0 (0.0%) | 24 (3.9%) |
| 65 to 74 Years | 0 (0.0%) | 0 (0.0%) |
| 75 Years and over | 0 (0.0%) | 0 (0.0%) |
| Total | 221 (5.3%) | 252 (5.6%) |
Income Above Poverty by Sex and Age in Spring Valley Lake
According to the poverty statistics in Spring Valley Lake, males aged 5 years and females aged 5 years are the age groups that are most secure financially, with 100.0% of males and 100.0% of females in these age groups living above the poverty line.
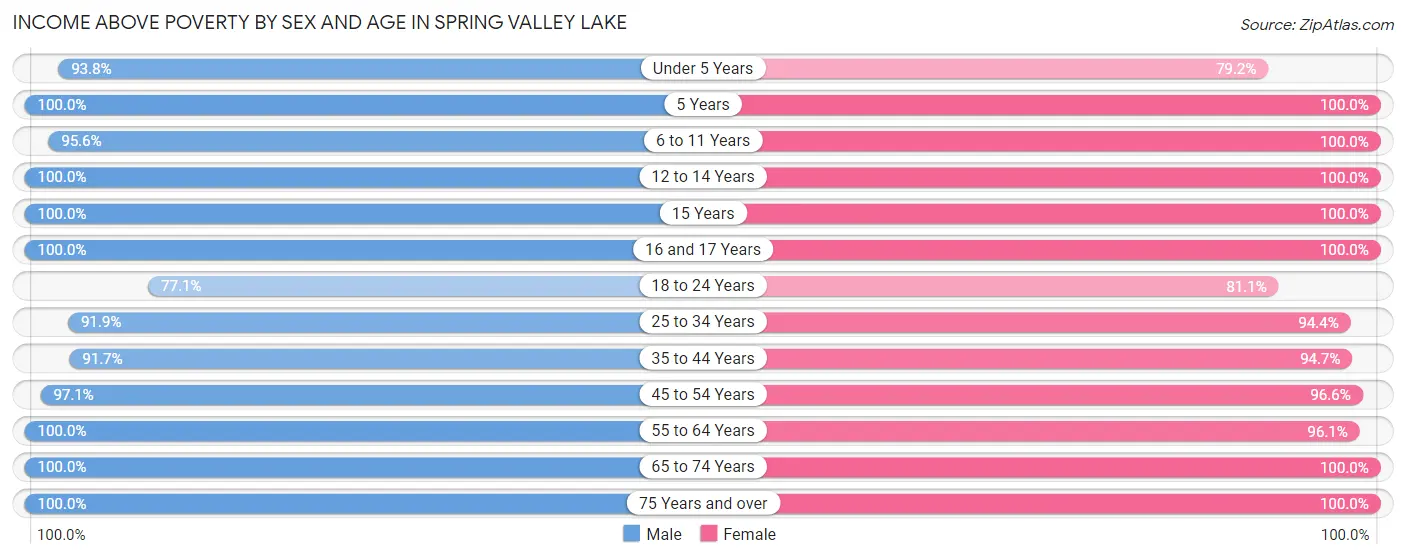
| Age Bracket | Male | Female |
| Under 5 Years | 225 (93.8%) | 186 (79.1%) |
| 5 Years | 95 (100.0%) | 78 (100.0%) |
| 6 to 11 Years | 282 (95.6%) | 327 (100.0%) |
| 12 to 14 Years | 299 (100.0%) | 193 (100.0%) |
| 15 Years | 63 (100.0%) | 73 (100.0%) |
| 16 and 17 Years | 70 (100.0%) | 124 (100.0%) |
| 18 to 24 Years | 356 (77.1%) | 496 (81.0%) |
| 25 to 34 Years | 399 (91.9%) | 305 (94.4%) |
| 35 to 44 Years | 419 (91.7%) | 576 (94.7%) |
| 45 to 54 Years | 461 (97.1%) | 374 (96.6%) |
| 55 to 64 Years | 553 (100.0%) | 593 (96.1%) |
| 65 to 74 Years | 465 (100.0%) | 570 (100.0%) |
| 75 Years and over | 251 (100.0%) | 389 (100.0%) |
| Total | 3,938 (94.7%) | 4,284 (94.4%) |
Income Below Poverty Among Married-Couple Families in Spring Valley Lake
The poverty statistics for married-couple families in Spring Valley Lake show that 0.7% or 13 of the total 1,898 families live below the poverty line. Families with no children have the highest poverty rate of 1.1%, comprising of 13 families. On the other hand, families with 1 or 2 children have the lowest poverty rate of 0.0%, which includes 0 families.
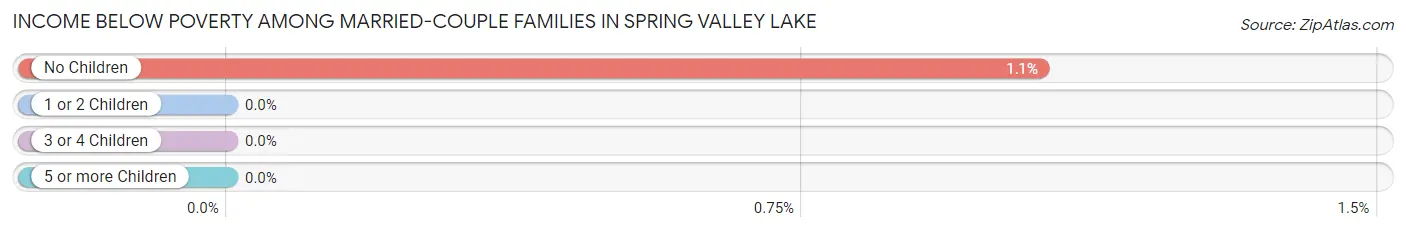
| Children | Above Poverty | Below Poverty |
| No Children | 1,212 (98.9%) | 13 (1.1%) |
| 1 or 2 Children | 459 (100.0%) | 0 (0.0%) |
| 3 or 4 Children | 183 (100.0%) | 0 (0.0%) |
| 5 or more Children | 31 (100.0%) | 0 (0.0%) |
| Total | 1,885 (99.3%) | 13 (0.7%) |
Income Below Poverty Among Single-Parent Households in Spring Valley Lake
According to the poverty data in Spring Valley Lake, 43.2% or 35 single-father households and 10.2% or 32 single-mother households are living below the poverty line. Among single-father households, those with 1 or 2 children have the highest poverty rate, with 35 households (100.0%) experiencing poverty. Likewise, among single-mother households, those with no children have the highest poverty rate, with 32 households (17.2%) falling below the poverty line.
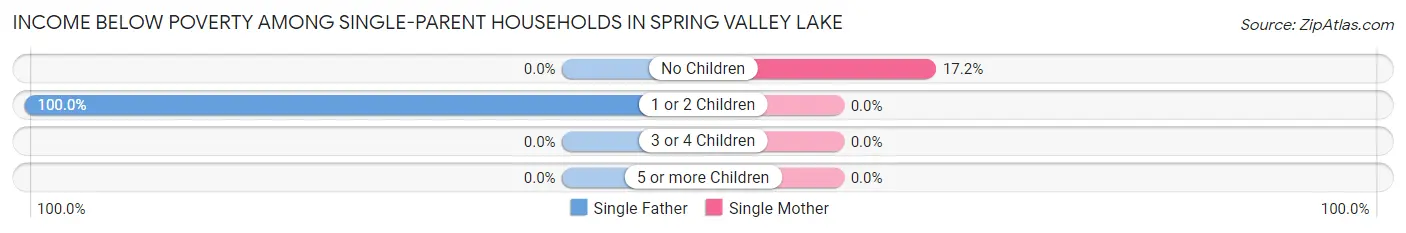
| Children | Single Father | Single Mother |
| No Children | 0 (0.0%) | 32 (17.2%) |
| 1 or 2 Children | 35 (100.0%) | 0 (0.0%) |
| 3 or 4 Children | 0 (0.0%) | 0 (0.0%) |
| 5 or more Children | 0 (0.0%) | 0 (0.0%) |
| Total | 35 (43.2%) | 32 (10.2%) |
Income Below Poverty Among Married-Couple vs Single-Parent Households in Spring Valley Lake
The poverty data for Spring Valley Lake shows that 13 of the married-couple family households (0.7%) and 67 of the single-parent households (17.0%) are living below the poverty level. Within the married-couple family households, those with no children have the highest poverty rate, with 13 households (1.1%) falling below the poverty line. Among the single-parent households, those with 1 or 2 children have the highest poverty rate, with 35 household (26.1%) living below poverty.
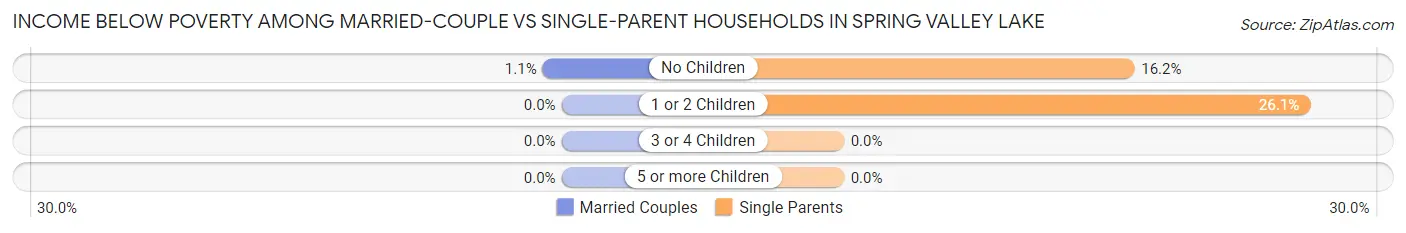
| Children | Married-Couple Families | Single-Parent Households |
| No Children | 13 (1.1%) | 32 (16.2%) |
| 1 or 2 Children | 0 (0.0%) | 35 (26.1%) |
| 3 or 4 Children | 0 (0.0%) | 0 (0.0%) |
| 5 or more Children | 0 (0.0%) | 0 (0.0%) |
| Total | 13 (0.7%) | 67 (17.0%) |
Race in Spring Valley Lake
The most populous races in Spring Valley Lake are White / Caucasian (6,913 | 78.9%), Hispanic or Latino (2,704 | 30.8%), and Two or more Races (684 | 7.8%).
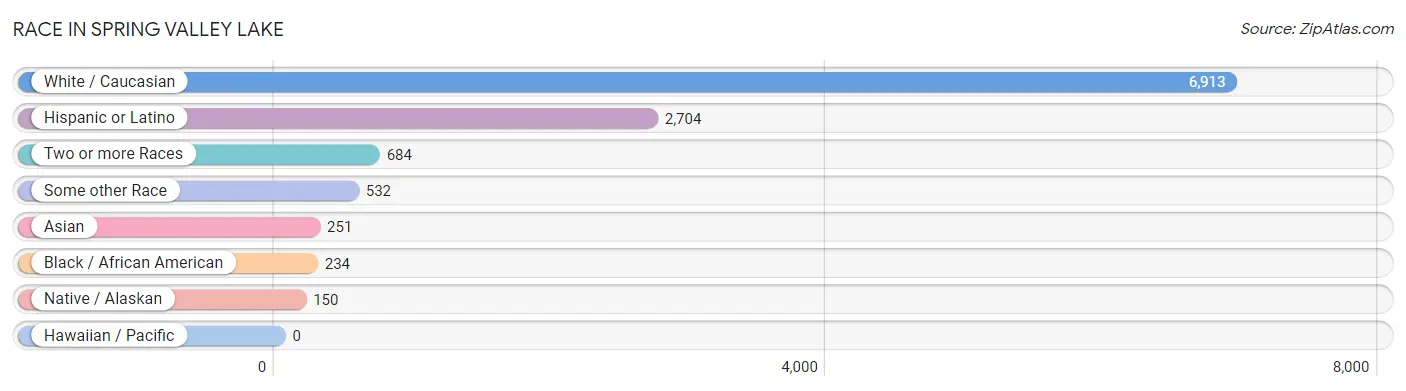
| Race | # Population | % Population |
| Asian | 251 | 2.9% |
| Black / African American | 234 | 2.7% |
| Hawaiian / Pacific | 0 | 0.0% |
| Hispanic or Latino | 2,704 | 30.8% |
| Native / Alaskan | 150 | 1.7% |
| White / Caucasian | 6,913 | 78.9% |
| Two or more Races | 684 | 7.8% |
| Some other Race | 532 | 6.1% |
| Total | 8,764 | 100.0% |
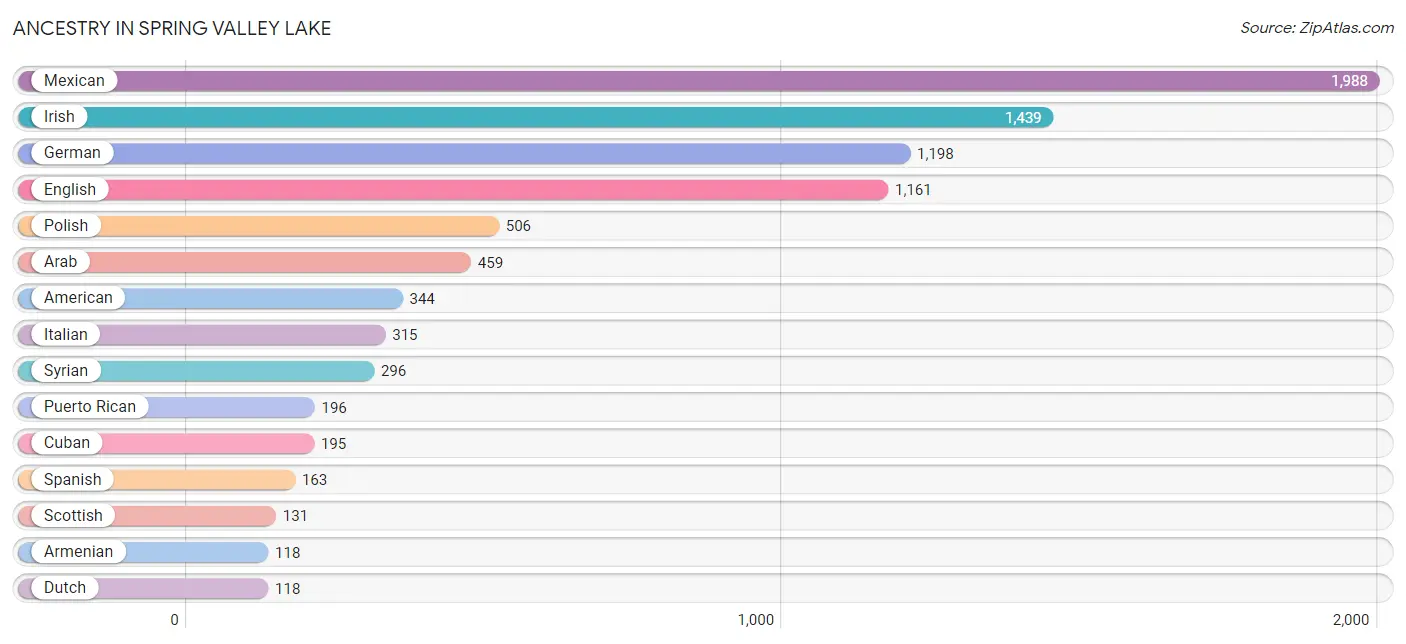
Ancestry in Spring Valley Lake
The most populous ancestries reported in Spring Valley Lake are Mexican (1,988 | 22.7%), Irish (1,439 | 16.4%), German (1,198 | 13.7%), English (1,161 | 13.3%), and Polish (506 | 5.8%), together accounting for 71.8% of all Spring Valley Lake residents.
| Ancestry | # Population | % Population |
| American | 344 | 3.9% |
| Apache | 60 | 0.7% |
| Arab | 459 | 5.2% |
| Armenian | 118 | 1.3% |
| Basque | 31 | 0.4% |
| Burmese | 70 | 0.8% |
| Canadian | 32 | 0.4% |
| Central American | 45 | 0.5% |
| Cherokee | 53 | 0.6% |
| Colombian | 19 | 0.2% |
| Cuban | 195 | 2.2% |
| Danish | 54 | 0.6% |
| Dutch | 118 | 1.3% |
| English | 1,161 | 13.3% |
| European | 95 | 1.1% |
| French | 67 | 0.8% |
| French Canadian | 34 | 0.4% |
| German | 1,198 | 13.7% |
| Honduran | 30 | 0.3% |
| Hungarian | 61 | 0.7% |
| Icelander | 104 | 1.2% |
| Irish | 1,439 | 16.4% |
| Italian | 315 | 3.6% |
| Japanese | 42 | 0.5% |
| Korean | 88 | 1.0% |
| Lithuanian | 60 | 0.7% |
| Mexican | 1,988 | 22.7% |
| Northern European | 90 | 1.0% |
| Norwegian | 44 | 0.5% |
| Polish | 506 | 5.8% |
| Portuguese | 46 | 0.5% |
| Puerto Rican | 196 | 2.2% |
| Russian | 108 | 1.2% |
| Salvadoran | 15 | 0.2% |
| Scandinavian | 17 | 0.2% |
| Scotch-Irish | 92 | 1.1% |
| Scottish | 131 | 1.5% |
| Slovak | 101 | 1.1% |
| South American | 19 | 0.2% |
| Spaniard | 69 | 0.8% |
| Spanish | 163 | 1.9% |
| Swedish | 68 | 0.8% |
| Swiss | 24 | 0.3% |
| Syrian | 296 | 3.4% |
| Thai | 51 | 0.6% |
| Ukrainian | 18 | 0.2% |
| Welsh | 29 | 0.3% |
| Yaqui | 61 | 0.7% | View All 48 Rows |
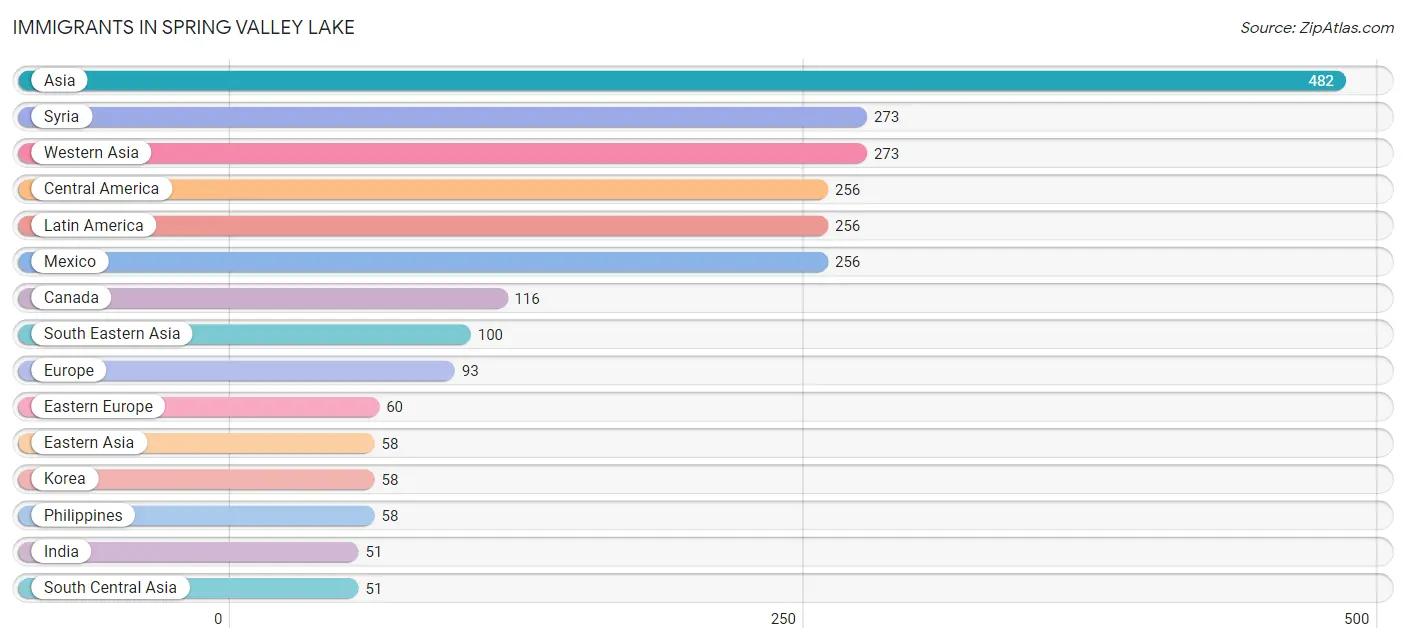
Immigrants in Spring Valley Lake
The most numerous immigrant groups reported in Spring Valley Lake came from Asia (482 | 5.5%), Syria (273 | 3.1%), Western Asia (273 | 3.1%), Central America (256 | 2.9%), and Latin America (256 | 2.9%), together accounting for 17.6% of all Spring Valley Lake residents.
| Immigration Origin | # Population | % Population |
| Asia | 482 | 5.5% |
| Cambodia | 42 | 0.5% |
| Canada | 116 | 1.3% |
| Central America | 256 | 2.9% |
| Eastern Asia | 58 | 0.7% |
| Eastern Europe | 60 | 0.7% |
| Europe | 93 | 1.1% |
| India | 51 | 0.6% |
| Korea | 58 | 0.7% |
| Latin America | 256 | 2.9% |
| Mexico | 256 | 2.9% |
| Northern Europe | 33 | 0.4% |
| Philippines | 58 | 0.7% |
| Poland | 13 | 0.2% |
| Russia | 29 | 0.3% |
| South Central Asia | 51 | 0.6% |
| South Eastern Asia | 100 | 1.1% |
| Syria | 273 | 3.1% |
| Ukraine | 18 | 0.2% |
| Western Asia | 273 | 3.1% | View All 20 Rows |
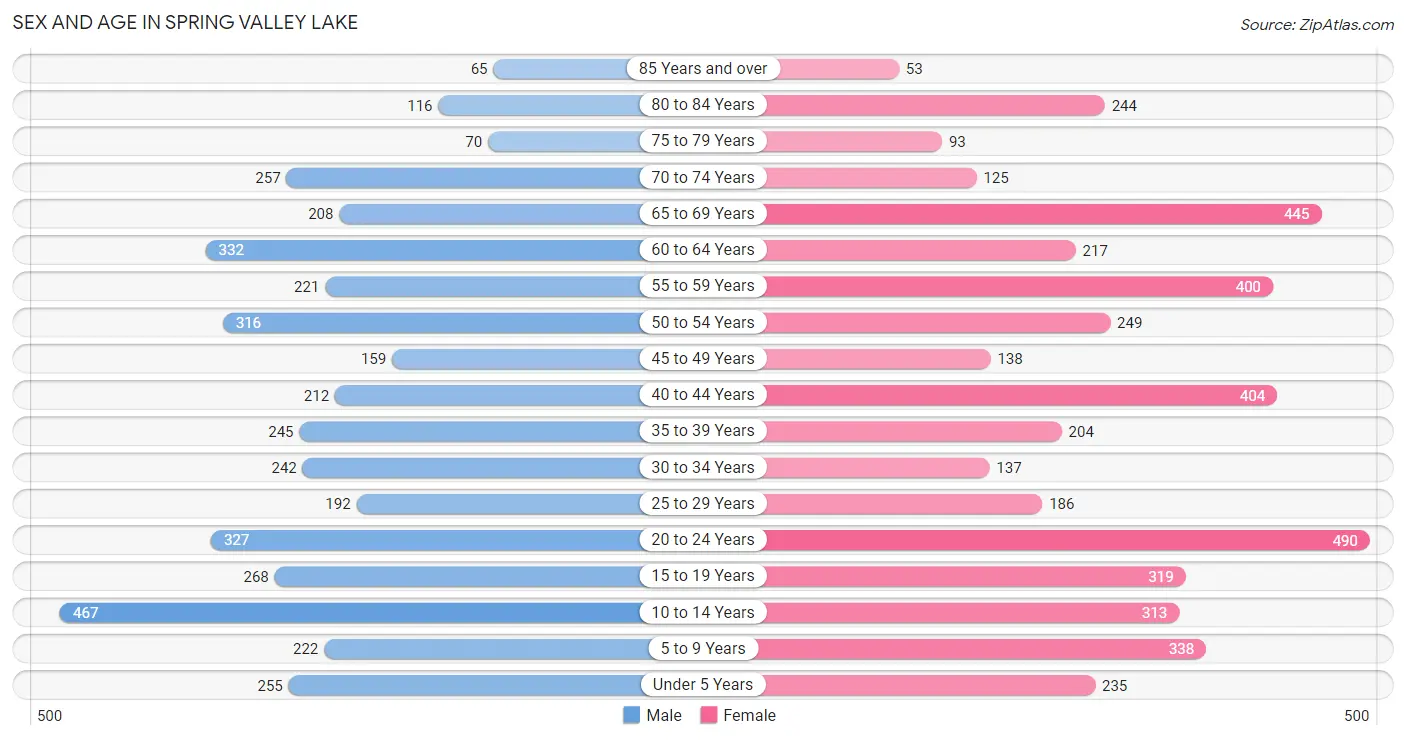
Sex and Age in Spring Valley Lake
Sex and Age in Spring Valley Lake
The most populous age groups in Spring Valley Lake are 10 to 14 Years (467 | 11.2%) for men and 20 to 24 Years (490 | 10.7%) for women.
| Age Bracket | Male | Female |
| Under 5 Years | 255 (6.1%) | 235 (5.1%) |
| 5 to 9 Years | 222 (5.3%) | 338 (7.4%) |
| 10 to 14 Years | 467 (11.2%) | 313 (6.8%) |
| 15 to 19 Years | 268 (6.4%) | 319 (7.0%) |
| 20 to 24 Years | 327 (7.8%) | 490 (10.7%) |
| 25 to 29 Years | 192 (4.6%) | 186 (4.1%) |
| 30 to 34 Years | 242 (5.8%) | 137 (3.0%) |
| 35 to 39 Years | 245 (5.9%) | 204 (4.4%) |
| 40 to 44 Years | 212 (5.1%) | 404 (8.8%) |
| 45 to 49 Years | 159 (3.8%) | 138 (3.0%) |
| 50 to 54 Years | 316 (7.6%) | 249 (5.4%) |
| 55 to 59 Years | 221 (5.3%) | 400 (8.7%) |
| 60 to 64 Years | 332 (8.0%) | 217 (4.7%) |
| 65 to 69 Years | 208 (5.0%) | 445 (9.7%) |
| 70 to 74 Years | 257 (6.2%) | 125 (2.7%) |
| 75 to 79 Years | 70 (1.7%) | 93 (2.0%) |
| 80 to 84 Years | 116 (2.8%) | 244 (5.3%) |
| 85 Years and over | 65 (1.6%) | 53 (1.1%) |
| Total | 4,174 (100.0%) | 4,590 (100.0%) |
Families and Households in Spring Valley Lake
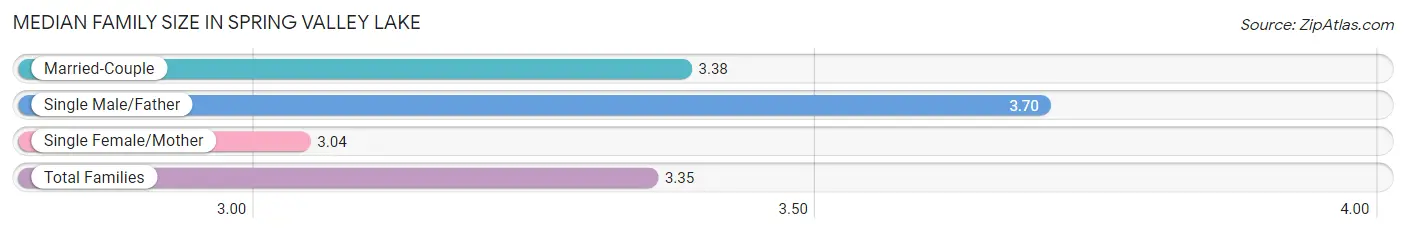
Median Family Size in Spring Valley Lake
The median family size in Spring Valley Lake is 3.35 persons per family, with single male/father families (81 | 3.5%) accounting for the largest median family size of 3.7 persons per family. On the other hand, single female/mother families (313 | 13.7%) represent the smallest median family size with 3.04 persons per family.
| Family Type | # Families | Family Size |
| Married-Couple | 1,898 (82.8%) | 3.38 |
| Single Male/Father | 81 (3.5%) | 3.70 |
| Single Female/Mother | 313 (13.7%) | 3.04 |
| Total Families | 2,292 (100.0%) | 3.35 |
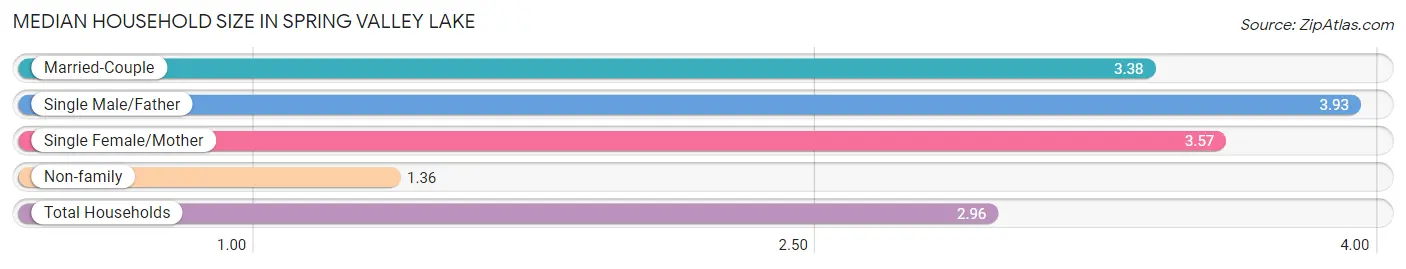
Median Household Size in Spring Valley Lake
The median household size in Spring Valley Lake is 2.96 persons per household, with single male/father households (81 | 2.7%) accounting for the largest median household size of 3.93 persons per household. non-family households (666 | 22.5%) represent the smallest median household size with 1.36 persons per household.
| Household Type | # Households | Household Size |
| Married-Couple | 1,898 (64.2%) | 3.38 |
| Single Male/Father | 81 (2.7%) | 3.93 |
| Single Female/Mother | 313 (10.6%) | 3.57 |
| Non-family | 666 (22.5%) | 1.36 |
| Total Households | 2,958 (100.0%) | 2.96 |
Household Size by Marriage Status in Spring Valley Lake
Out of a total of 2,958 households in Spring Valley Lake, 2,292 (77.5%) are family households, while 666 (22.5%) are nonfamily households. The most numerous type of family households are 2-person households, comprising 930, and the most common type of nonfamily households are 1-person households, comprising 473.
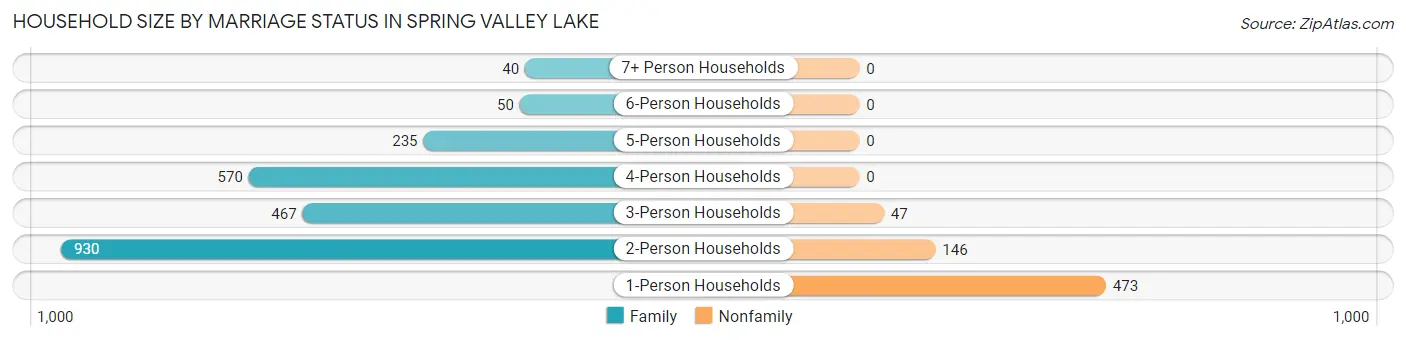
| Household Size | Family Households | Nonfamily Households |
| 1-Person Households | - | 473 (16.0%) |
| 2-Person Households | 930 (31.4%) | 146 (4.9%) |
| 3-Person Households | 467 (15.8%) | 47 (1.6%) |
| 4-Person Households | 570 (19.3%) | 0 (0.0%) |
| 5-Person Households | 235 (7.9%) | 0 (0.0%) |
| 6-Person Households | 50 (1.7%) | 0 (0.0%) |
| 7+ Person Households | 40 (1.3%) | 0 (0.0%) |
| Total | 2,292 (77.5%) | 666 (22.5%) |
Female Fertility in Spring Valley Lake
Fertility by Age in Spring Valley Lake
Average fertility rate in Spring Valley Lake is 54.0 births per 1,000 women. Women in the age bracket of 20 to 34 years have the highest fertility rate with 69.0 births per 1,000 women. Women in the age bracket of 20 to 34 years acount for 53.3% of all women with births.
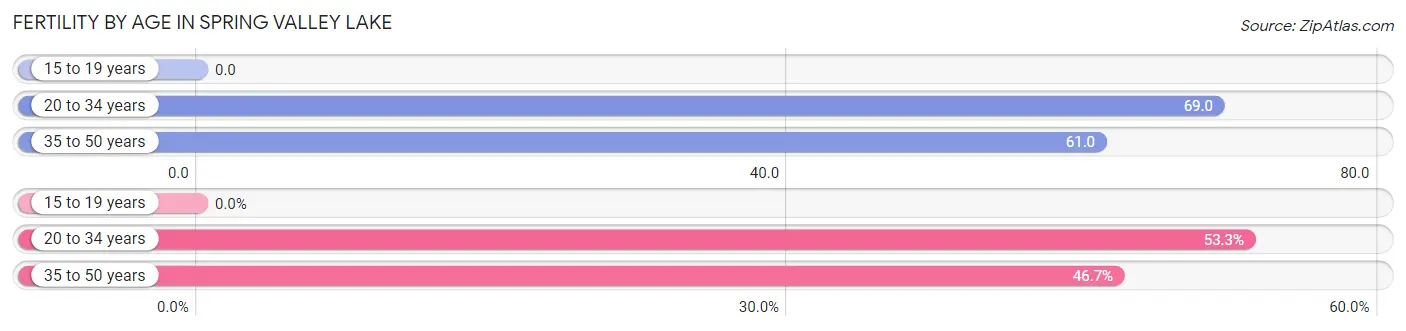
| Age Bracket | Women with Births | Births / 1,000 Women |
| 15 to 19 years | 0 (0.0%) | 0.0 |
| 20 to 34 years | 56 (53.3%) | 69.0 |
| 35 to 50 years | 49 (46.7%) | 61.0 |
| Total | 105 (100.0%) | 54.0 |
Fertility by Age by Marriage Status in Spring Valley Lake
82.9% of women with births (105) in Spring Valley Lake are married. The highest percentage of unmarried women with births falls into 20 to 34 years age bracket with 32.1% of them unmarried at the time of birth, while the lowest percentage of unmarried women with births belong to 35 to 50 years age bracket with 0.0% of them unmarried.
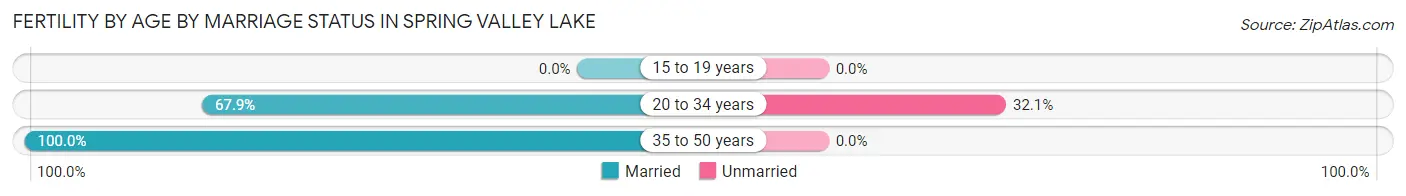
| Age Bracket | Married | Unmarried |
| 15 to 19 years | 0 (0.0%) | 0 (0.0%) |
| 20 to 34 years | 38 (67.9%) | 18 (32.1%) |
| 35 to 50 years | 49 (100.0%) | 0 (0.0%) |
| Total | 87 (82.9%) | 18 (17.1%) |
Fertility by Education in Spring Valley Lake
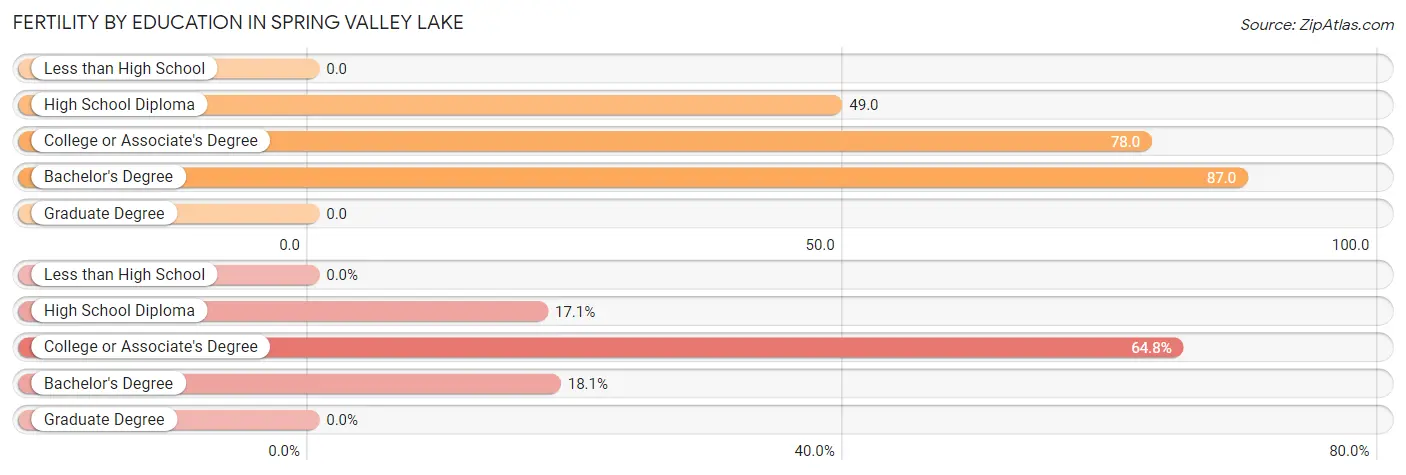
| Educational Attainment | Women with Births | Births / 1,000 Women |
| Less than High School | 0 (0.0%) | 0.0 |
| High School Diploma | 18 (17.1%) | 49.0 |
| College or Associate's Degree | 68 (64.8%) | 78.0 |
| Bachelor's Degree | 19 (18.1%) | 87.0 |
| Graduate Degree | 0 (0.0%) | 0.0 |
| Total | 105 (100.0%) | 54.0 |
Fertility by Education by Marriage Status in Spring Valley Lake
17.1% of women with births in Spring Valley Lake are unmarried. Women with the educational attainment of college or associate's degree are most likely to be married with 100.0% of them married at childbirth, while women with the educational attainment of high school diploma are least likely to be married with 100.0% of them unmarried at childbirth.
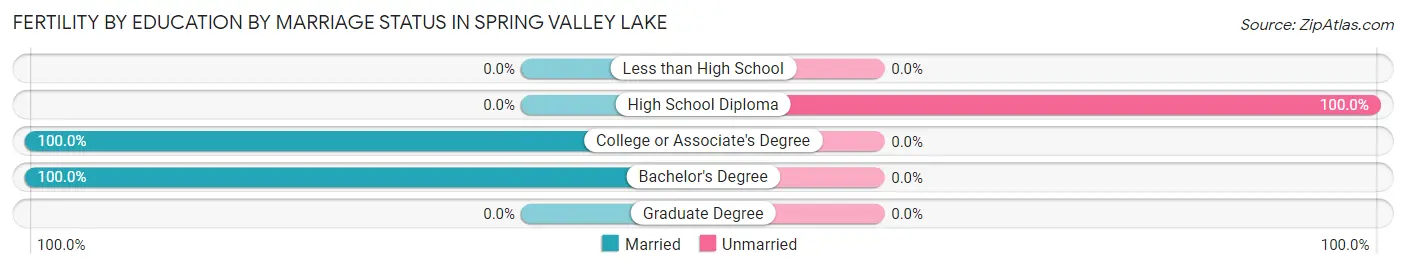
| Educational Attainment | Married | Unmarried |
| Less than High School | 0 (0.0%) | 0 (0.0%) |
| High School Diploma | 0 (0.0%) | 18 (100.0%) |
| College or Associate's Degree | 68 (100.0%) | 0 (0.0%) |
| Bachelor's Degree | 19 (100.0%) | 0 (0.0%) |
| Graduate Degree | 0 (0.0%) | 0 (0.0%) |
| Total | 87 (82.9%) | 18 (17.1%) |
Employment Characteristics in Spring Valley Lake
Employment by Class of Employer in Spring Valley Lake
Among the 3,497 employed individuals in Spring Valley Lake, private company employees (2,022 | 57.8%), local government employees (511 | 14.6%), and self-employed (incorporated) (321 | 9.2%) make up the most common classes of employment.
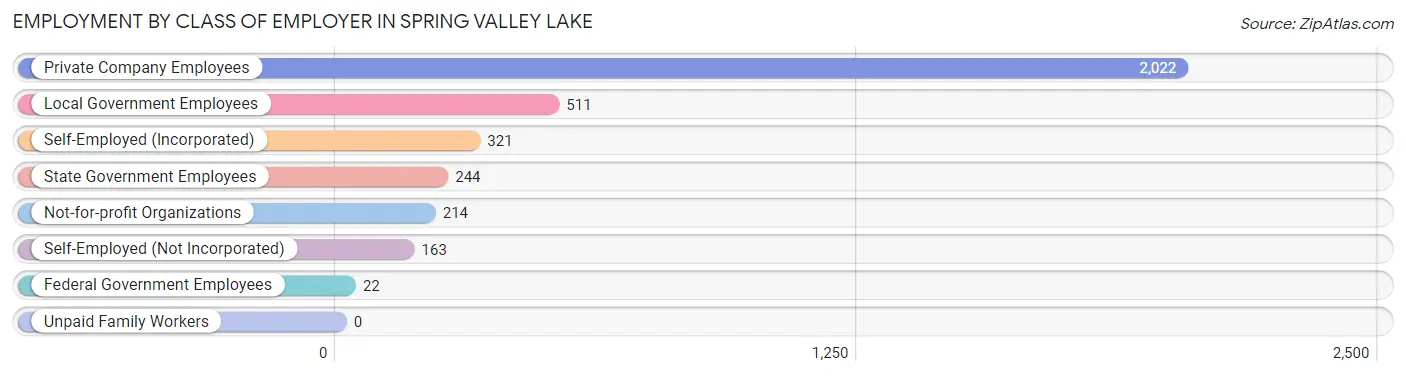
| Employer Class | # Employees | % Employees |
| Private Company Employees | 2,022 | 57.8% |
| Self-Employed (Incorporated) | 321 | 9.2% |
| Self-Employed (Not Incorporated) | 163 | 4.7% |
| Not-for-profit Organizations | 214 | 6.1% |
| Local Government Employees | 511 | 14.6% |
| State Government Employees | 244 | 7.0% |
| Federal Government Employees | 22 | 0.6% |
| Unpaid Family Workers | 0 | 0.0% |
| Total | 3,497 | 100.0% |
Employment Status by Age in Spring Valley Lake
According to the labor force statistics for Spring Valley Lake, out of the total population over 16 years of age (6,798), 55.3% or 3,759 individuals are in the labor force, with 6.2% or 233 of them unemployed. The age group with the highest labor force participation rate is 45 to 54 years, with 96.4% or 831 individuals in the labor force. Within the labor force, the 65 to 74 years age range has the highest percentage of unemployed individuals, with 24.9% or 47 of them being unemployed.
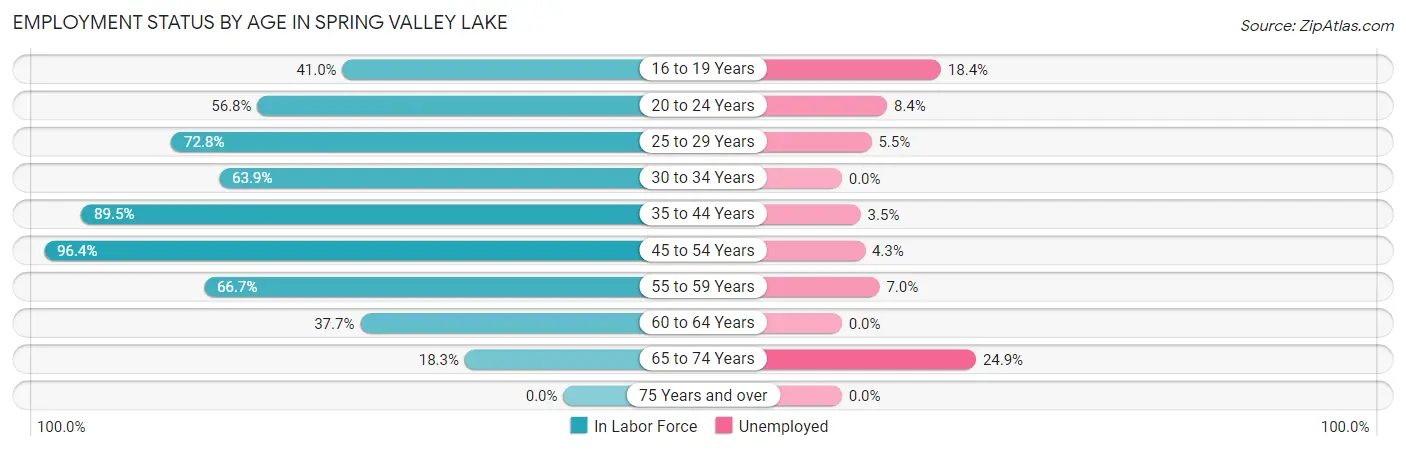
| Age Bracket | In Labor Force | Unemployed |
| 16 to 19 Years | 185 (41.0%) | 34 (18.4%) |
| 20 to 24 Years | 464 (56.8%) | 39 (8.4%) |
| 25 to 29 Years | 275 (72.8%) | 15 (5.5%) |
| 30 to 34 Years | 242 (63.9%) | 0 (0.0%) |
| 35 to 44 Years | 953 (89.5%) | 33 (3.5%) |
| 45 to 54 Years | 831 (96.4%) | 36 (4.3%) |
| 55 to 59 Years | 414 (66.7%) | 29 (7.0%) |
| 60 to 64 Years | 207 (37.7%) | 0 (0.0%) |
| 65 to 74 Years | 189 (18.3%) | 47 (24.9%) |
| 75 Years and over | 0 (0.0%) | 0 (0.0%) |
| Total | 3,759 (55.3%) | 233 (6.2%) |
Employment Status by Educational Attainment in Spring Valley Lake
According to labor force statistics for Spring Valley Lake, 75.8% of individuals (2,921) out of the total population between 25 and 64 years of age (3,854) are in the labor force, with 3.9% or 114 of them being unemployed. The group with the highest labor force participation rate are those with the educational attainment of bachelor's degree or higher, with 86.7% or 1,019 individuals in the labor force. Within the labor force, individuals with high school diploma education have the highest percentage of unemployment, with 7.3% or 36 of them being unemployed.
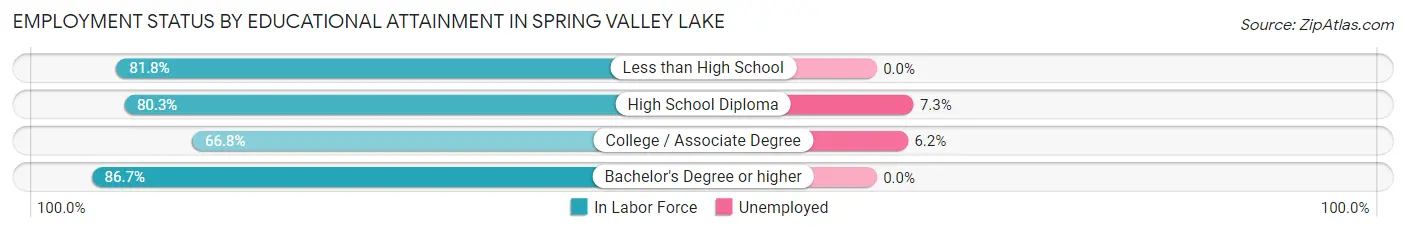
| Educational Attainment | In Labor Force | Unemployed |
| Less than High School | 166 (81.8%) | 0 (0.0%) |
| High School Diploma | 492 (80.3%) | 45 (7.3%) |
| College / Associate Degree | 1,244 (66.8%) | 116 (6.2%) |
| Bachelor's Degree or higher | 1,019 (86.7%) | 0 (0.0%) |
| Total | 2,921 (75.8%) | 150 (3.9%) |
Employment Occupations by Sex in Spring Valley Lake
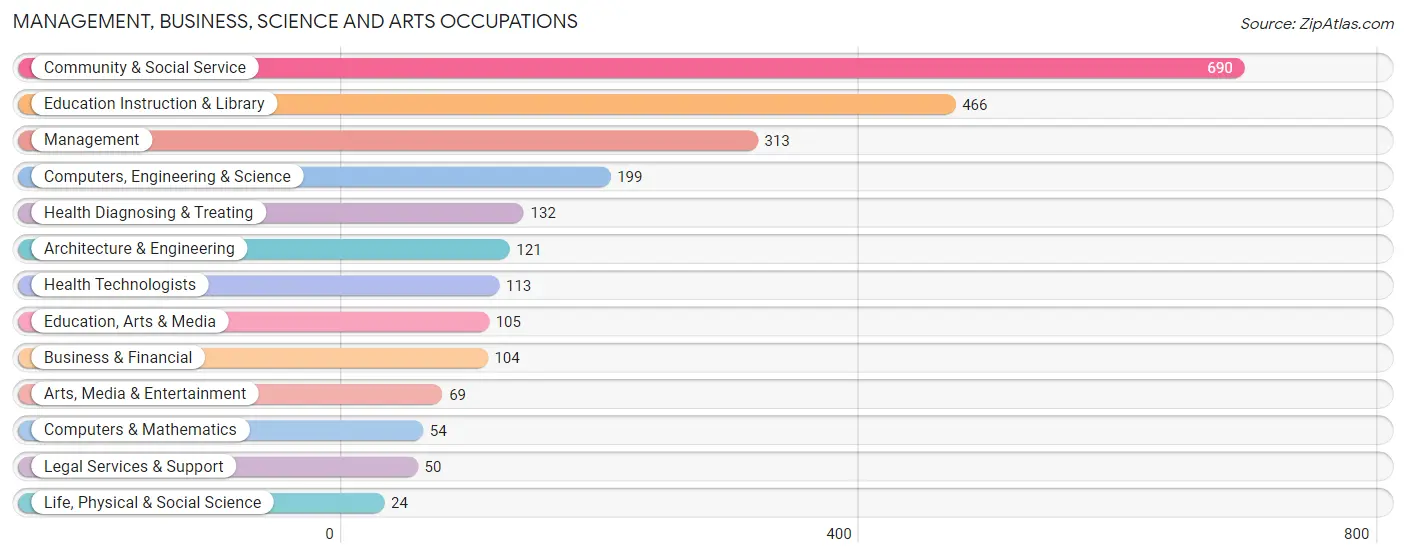
Management, Business, Science and Arts Occupations
The most common Management, Business, Science and Arts occupations in Spring Valley Lake are Community & Social Service (690 | 19.6%), Education Instruction & Library (466 | 13.2%), Management (313 | 8.9%), Computers, Engineering & Science (199 | 5.6%), and Health Diagnosing & Treating (132 | 3.7%).
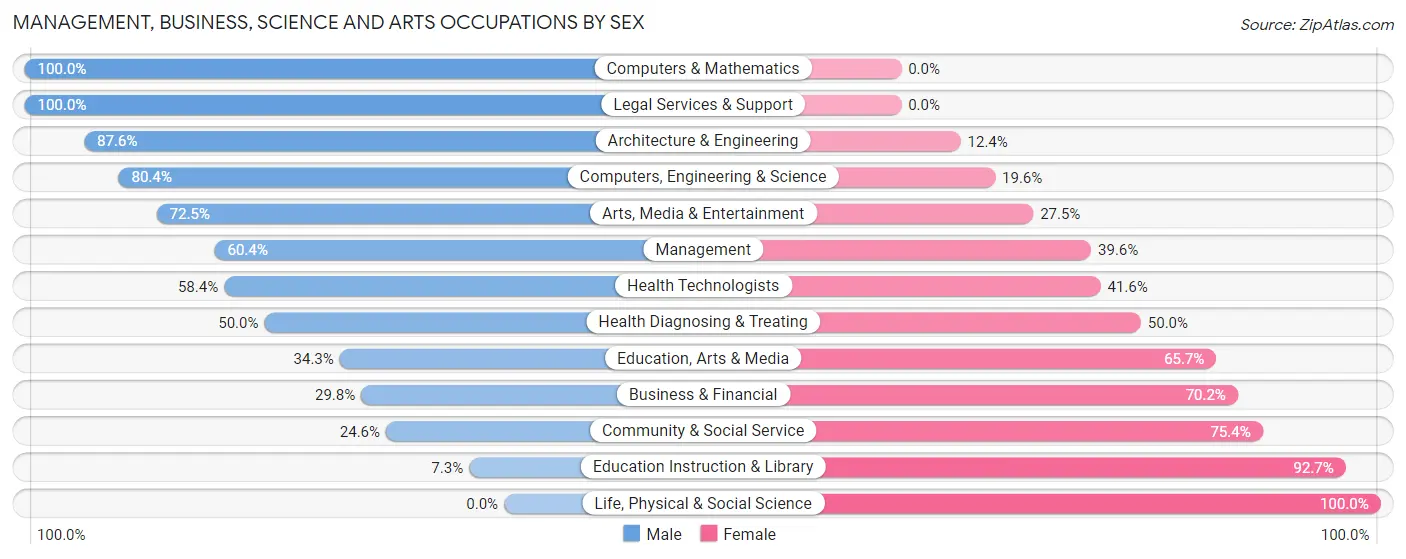
Management, Business, Science and Arts Occupations by Sex
Within the Management, Business, Science and Arts occupations in Spring Valley Lake, the most male-oriented occupations are Computers & Mathematics (100.0%), Legal Services & Support (100.0%), and Architecture & Engineering (87.6%), while the most female-oriented occupations are Life, Physical & Social Science (100.0%), Education Instruction & Library (92.7%), and Community & Social Service (75.4%).
| Occupation | Male | Female |
| Management | 189 (60.4%) | 124 (39.6%) |
| Business & Financial | 31 (29.8%) | 73 (70.2%) |
| Computers, Engineering & Science | 160 (80.4%) | 39 (19.6%) |
| Computers & Mathematics | 54 (100.0%) | 0 (0.0%) |
| Architecture & Engineering | 106 (87.6%) | 15 (12.4%) |
| Life, Physical & Social Science | 0 (0.0%) | 24 (100.0%) |
| Community & Social Service | 170 (24.6%) | 520 (75.4%) |
| Education, Arts & Media | 36 (34.3%) | 69 (65.7%) |
| Legal Services & Support | 50 (100.0%) | 0 (0.0%) |
| Education Instruction & Library | 34 (7.3%) | 432 (92.7%) |
| Arts, Media & Entertainment | 50 (72.5%) | 19 (27.5%) |
| Health Diagnosing & Treating | 66 (50.0%) | 66 (50.0%) |
| Health Technologists | 66 (58.4%) | 47 (41.6%) |
| Total (Category) | 616 (42.8%) | 822 (57.2%) |
| Total (Overall) | 1,802 (51.1%) | 1,725 (48.9%) |
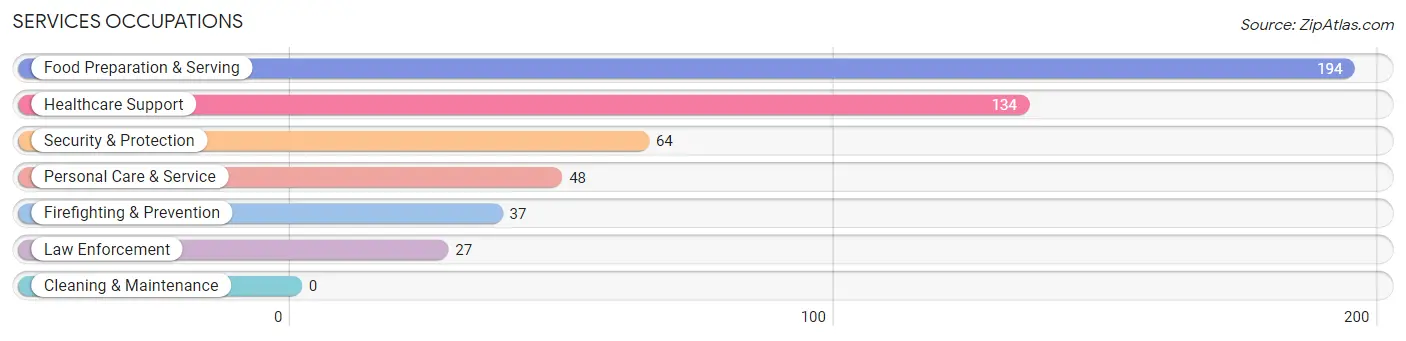
Services Occupations
The most common Services occupations in Spring Valley Lake are Food Preparation & Serving (194 | 5.5%), Healthcare Support (134 | 3.8%), Security & Protection (64 | 1.8%), Personal Care & Service (48 | 1.4%), and Firefighting & Prevention (37 | 1.1%).
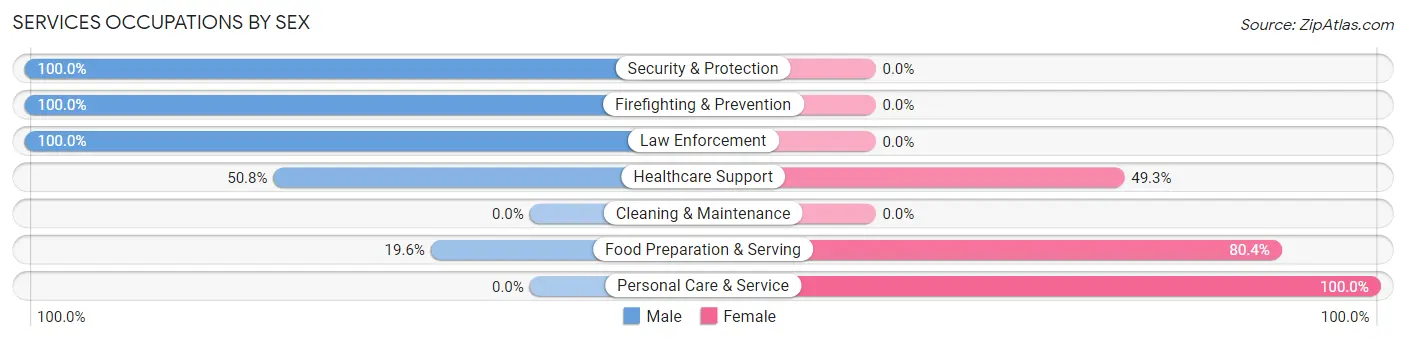
Services Occupations by Sex
Within the Services occupations in Spring Valley Lake, the most male-oriented occupations are Security & Protection (100.0%), Firefighting & Prevention (100.0%), and Law Enforcement (100.0%), while the most female-oriented occupations are Personal Care & Service (100.0%), Food Preparation & Serving (80.4%), and Healthcare Support (49.2%).
| Occupation | Male | Female |
| Healthcare Support | 68 (50.7%) | 66 (49.2%) |
| Security & Protection | 64 (100.0%) | 0 (0.0%) |
| Firefighting & Prevention | 37 (100.0%) | 0 (0.0%) |
| Law Enforcement | 27 (100.0%) | 0 (0.0%) |
| Food Preparation & Serving | 38 (19.6%) | 156 (80.4%) |
| Cleaning & Maintenance | 0 (0.0%) | 0 (0.0%) |
| Personal Care & Service | 0 (0.0%) | 48 (100.0%) |
| Total (Category) | 170 (38.6%) | 270 (61.4%) |
| Total (Overall) | 1,802 (51.1%) | 1,725 (48.9%) |
Sales and Office Occupations
The most common Sales and Office occupations in Spring Valley Lake are Sales & Related (547 | 15.5%), and Office & Administration (286 | 8.1%).
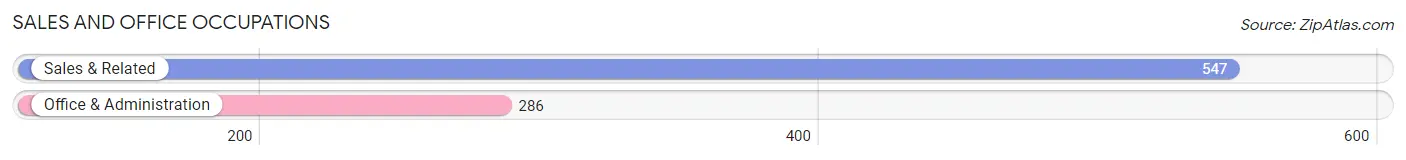
Sales and Office Occupations by Sex
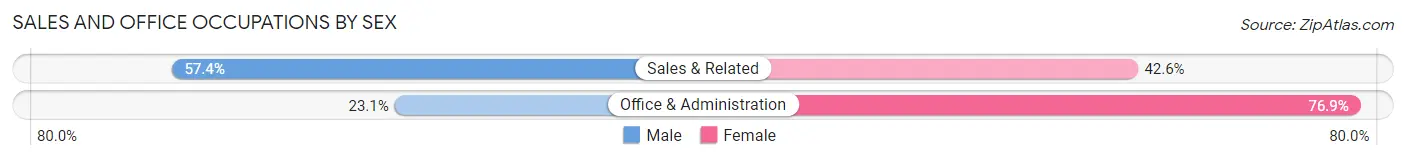
| Occupation | Male | Female |
| Sales & Related | 314 (57.4%) | 233 (42.6%) |
| Office & Administration | 66 (23.1%) | 220 (76.9%) |
| Total (Category) | 380 (45.6%) | 453 (54.4%) |
| Total (Overall) | 1,802 (51.1%) | 1,725 (48.9%) |
Natural Resources, Construction and Maintenance Occupations
The most common Natural Resources, Construction and Maintenance occupations in Spring Valley Lake are Construction & Extraction (161 | 4.6%), and Installation, Maintenance & Repair (129 | 3.7%).
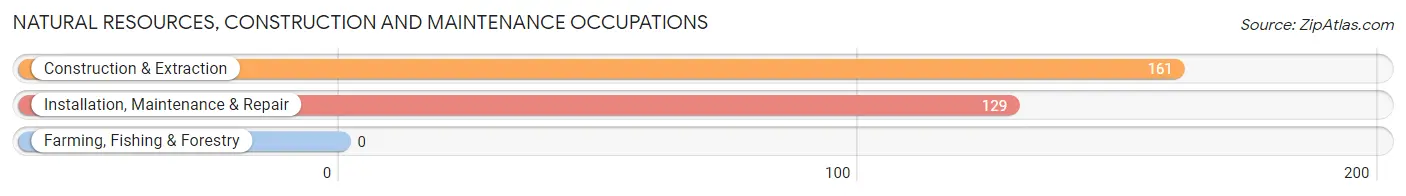
Natural Resources, Construction and Maintenance Occupations by Sex
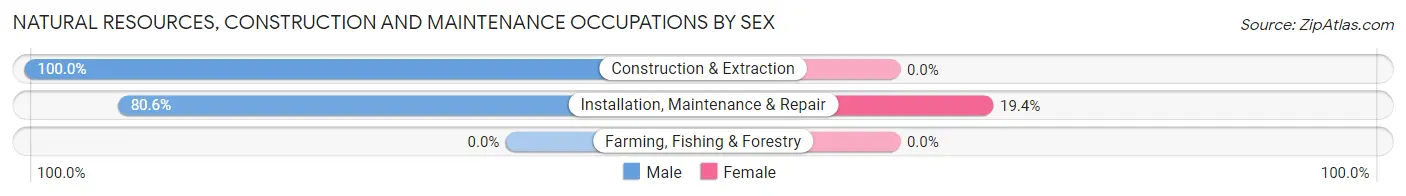
| Occupation | Male | Female |
| Farming, Fishing & Forestry | 0 (0.0%) | 0 (0.0%) |
| Construction & Extraction | 161 (100.0%) | 0 (0.0%) |
| Installation, Maintenance & Repair | 104 (80.6%) | 25 (19.4%) |
| Total (Category) | 265 (91.4%) | 25 (8.6%) |
| Total (Overall) | 1,802 (51.1%) | 1,725 (48.9%) |
Production, Transportation and Moving Occupations
The most common Production, Transportation and Moving occupations in Spring Valley Lake are Transportation (202 | 5.7%), Material Moving (167 | 4.7%), and Production (157 | 4.4%).
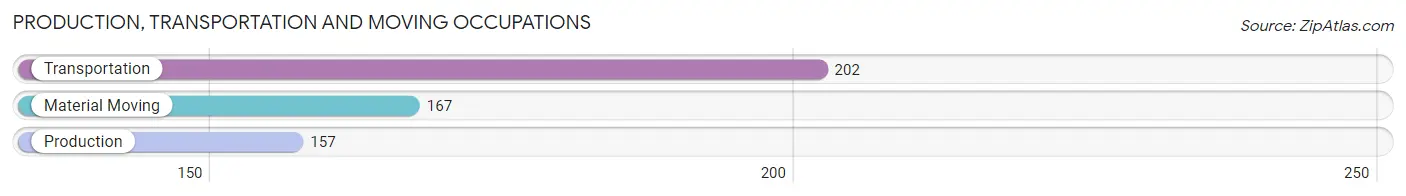
Production, Transportation and Moving Occupations by Sex
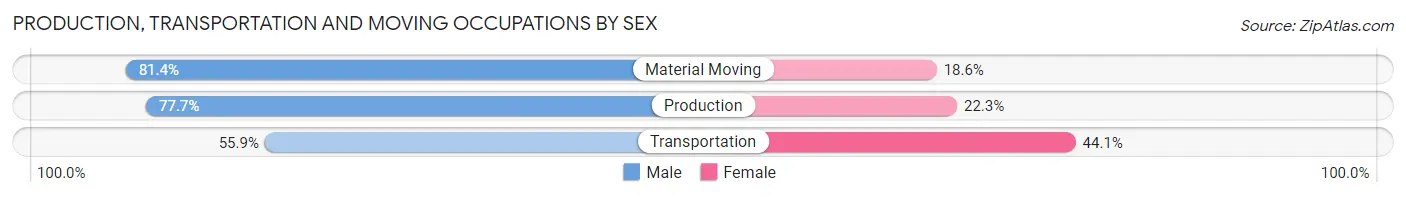
| Occupation | Male | Female |
| Production | 122 (77.7%) | 35 (22.3%) |
| Transportation | 113 (55.9%) | 89 (44.1%) |
| Material Moving | 136 (81.4%) | 31 (18.6%) |
| Total (Category) | 371 (70.5%) | 155 (29.5%) |
| Total (Overall) | 1,802 (51.1%) | 1,725 (48.9%) |
Employment Industries by Sex in Spring Valley Lake
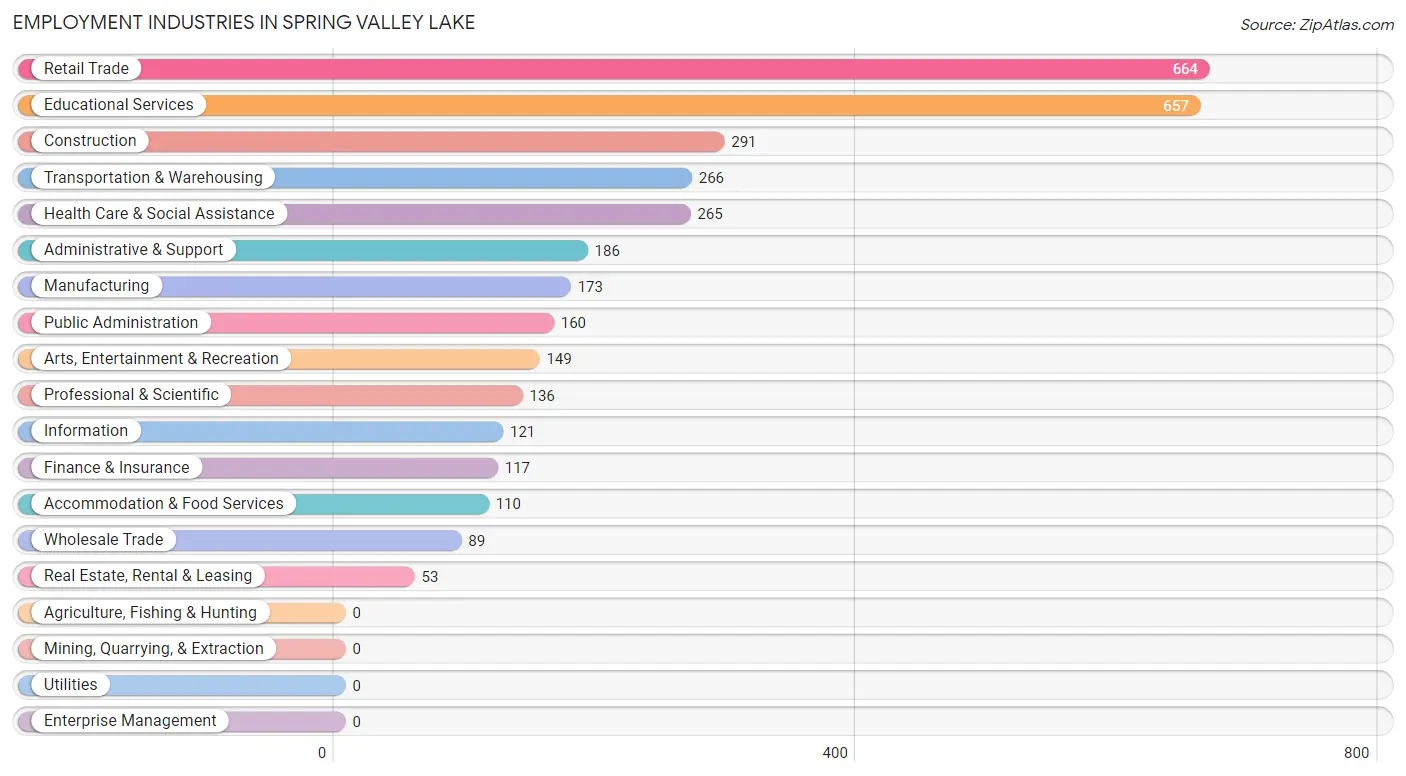
Employment Industries in Spring Valley Lake
The major employment industries in Spring Valley Lake include Retail Trade (664 | 18.8%), Educational Services (657 | 18.6%), Construction (291 | 8.3%), Transportation & Warehousing (266 | 7.5%), and Health Care & Social Assistance (265 | 7.5%).
Employment Industries by Sex in Spring Valley Lake
The Spring Valley Lake industries that see more men than women are Manufacturing (100.0%), Real Estate, Rental & Leasing (100.0%), and Professional & Scientific (89.0%), whereas the industries that tend to have a higher number of women are Accommodation & Food Services (100.0%), Educational Services (88.0%), and Public Administration (83.1%).
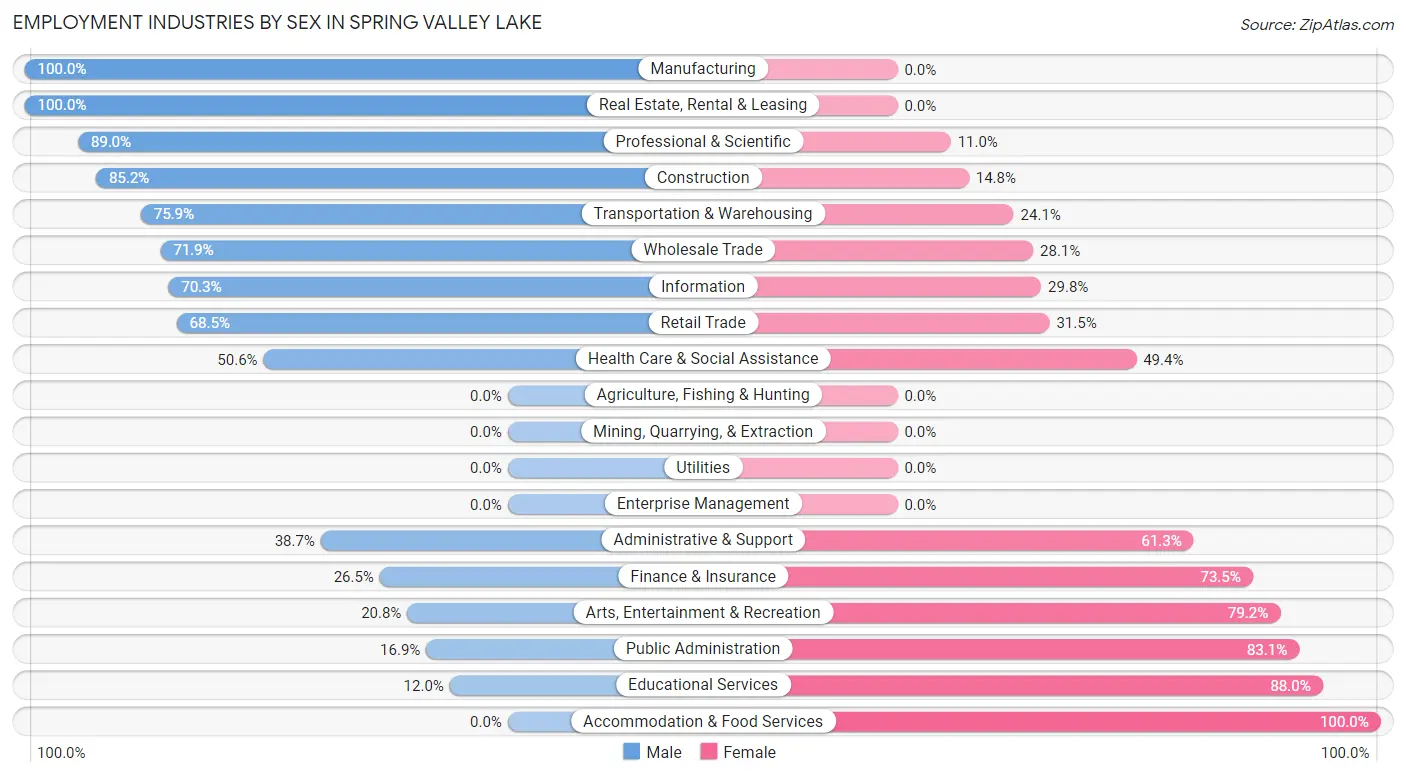
| Industry | Male | Female |
| Agriculture, Fishing & Hunting | 0 (0.0%) | 0 (0.0%) |
| Mining, Quarrying, & Extraction | 0 (0.0%) | 0 (0.0%) |
| Construction | 248 (85.2%) | 43 (14.8%) |
| Manufacturing | 173 (100.0%) | 0 (0.0%) |
| Wholesale Trade | 64 (71.9%) | 25 (28.1%) |
| Retail Trade | 455 (68.5%) | 209 (31.5%) |
| Transportation & Warehousing | 202 (75.9%) | 64 (24.1%) |
| Utilities | 0 (0.0%) | 0 (0.0%) |
| Information | 85 (70.3%) | 36 (29.7%) |
| Finance & Insurance | 31 (26.5%) | 86 (73.5%) |
| Real Estate, Rental & Leasing | 53 (100.0%) | 0 (0.0%) |
| Professional & Scientific | 121 (89.0%) | 15 (11.0%) |
| Enterprise Management | 0 (0.0%) | 0 (0.0%) |
| Administrative & Support | 72 (38.7%) | 114 (61.3%) |
| Educational Services | 79 (12.0%) | 578 (88.0%) |
| Health Care & Social Assistance | 134 (50.6%) | 131 (49.4%) |
| Arts, Entertainment & Recreation | 31 (20.8%) | 118 (79.2%) |
| Accommodation & Food Services | 0 (0.0%) | 110 (100.0%) |
| Public Administration | 27 (16.9%) | 133 (83.1%) |
| Total | 1,802 (51.1%) | 1,725 (48.9%) |
Education in Spring Valley Lake
School Enrollment in Spring Valley Lake
The most common levels of schooling among the 2,599 students in Spring Valley Lake are college / undergraduate (773 | 29.7%), middle school (553 | 21.3%), and elementary school (476 | 18.3%).
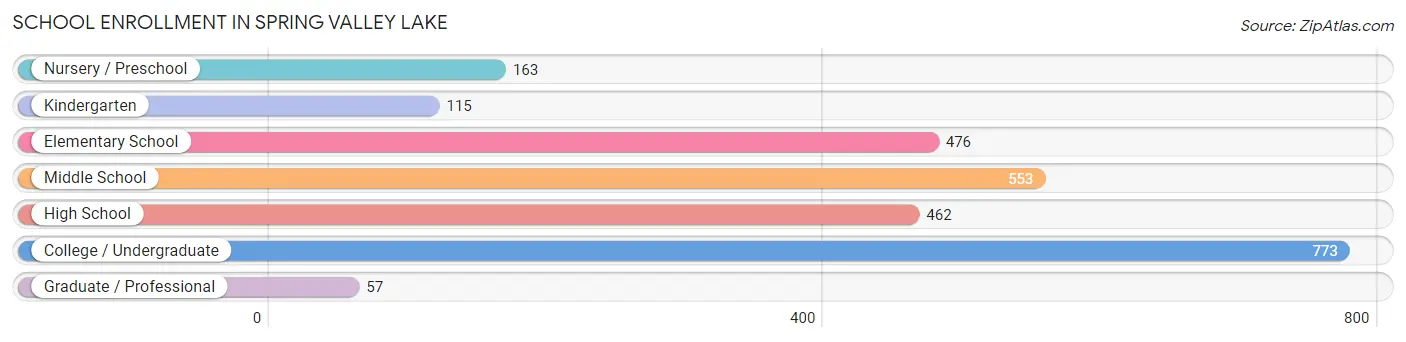
| School Level | # Students | % Students |
| Nursery / Preschool | 163 | 6.3% |
| Kindergarten | 115 | 4.4% |
| Elementary School | 476 | 18.3% |
| Middle School | 553 | 21.3% |
| High School | 462 | 17.8% |
| College / Undergraduate | 773 | 29.7% |
| Graduate / Professional | 57 | 2.2% |
| Total | 2,599 | 100.0% |
School Enrollment by Age by Funding Source in Spring Valley Lake
Out of a total of 2,599 students who are enrolled in schools in Spring Valley Lake, 224 (8.6%) attend a private institution, while the remaining 2,375 (91.4%) are enrolled in public schools. The age group of 35 years and over has the highest likelihood of being enrolled in private schools, with 35 (52.2% in the age bracket) enrolled. Conversely, the age group of 5 to 9 year old has the lowest likelihood of being enrolled in a private school, with 560 (100.0% in the age bracket) attending a public institution.
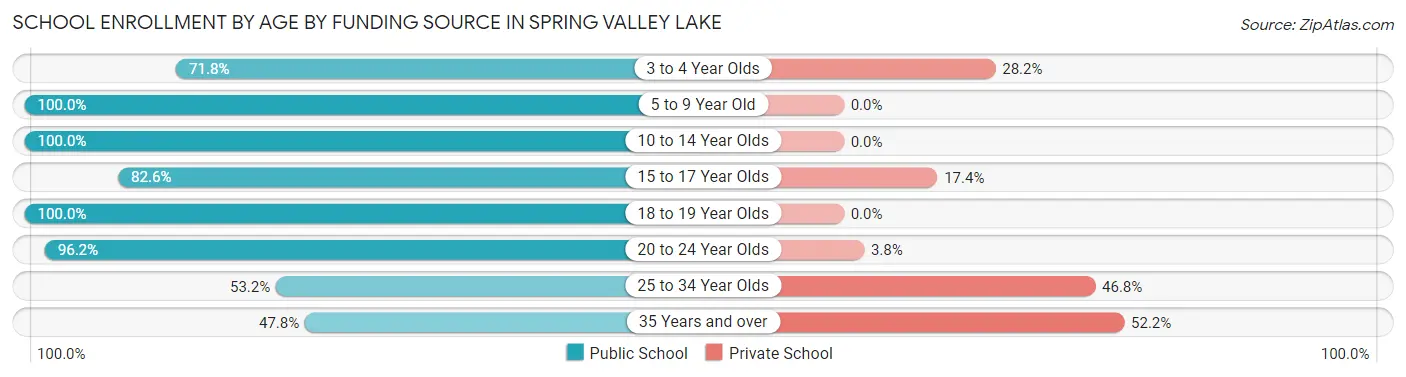
| Age Bracket | Public School | Private School |
| 3 to 4 Year Olds | 61 (71.8%) | 24 (28.2%) |
| 5 to 9 Year Old | 560 (100.0%) | 0 (0.0%) |
| 10 to 14 Year Olds | 767 (100.0%) | 0 (0.0%) |
| 15 to 17 Year Olds | 251 (82.6%) | 53 (17.4%) |
| 18 to 19 Year Olds | 188 (100.0%) | 0 (0.0%) |
| 20 to 24 Year Olds | 407 (96.2%) | 16 (3.8%) |
| 25 to 34 Year Olds | 109 (53.2%) | 96 (46.8%) |
| 35 Years and over | 32 (47.8%) | 35 (52.2%) |
| Total | 2,375 (91.4%) | 224 (8.6%) |
Educational Attainment by Field of Study in Spring Valley Lake
Education (304 | 17.8%), bio, nature & agricultural (195 | 11.4%), liberal arts & history (192 | 11.3%), social sciences (191 | 11.2%), and business (185 | 10.8%) are the most common fields of study among 1,705 individuals in Spring Valley Lake who have obtained a bachelor's degree or higher.
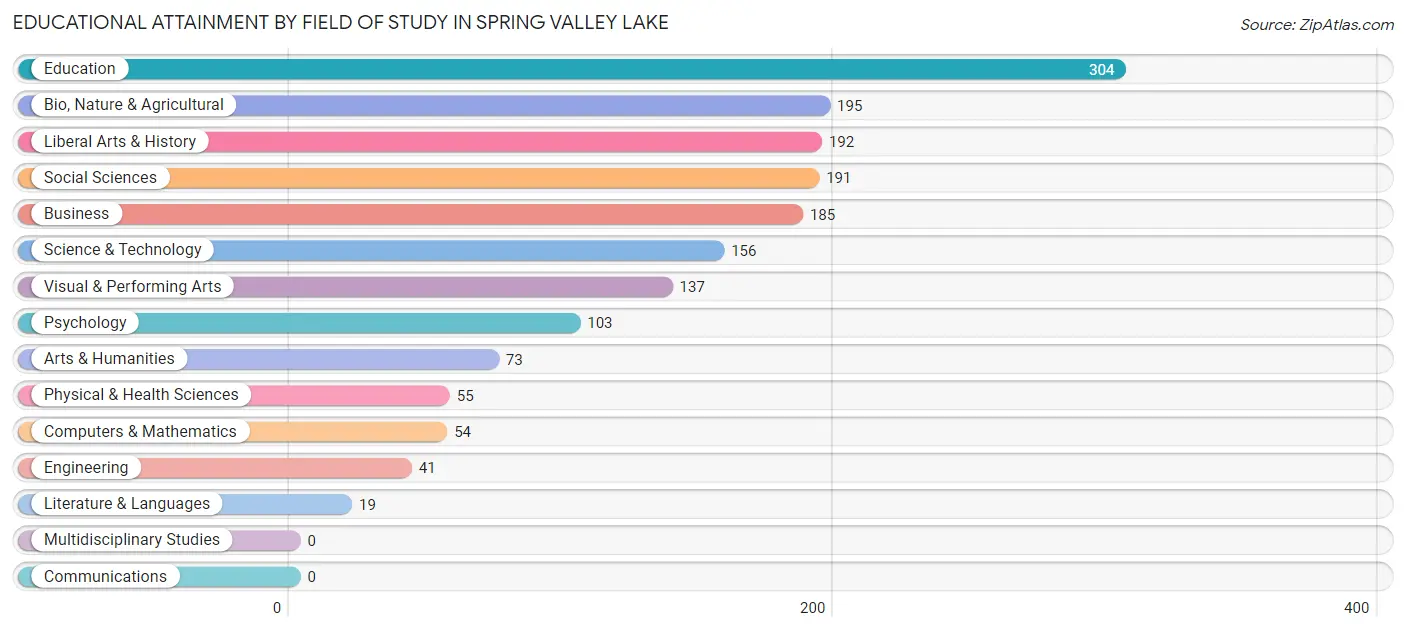
| Field of Study | # Graduates | % Graduates |
| Computers & Mathematics | 54 | 3.2% |
| Bio, Nature & Agricultural | 195 | 11.4% |
| Physical & Health Sciences | 55 | 3.2% |
| Psychology | 103 | 6.0% |
| Social Sciences | 191 | 11.2% |
| Engineering | 41 | 2.4% |
| Multidisciplinary Studies | 0 | 0.0% |
| Science & Technology | 156 | 9.1% |
| Business | 185 | 10.8% |
| Education | 304 | 17.8% |
| Literature & Languages | 19 | 1.1% |
| Liberal Arts & History | 192 | 11.3% |
| Visual & Performing Arts | 137 | 8.0% |
| Communications | 0 | 0.0% |
| Arts & Humanities | 73 | 4.3% |
| Total | 1,705 | 100.0% |
Transportation & Commute in Spring Valley Lake
Vehicle Availability by Sex in Spring Valley Lake
The most prevalent vehicle ownership categories in Spring Valley Lake are males with 2 vehicles (933, accounting for 51.8%) and females with 2 vehicles (767, making up 55.0%).
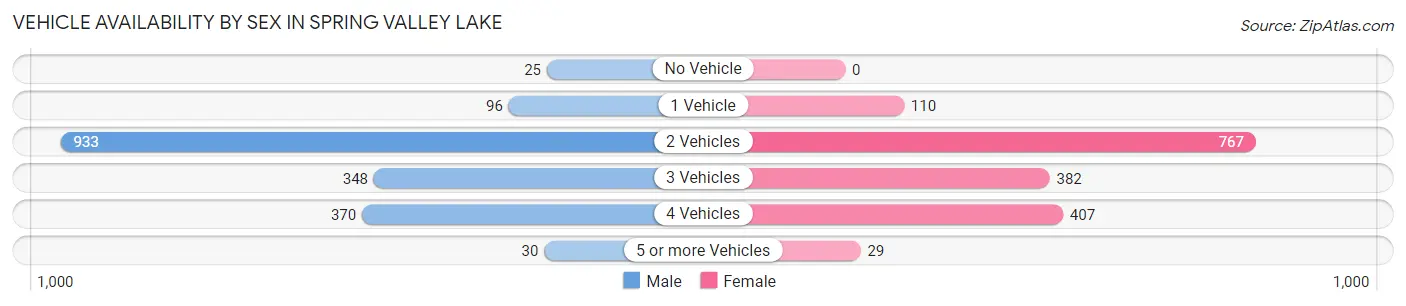
| Vehicles Available | Male | Female |
| No Vehicle | 25 (1.4%) | 0 (0.0%) |
| 1 Vehicle | 96 (5.3%) | 110 (6.5%) |
| 2 Vehicles | 933 (51.8%) | 767 (45.3%) |
| 3 Vehicles | 348 (19.3%) | 382 (22.5%) |
| 4 Vehicles | 370 (20.5%) | 407 (24.0%) |
| 5 or more Vehicles | 30 (1.7%) | 29 (1.7%) |
| Total | 1,802 (100.0%) | 1,695 (100.0%) |
Commute Time in Spring Valley Lake
The most frequently occuring commute durations in Spring Valley Lake are 10 to 14 minutes (641 commuters, 20.5%), 20 to 24 minutes (508 commuters, 16.3%), and 15 to 19 minutes (485 commuters, 15.5%).
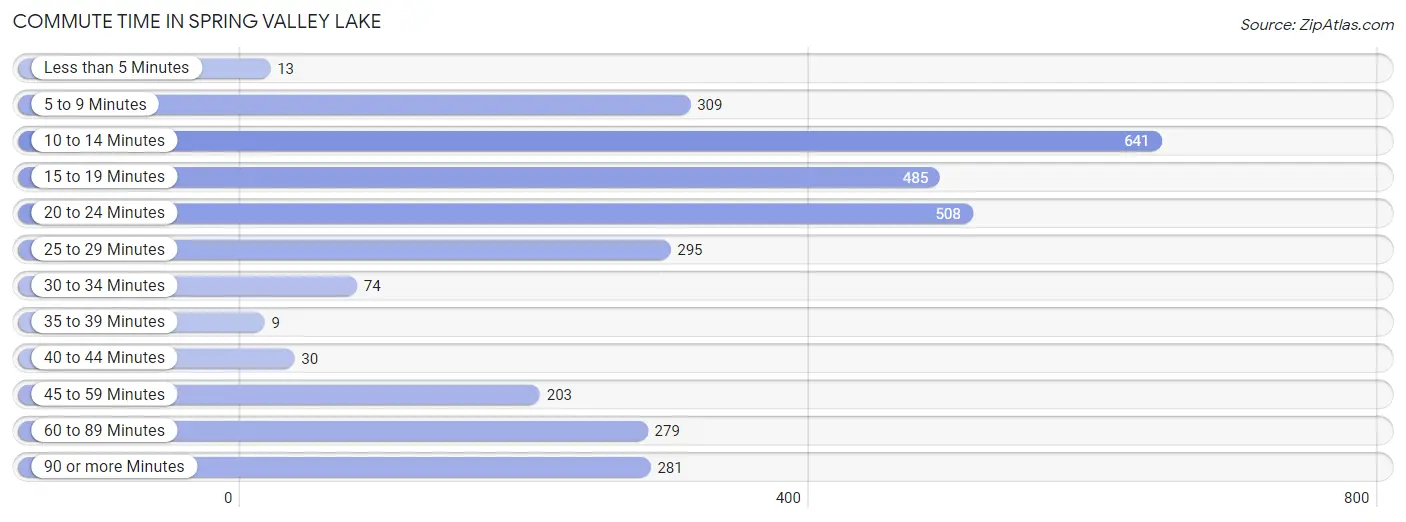
| Commute Time | # Commuters | % Commuters |
| Less than 5 Minutes | 13 | 0.4% |
| 5 to 9 Minutes | 309 | 9.9% |
| 10 to 14 Minutes | 641 | 20.5% |
| 15 to 19 Minutes | 485 | 15.5% |
| 20 to 24 Minutes | 508 | 16.3% |
| 25 to 29 Minutes | 295 | 9.4% |
| 30 to 34 Minutes | 74 | 2.4% |
| 35 to 39 Minutes | 9 | 0.3% |
| 40 to 44 Minutes | 30 | 1.0% |
| 45 to 59 Minutes | 203 | 6.5% |
| 60 to 89 Minutes | 279 | 8.9% |
| 90 or more Minutes | 281 | 9.0% |
Commute Time by Sex in Spring Valley Lake
The most common commute times in Spring Valley Lake are 20 to 24 minutes (307 commuters, 18.7%) for males and 15 to 19 minutes (348 commuters, 23.4%) for females.
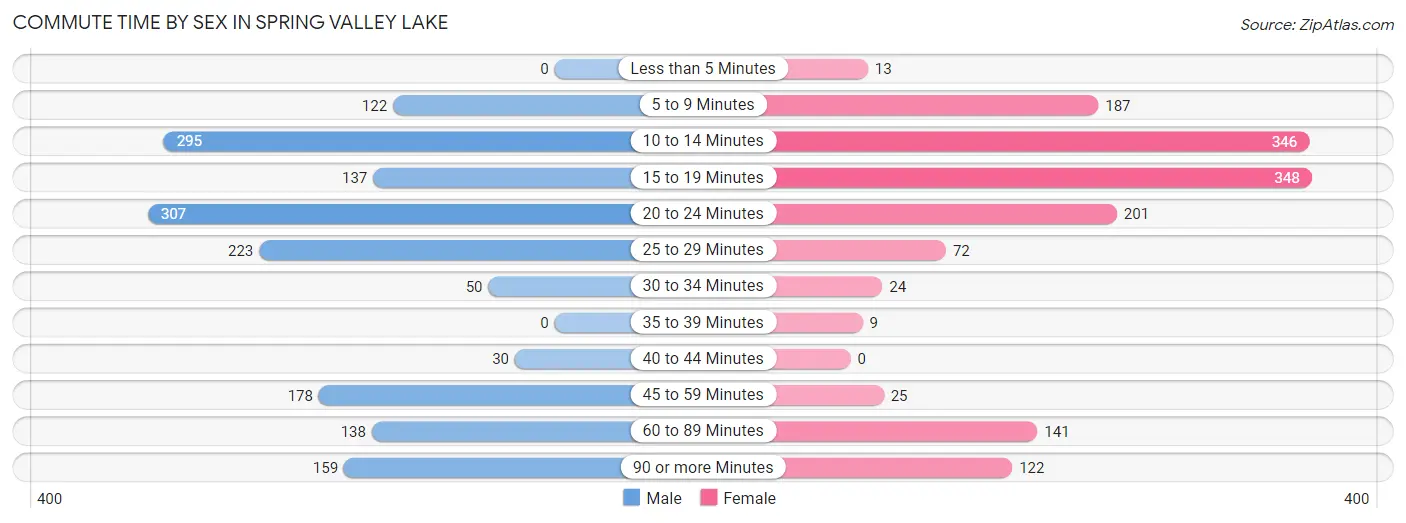
| Commute Time | Male | Female |
| Less than 5 Minutes | 0 (0.0%) | 13 (0.9%) |
| 5 to 9 Minutes | 122 (7.4%) | 187 (12.6%) |
| 10 to 14 Minutes | 295 (18.0%) | 346 (23.3%) |
| 15 to 19 Minutes | 137 (8.4%) | 348 (23.4%) |
| 20 to 24 Minutes | 307 (18.7%) | 201 (13.5%) |
| 25 to 29 Minutes | 223 (13.6%) | 72 (4.8%) |
| 30 to 34 Minutes | 50 (3.0%) | 24 (1.6%) |
| 35 to 39 Minutes | 0 (0.0%) | 9 (0.6%) |
| 40 to 44 Minutes | 30 (1.8%) | 0 (0.0%) |
| 45 to 59 Minutes | 178 (10.9%) | 25 (1.7%) |
| 60 to 89 Minutes | 138 (8.4%) | 141 (9.5%) |
| 90 or more Minutes | 159 (9.7%) | 122 (8.2%) |
Time of Departure to Work by Sex in Spring Valley Lake
The most frequent times of departure to work in Spring Valley Lake are 6:00 AM to 6:29 AM (329, 20.1%) for males and 6:30 AM to 6:59 AM (211, 14.2%) for females.
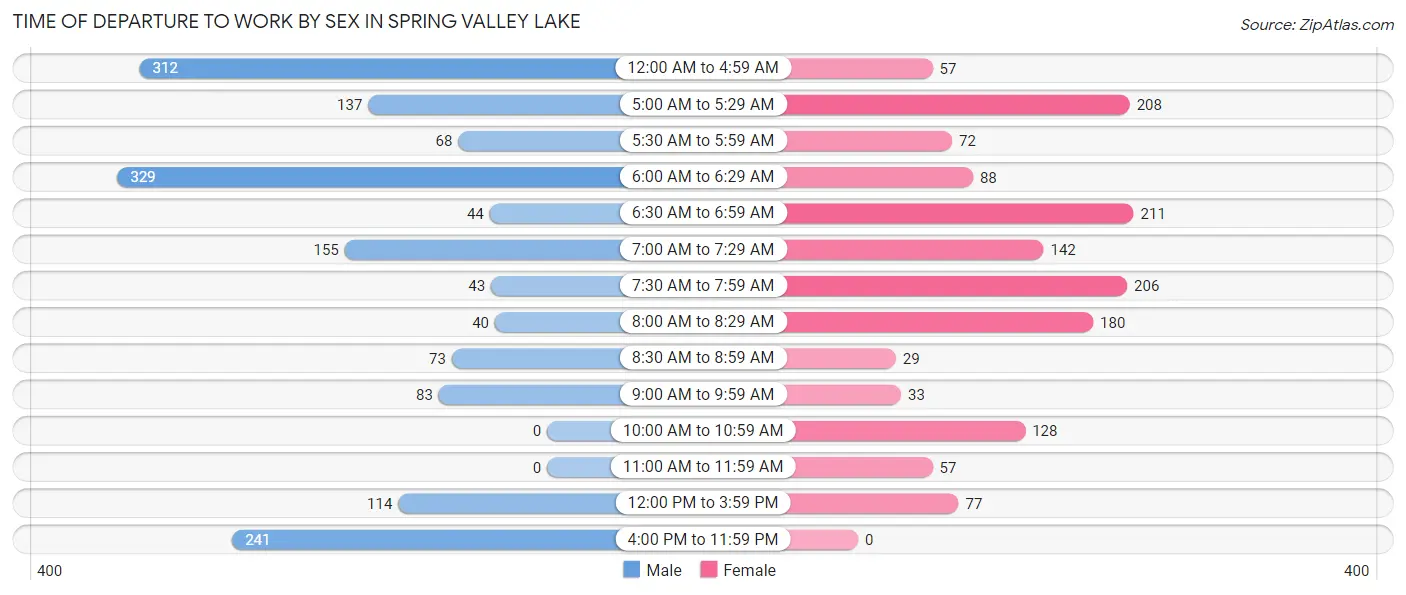
| Time of Departure | Male | Female |
| 12:00 AM to 4:59 AM | 312 (19.0%) | 57 (3.8%) |
| 5:00 AM to 5:29 AM | 137 (8.4%) | 208 (14.0%) |
| 5:30 AM to 5:59 AM | 68 (4.2%) | 72 (4.8%) |
| 6:00 AM to 6:29 AM | 329 (20.1%) | 88 (5.9%) |
| 6:30 AM to 6:59 AM | 44 (2.7%) | 211 (14.2%) |
| 7:00 AM to 7:29 AM | 155 (9.5%) | 142 (9.5%) |
| 7:30 AM to 7:59 AM | 43 (2.6%) | 206 (13.8%) |
| 8:00 AM to 8:29 AM | 40 (2.4%) | 180 (12.1%) |
| 8:30 AM to 8:59 AM | 73 (4.4%) | 29 (1.9%) |
| 9:00 AM to 9:59 AM | 83 (5.1%) | 33 (2.2%) |
| 10:00 AM to 10:59 AM | 0 (0.0%) | 128 (8.6%) |
| 11:00 AM to 11:59 AM | 0 (0.0%) | 57 (3.8%) |
| 12:00 PM to 3:59 PM | 114 (7.0%) | 77 (5.2%) |
| 4:00 PM to 11:59 PM | 241 (14.7%) | 0 (0.0%) |
| Total | 1,639 (100.0%) | 1,488 (100.0%) |
Housing Occupancy in Spring Valley Lake
Occupancy by Ownership in Spring Valley Lake
Of the total 2,958 dwellings in Spring Valley Lake, owner-occupied units account for 2,318 (78.4%), while renter-occupied units make up 640 (21.6%).
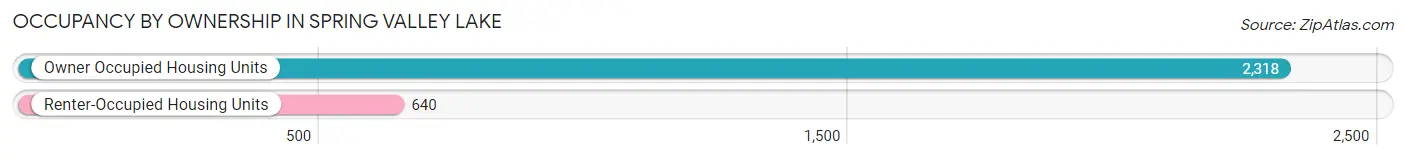
| Occupancy | # Housing Units | % Housing Units |
| Owner Occupied Housing Units | 2,318 | 78.4% |
| Renter-Occupied Housing Units | 640 | 21.6% |
| Total Occupied Housing Units | 2,958 | 100.0% |
Occupancy by Household Size in Spring Valley Lake
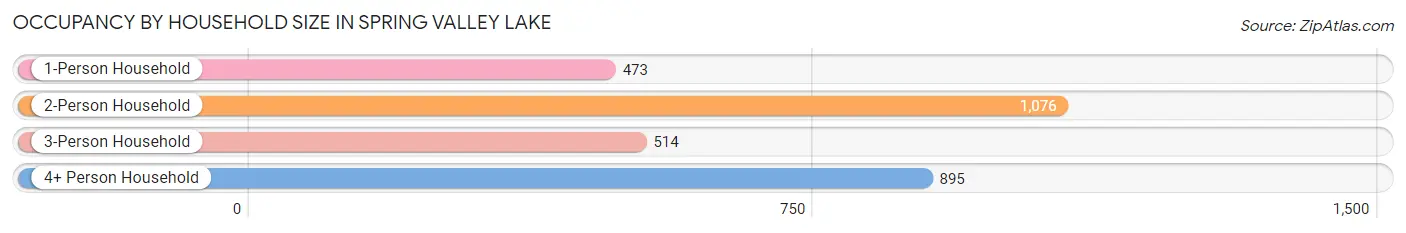
| Household Size | # Housing Units | % Housing Units |
| 1-Person Household | 473 | 16.0% |
| 2-Person Household | 1,076 | 36.4% |
| 3-Person Household | 514 | 17.4% |
| 4+ Person Household | 895 | 30.3% |
| Total Housing Units | 2,958 | 100.0% |
Occupancy by Ownership by Household Size in Spring Valley Lake
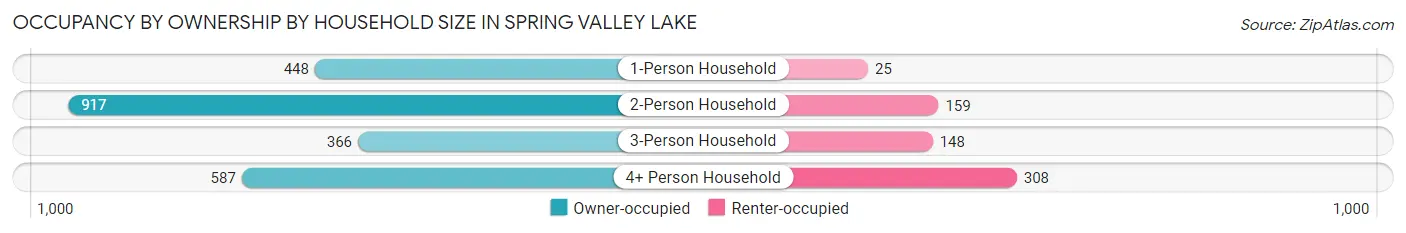
| Household Size | Owner-occupied | Renter-occupied |
| 1-Person Household | 448 (94.7%) | 25 (5.3%) |
| 2-Person Household | 917 (85.2%) | 159 (14.8%) |
| 3-Person Household | 366 (71.2%) | 148 (28.8%) |
| 4+ Person Household | 587 (65.6%) | 308 (34.4%) |
| Total Housing Units | 2,318 (78.4%) | 640 (21.6%) |
Occupancy by Educational Attainment in Spring Valley Lake
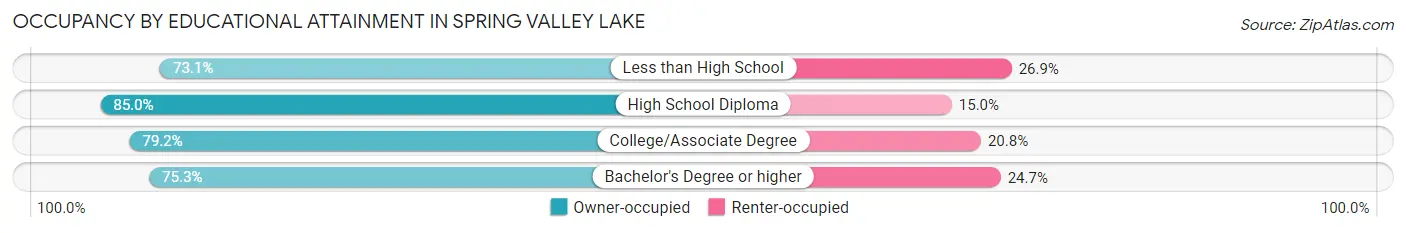
| Household Size | Owner-occupied | Renter-occupied |
| Less than High School | 147 (73.1%) | 54 (26.9%) |
| High School Diploma | 385 (85.0%) | 68 (15.0%) |
| College/Associate Degree | 1,033 (79.2%) | 271 (20.8%) |
| Bachelor's Degree or higher | 753 (75.3%) | 247 (24.7%) |
Occupancy by Age of Householder in Spring Valley Lake
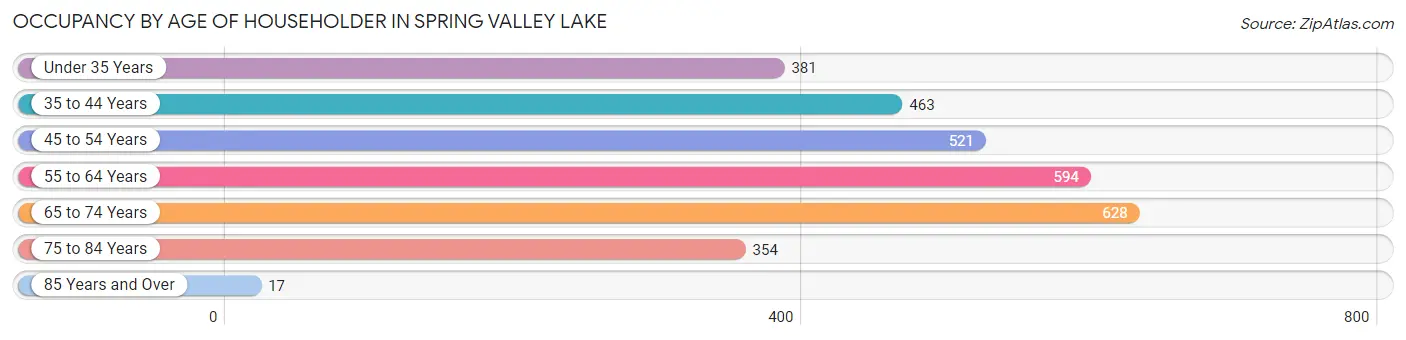
| Age Bracket | # Households | % Households |
| Under 35 Years | 381 | 12.9% |
| 35 to 44 Years | 463 | 15.7% |
| 45 to 54 Years | 521 | 17.6% |
| 55 to 64 Years | 594 | 20.1% |
| 65 to 74 Years | 628 | 21.2% |
| 75 to 84 Years | 354 | 12.0% |
| 85 Years and Over | 17 | 0.6% |
| Total | 2,958 | 100.0% |
Housing Finances in Spring Valley Lake
Median Income by Occupancy in Spring Valley Lake
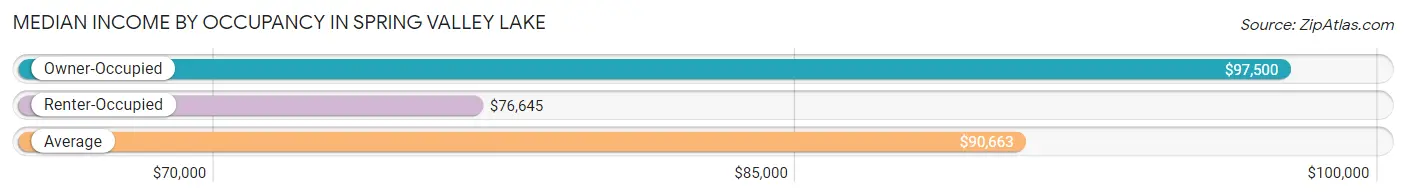
| Occupancy Type | # Households | Median Income |
| Owner-Occupied | 2,318 (78.4%) | $97,500 |
| Renter-Occupied | 640 (21.6%) | $76,645 |
| Average | 2,958 (100.0%) | $90,663 |
Occupancy by Householder Income Bracket in Spring Valley Lake
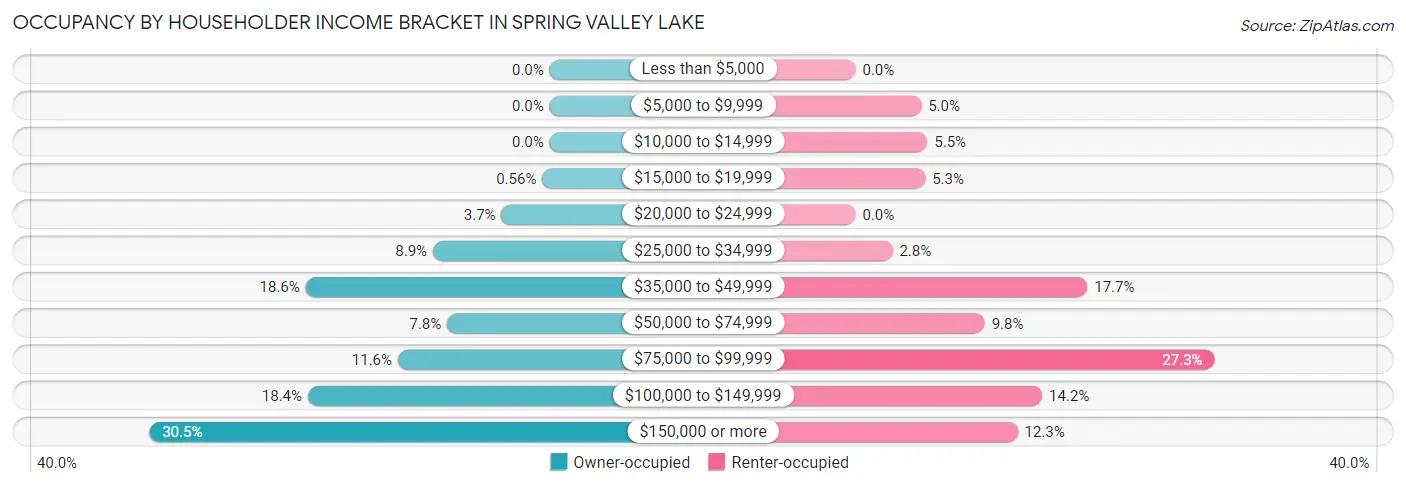
| Income Bracket | Owner-occupied | Renter-occupied |
| Less than $5,000 | 0 (0.0%) | 0 (0.0%) |
| $5,000 to $9,999 | 0 (0.0%) | 32 (5.0%) |
| $10,000 to $14,999 | 0 (0.0%) | 35 (5.5%) |
| $15,000 to $19,999 | 13 (0.6%) | 34 (5.3%) |
| $20,000 to $24,999 | 85 (3.7%) | 0 (0.0%) |
| $25,000 to $34,999 | 206 (8.9%) | 18 (2.8%) |
| $35,000 to $49,999 | 431 (18.6%) | 113 (17.7%) |
| $50,000 to $74,999 | 181 (7.8%) | 63 (9.8%) |
| $75,000 to $99,999 | 268 (11.6%) | 175 (27.3%) |
| $100,000 to $149,999 | 427 (18.4%) | 91 (14.2%) |
| $150,000 or more | 707 (30.5%) | 79 (12.3%) |
| Total | 2,318 (100.0%) | 640 (100.0%) |
Monthly Housing Cost Tiers in Spring Valley Lake
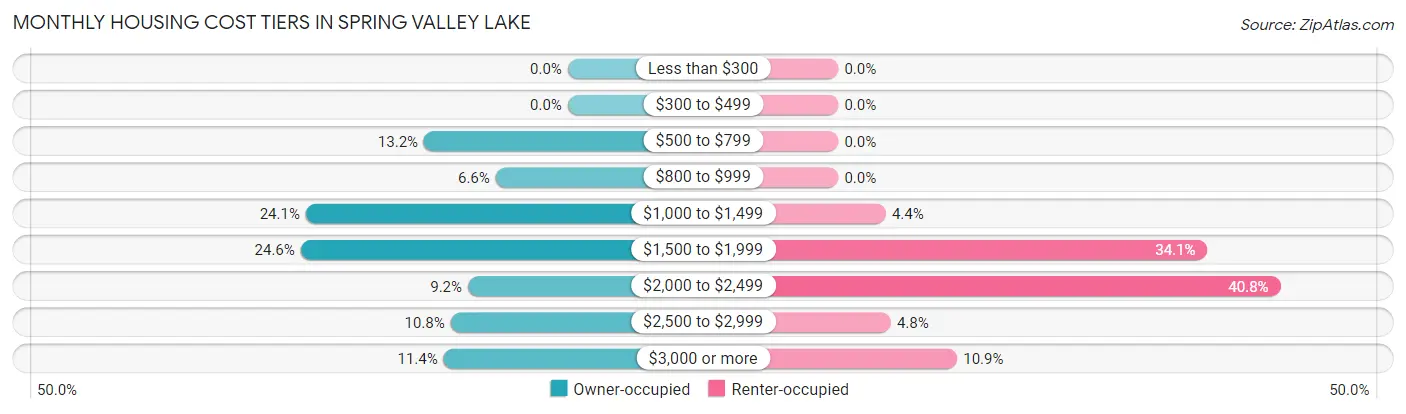
| Monthly Cost | Owner-occupied | Renter-occupied |
| Less than $300 | 0 (0.0%) | 0 (0.0%) |
| $300 to $499 | 0 (0.0%) | 0 (0.0%) |
| $500 to $799 | 307 (13.2%) | 0 (0.0%) |
| $800 to $999 | 154 (6.6%) | 0 (0.0%) |
| $1,000 to $1,499 | 559 (24.1%) | 28 (4.4%) |
| $1,500 to $1,999 | 570 (24.6%) | 218 (34.1%) |
| $2,000 to $2,499 | 213 (9.2%) | 261 (40.8%) |
| $2,500 to $2,999 | 250 (10.8%) | 31 (4.8%) |
| $3,000 or more | 265 (11.4%) | 70 (10.9%) |
| Total | 2,318 (100.0%) | 640 (100.0%) |
Physical Housing Characteristics in Spring Valley Lake
Housing Structures in Spring Valley Lake
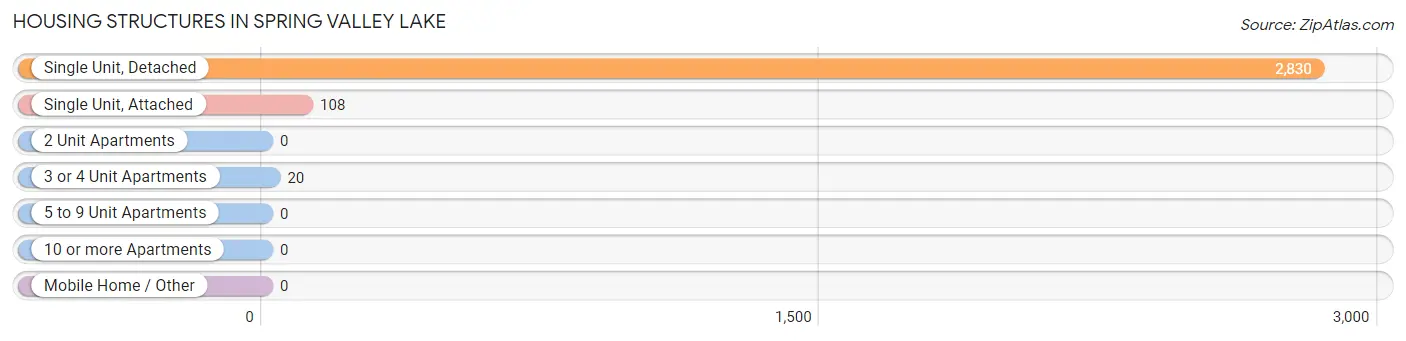
| Structure Type | # Housing Units | % Housing Units |
| Single Unit, Detached | 2,830 | 95.7% |
| Single Unit, Attached | 108 | 3.6% |
| 2 Unit Apartments | 0 | 0.0% |
| 3 or 4 Unit Apartments | 20 | 0.7% |
| 5 to 9 Unit Apartments | 0 | 0.0% |
| 10 or more Apartments | 0 | 0.0% |
| Mobile Home / Other | 0 | 0.0% |
| Total | 2,958 | 100.0% |
Housing Structures by Occupancy in Spring Valley Lake
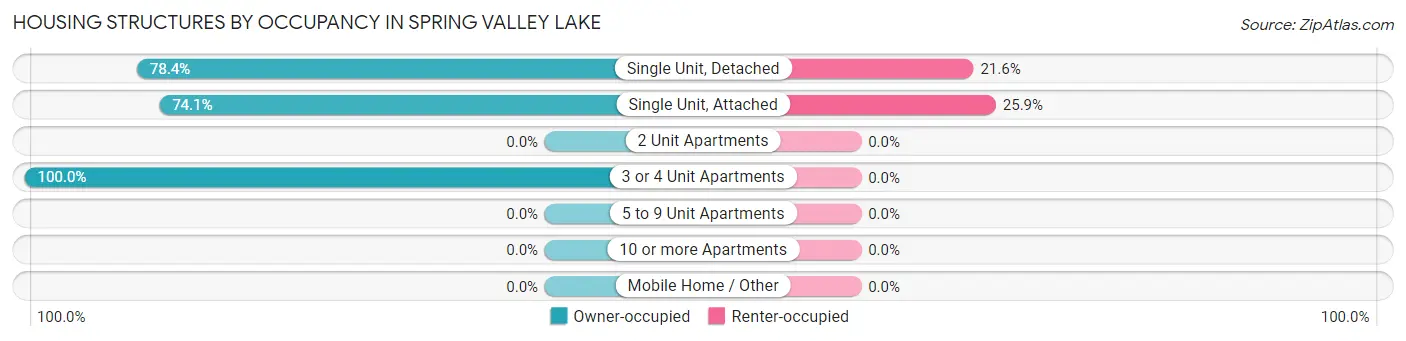
| Structure Type | Owner-occupied | Renter-occupied |
| Single Unit, Detached | 2,218 (78.4%) | 612 (21.6%) |
| Single Unit, Attached | 80 (74.1%) | 28 (25.9%) |
| 2 Unit Apartments | 0 (0.0%) | 0 (0.0%) |
| 3 or 4 Unit Apartments | 20 (100.0%) | 0 (0.0%) |
| 5 to 9 Unit Apartments | 0 (0.0%) | 0 (0.0%) |
| 10 or more Apartments | 0 (0.0%) | 0 (0.0%) |
| Mobile Home / Other | 0 (0.0%) | 0 (0.0%) |
| Total | 2,318 (78.4%) | 640 (21.6%) |
Housing Structures by Number of Rooms in Spring Valley Lake
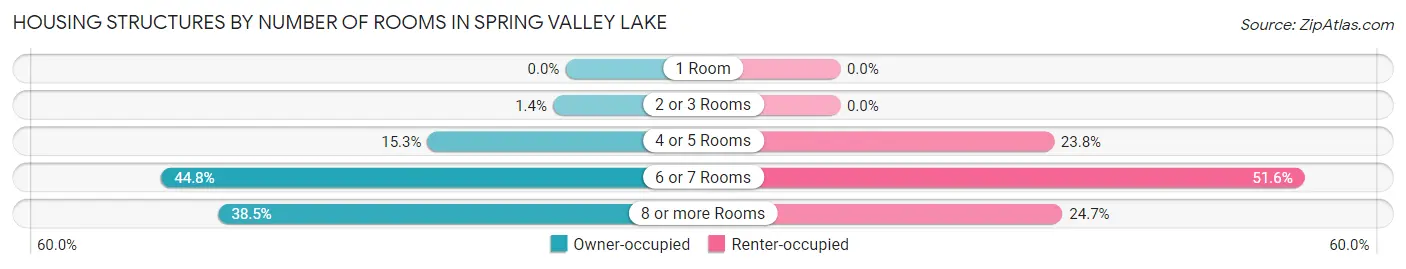
| Number of Rooms | Owner-occupied | Renter-occupied |
| 1 Room | 0 (0.0%) | 0 (0.0%) |
| 2 or 3 Rooms | 32 (1.4%) | 0 (0.0%) |
| 4 or 5 Rooms | 355 (15.3%) | 152 (23.7%) |
| 6 or 7 Rooms | 1,039 (44.8%) | 330 (51.6%) |
| 8 or more Rooms | 892 (38.5%) | 158 (24.7%) |
| Total | 2,318 (100.0%) | 640 (100.0%) |
Housing Structure by Heating Type in Spring Valley Lake
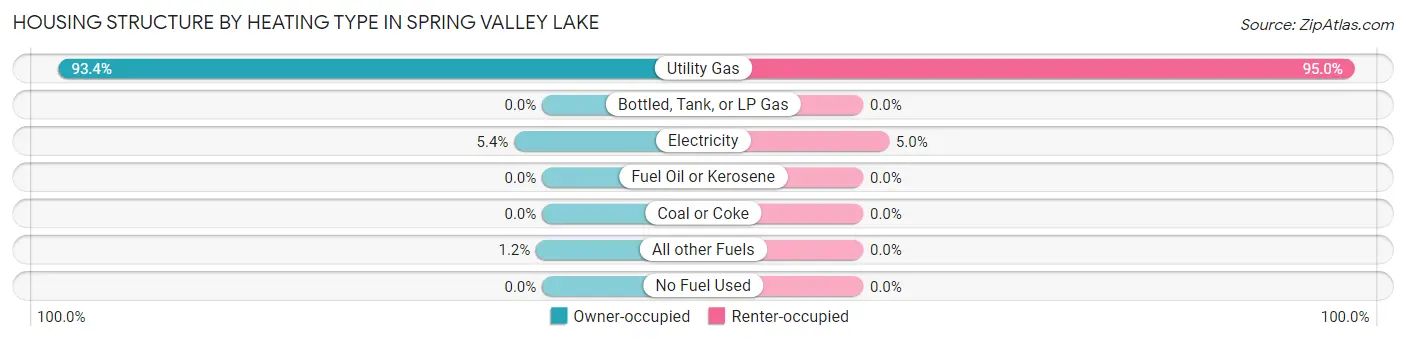
| Heating Type | Owner-occupied | Renter-occupied |
| Utility Gas | 2,166 (93.4%) | 608 (95.0%) |
| Bottled, Tank, or LP Gas | 0 (0.0%) | 0 (0.0%) |
| Electricity | 125 (5.4%) | 32 (5.0%) |
| Fuel Oil or Kerosene | 0 (0.0%) | 0 (0.0%) |
| Coal or Coke | 0 (0.0%) | 0 (0.0%) |
| All other Fuels | 27 (1.2%) | 0 (0.0%) |
| No Fuel Used | 0 (0.0%) | 0 (0.0%) |
| Total | 2,318 (100.0%) | 640 (100.0%) |
Household Vehicle Usage in Spring Valley Lake
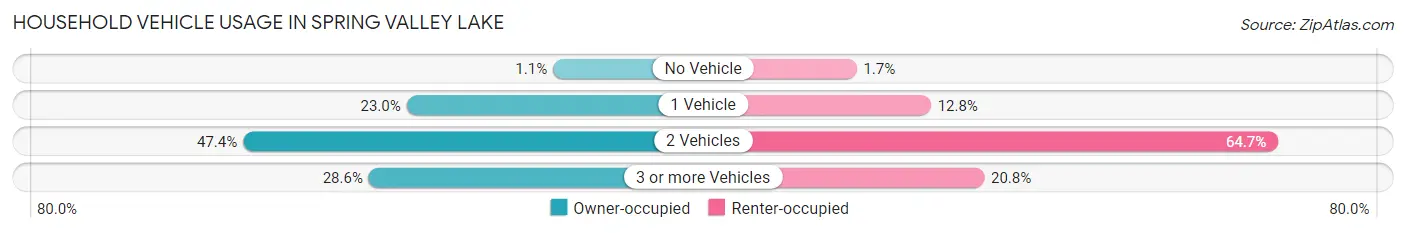
| Vehicles per Household | Owner-occupied | Renter-occupied |
| No Vehicle | 25 (1.1%) | 11 (1.7%) |
| 1 Vehicle | 532 (23.0%) | 82 (12.8%) |
| 2 Vehicles | 1,098 (47.4%) | 414 (64.7%) |
| 3 or more Vehicles | 663 (28.6%) | 133 (20.8%) |
| Total | 2,318 (100.0%) | 640 (100.0%) |
Real Estate & Mortgages in Spring Valley Lake
Real Estate and Mortgage Overview in Spring Valley Lake
| Characteristic | Without Mortgage | With Mortgage |
| Housing Units | 426 | 1,892 |
| Median Property Value | $377,800 | $400,600 |
| Median Household Income | - | - |
| Monthly Housing Costs | $739 | $265 |
| Real Estate Taxes | $2,872 | $64 |
Property Value by Mortgage Status in Spring Valley Lake
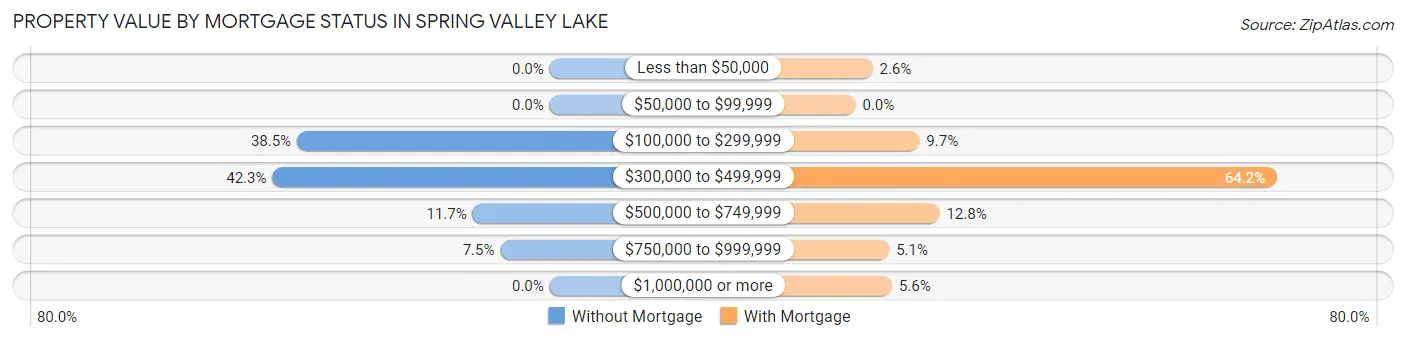
| Property Value | Without Mortgage | With Mortgage |
| Less than $50,000 | 0 (0.0%) | 49 (2.6%) |
| $50,000 to $99,999 | 0 (0.0%) | 0 (0.0%) |
| $100,000 to $299,999 | 164 (38.5%) | 184 (9.7%) |
| $300,000 to $499,999 | 180 (42.2%) | 1,215 (64.2%) |
| $500,000 to $749,999 | 50 (11.7%) | 242 (12.8%) |
| $750,000 to $999,999 | 32 (7.5%) | 97 (5.1%) |
| $1,000,000 or more | 0 (0.0%) | 105 (5.6%) |
| Total | 426 (100.0%) | 1,892 (100.0%) |
Household Income by Mortgage Status in Spring Valley Lake
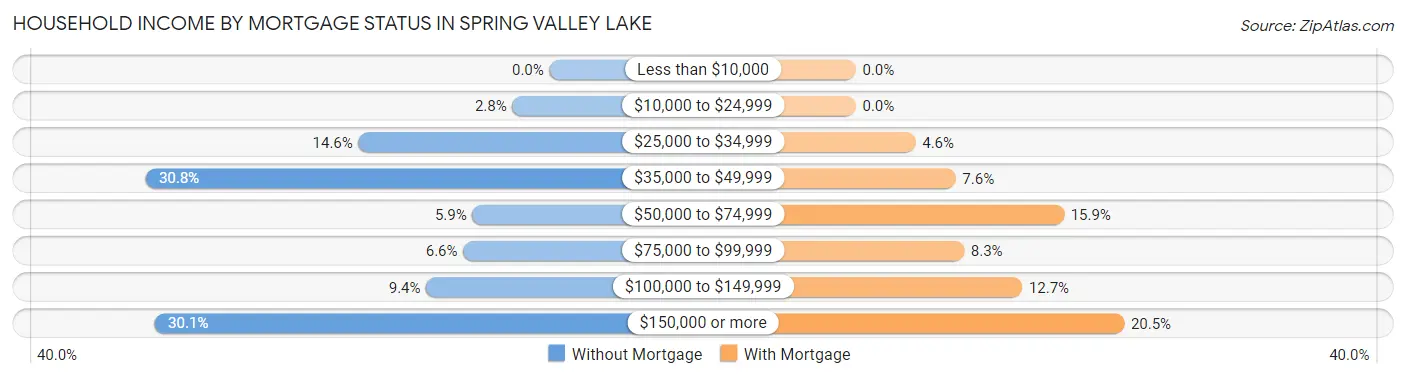
| Household Income | Without Mortgage | With Mortgage |
| Less than $10,000 | 0 (0.0%) | 0 (0.0%) |
| $10,000 to $24,999 | 12 (2.8%) | 0 (0.0%) |
| $25,000 to $34,999 | 62 (14.5%) | 86 (4.5%) |
| $35,000 to $49,999 | 131 (30.7%) | 144 (7.6%) |
| $50,000 to $74,999 | 25 (5.9%) | 300 (15.9%) |
| $75,000 to $99,999 | 28 (6.6%) | 156 (8.3%) |
| $100,000 to $149,999 | 40 (9.4%) | 240 (12.7%) |
| $150,000 or more | 128 (30.0%) | 387 (20.4%) |
| Total | 426 (100.0%) | 1,892 (100.0%) |
Property Value to Household Income Ratio in Spring Valley Lake
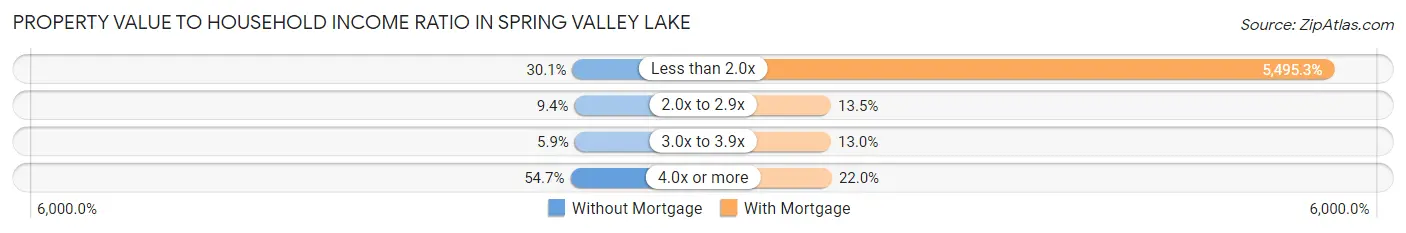
| Value-to-Income Ratio | Without Mortgage | With Mortgage |
| Less than 2.0x | 128 (30.0%) | 103,971 (5,495.3%) |
| 2.0x to 2.9x | 40 (9.4%) | 256 (13.5%) |
| 3.0x to 3.9x | 25 (5.9%) | 245 (13.0%) |
| 4.0x or more | 233 (54.7%) | 416 (22.0%) |
| Total | 426 (100.0%) | 1,892 (100.0%) |
Real Estate Taxes by Mortgage Status in Spring Valley Lake
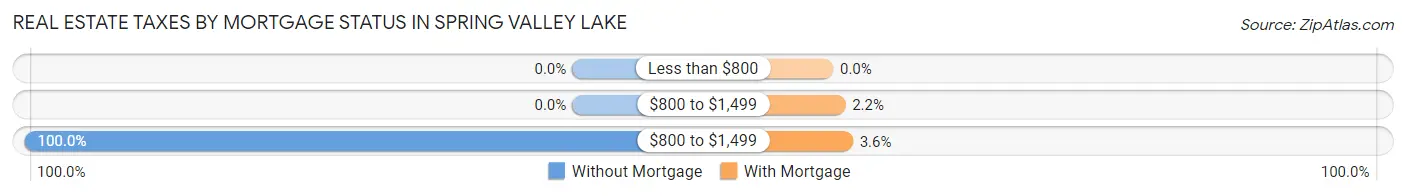
| Property Taxes | Without Mortgage | With Mortgage |
| Less than $800 | 0 (0.0%) | 0 (0.0%) |
| $800 to $1,499 | 0 (0.0%) | 42 (2.2%) |
| $800 to $1,499 | 426 (100.0%) | 68 (3.6%) |
| Total | 426 (100.0%) | 1,892 (100.0%) |
Health & Disability in Spring Valley Lake
Health Insurance Coverage by Age in Spring Valley Lake
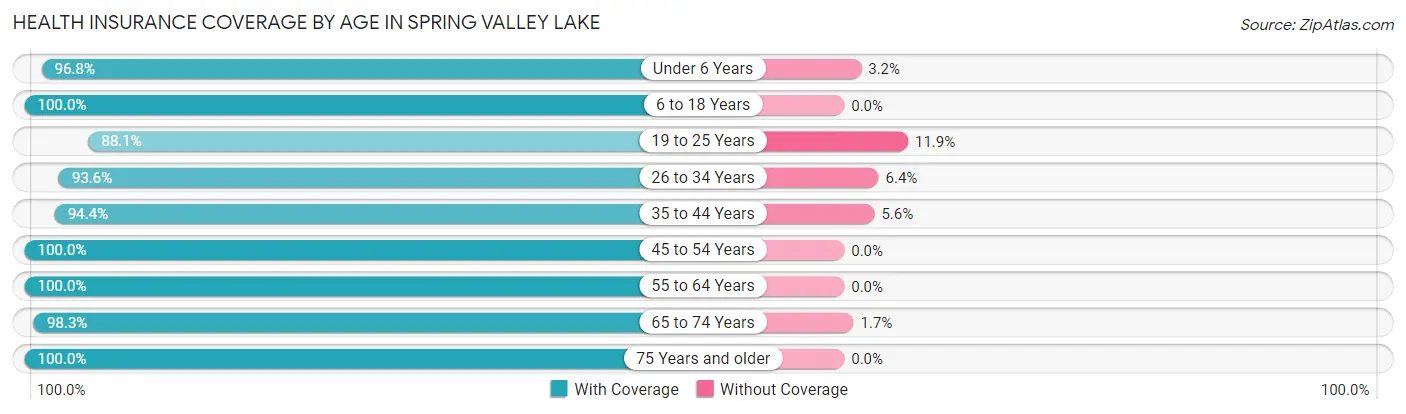
| Age Bracket | With Coverage | Without Coverage |
| Under 6 Years | 642 (96.8%) | 21 (3.2%) |
| 6 to 18 Years | 1,584 (100.0%) | 0 (0.0%) |
| 19 to 25 Years | 971 (88.1%) | 131 (11.9%) |
| 26 to 34 Years | 601 (93.6%) | 41 (6.4%) |
| 35 to 44 Years | 1,005 (94.4%) | 60 (5.6%) |
| 45 to 54 Years | 862 (100.0%) | 0 (0.0%) |
| 55 to 64 Years | 1,170 (100.0%) | 0 (0.0%) |
| 65 to 74 Years | 1,017 (98.3%) | 18 (1.7%) |
| 75 Years and older | 640 (100.0%) | 0 (0.0%) |
| Total | 8,492 (96.9%) | 271 (3.1%) |
Health Insurance Coverage by Citizenship Status in Spring Valley Lake
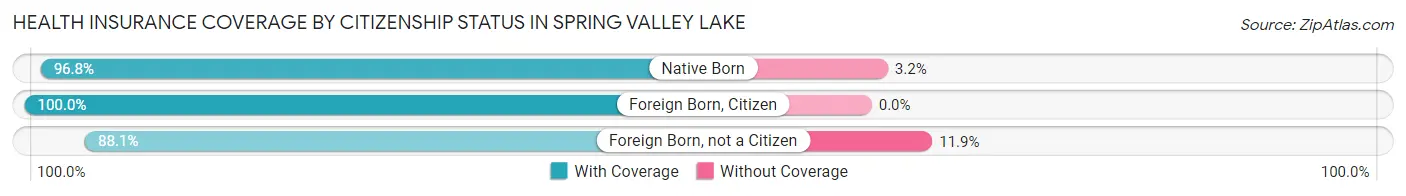
| Citizenship Status | With Coverage | Without Coverage |
| Native Born | 642 (96.8%) | 21 (3.2%) |
| Foreign Born, Citizen | 1,584 (100.0%) | 0 (0.0%) |
| Foreign Born, not a Citizen | 971 (88.1%) | 131 (11.9%) |
Health Insurance Coverage by Household Income in Spring Valley Lake
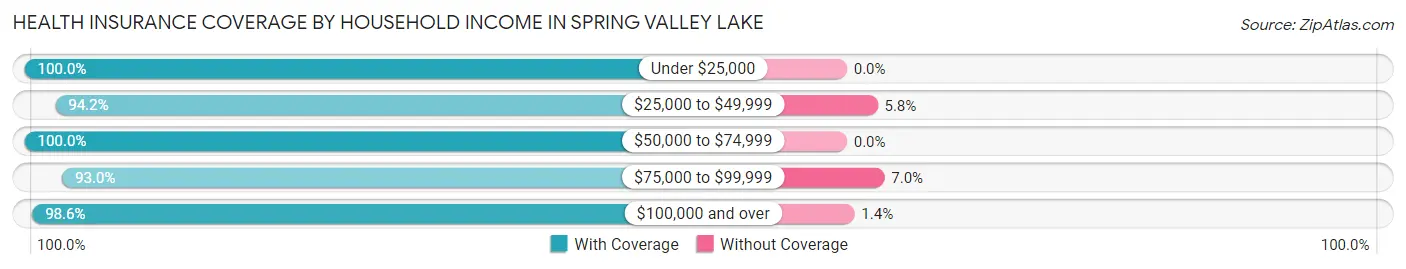
| Household Income | With Coverage | Without Coverage |
| Under $25,000 | 453 (100.0%) | 0 (0.0%) |
| $25,000 to $49,999 | 1,733 (94.2%) | 106 (5.8%) |
| $50,000 to $74,999 | 667 (100.0%) | 0 (0.0%) |
| $75,000 to $99,999 | 1,361 (93.0%) | 103 (7.0%) |
| $100,000 and over | 4,278 (98.6%) | 62 (1.4%) |
Public vs Private Health Insurance Coverage by Age in Spring Valley Lake
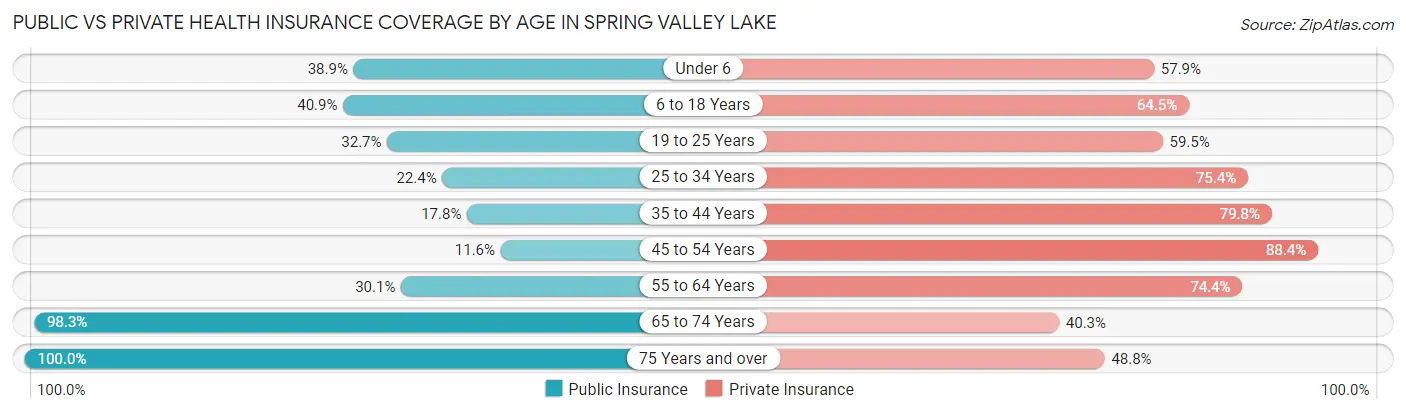
| Age Bracket | Public Insurance | Private Insurance |
| Under 6 | 258 (38.9%) | 384 (57.9%) |
| 6 to 18 Years | 647 (40.8%) | 1,021 (64.5%) |
| 19 to 25 Years | 360 (32.7%) | 656 (59.5%) |
| 25 to 34 Years | 144 (22.4%) | 484 (75.4%) |
| 35 to 44 Years | 190 (17.8%) | 850 (79.8%) |
| 45 to 54 Years | 100 (11.6%) | 762 (88.4%) |
| 55 to 64 Years | 352 (30.1%) | 870 (74.4%) |
| 65 to 74 Years | 1,017 (98.3%) | 417 (40.3%) |
| 75 Years and over | 640 (100.0%) | 312 (48.7%) |
| Total | 3,708 (42.3%) | 5,756 (65.7%) |
Disability Status by Sex by Age in Spring Valley Lake
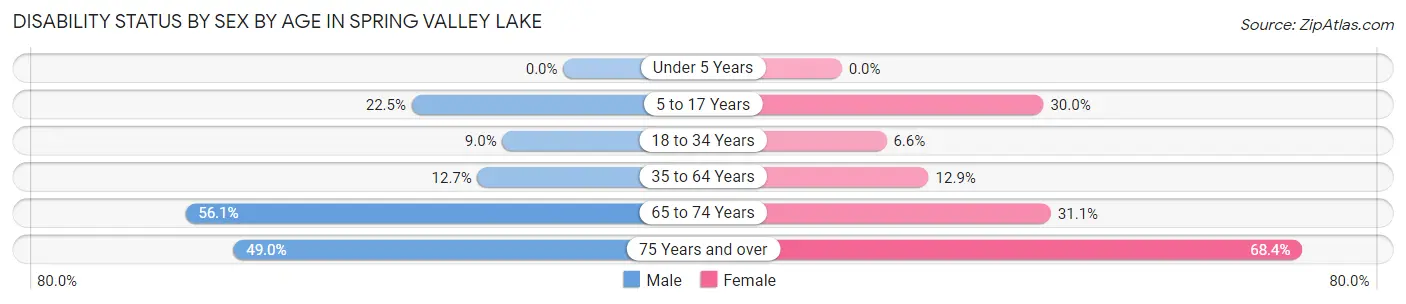
| Age Bracket | Male | Female |
| Under 5 Years | 0 (0.0%) | 0 (0.0%) |
| 5 to 17 Years | 185 (22.5%) | 254 (29.9%) |
| 18 to 34 Years | 81 (9.0%) | 62 (6.6%) |
| 35 to 64 Years | 189 (12.7%) | 208 (12.9%) |
| 65 to 74 Years | 261 (56.1%) | 177 (31.0%) |
| 75 Years and over | 123 (49.0%) | 266 (68.4%) |
Disability Class by Sex by Age in Spring Valley Lake
Disability Class: Hearing Difficulty
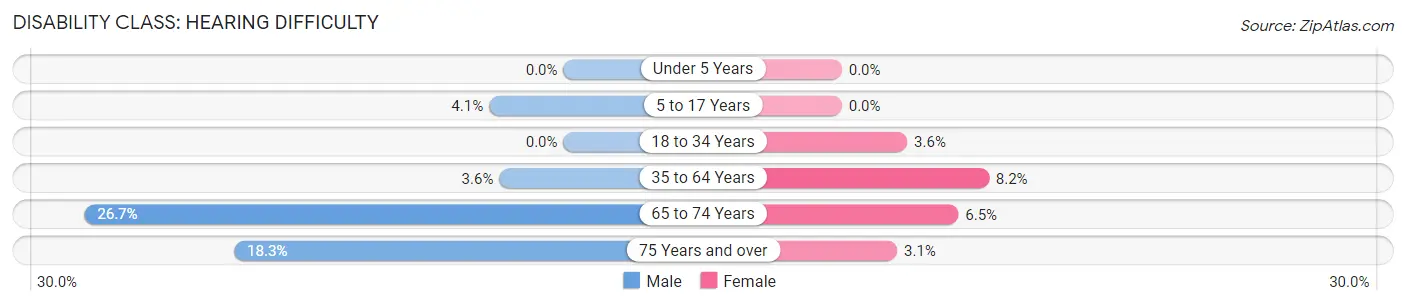
| Age Bracket | Male | Female |
| Under 5 Years | 0 (0.0%) | 0 (0.0%) |
| 5 to 17 Years | 34 (4.1%) | 0 (0.0%) |
| 18 to 34 Years | 0 (0.0%) | 34 (3.6%) |
| 35 to 64 Years | 53 (3.6%) | 132 (8.2%) |
| 65 to 74 Years | 124 (26.7%) | 37 (6.5%) |
| 75 Years and over | 46 (18.3%) | 12 (3.1%) |
Disability Class: Vision Difficulty
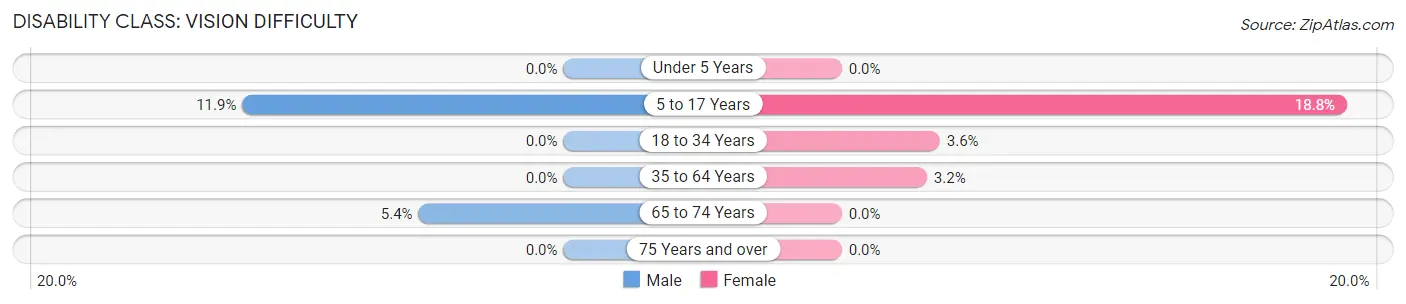
| Age Bracket | Male | Female |
| Under 5 Years | 0 (0.0%) | 0 (0.0%) |
| 5 to 17 Years | 98 (11.9%) | 159 (18.8%) |
| 18 to 34 Years | 0 (0.0%) | 34 (3.6%) |
| 35 to 64 Years | 0 (0.0%) | 51 (3.2%) |
| 65 to 74 Years | 25 (5.4%) | 0 (0.0%) |
| 75 Years and over | 0 (0.0%) | 0 (0.0%) |
Disability Class: Cognitive Difficulty
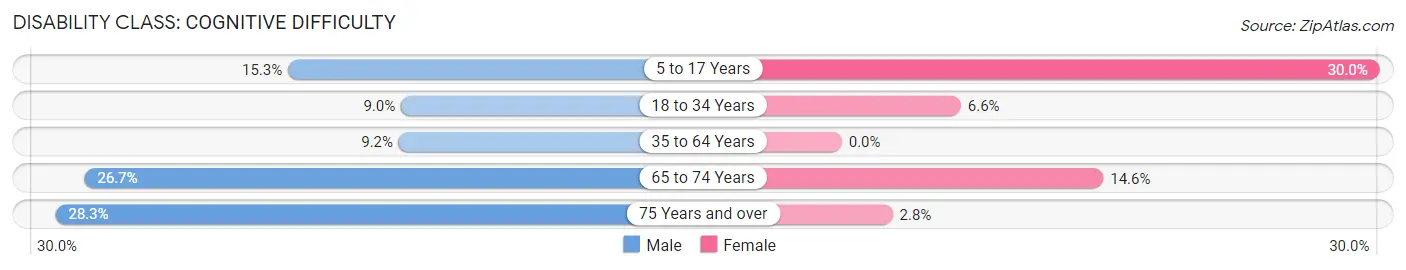
| Age Bracket | Male | Female |
| 5 to 17 Years | 126 (15.3%) | 254 (29.9%) |
| 18 to 34 Years | 81 (9.0%) | 62 (6.6%) |
| 35 to 64 Years | 136 (9.2%) | 0 (0.0%) |
| 65 to 74 Years | 124 (26.7%) | 83 (14.6%) |
| 75 Years and over | 71 (28.3%) | 11 (2.8%) |
Disability Class: Ambulatory Difficulty
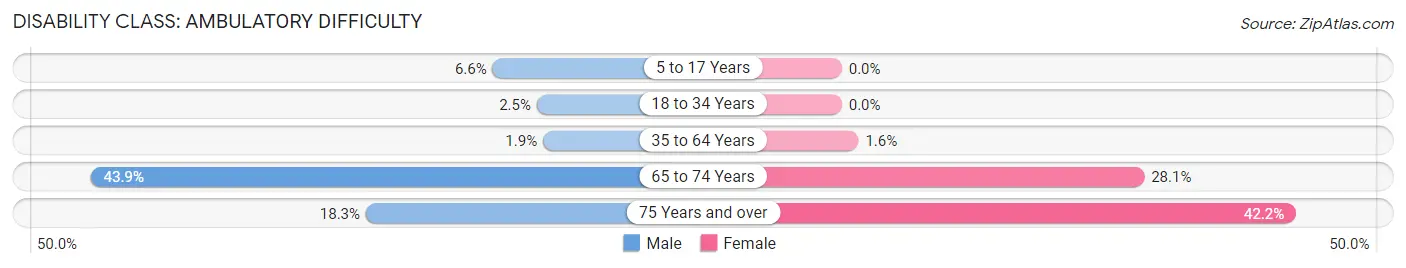
| Age Bracket | Male | Female |
| 5 to 17 Years | 54 (6.6%) | 0 (0.0%) |
| 18 to 34 Years | 22 (2.5%) | 0 (0.0%) |
| 35 to 64 Years | 28 (1.9%) | 25 (1.5%) |
| 65 to 74 Years | 204 (43.9%) | 160 (28.1%) |
| 75 Years and over | 46 (18.3%) | 164 (42.2%) |
Disability Class: Self-Care Difficulty
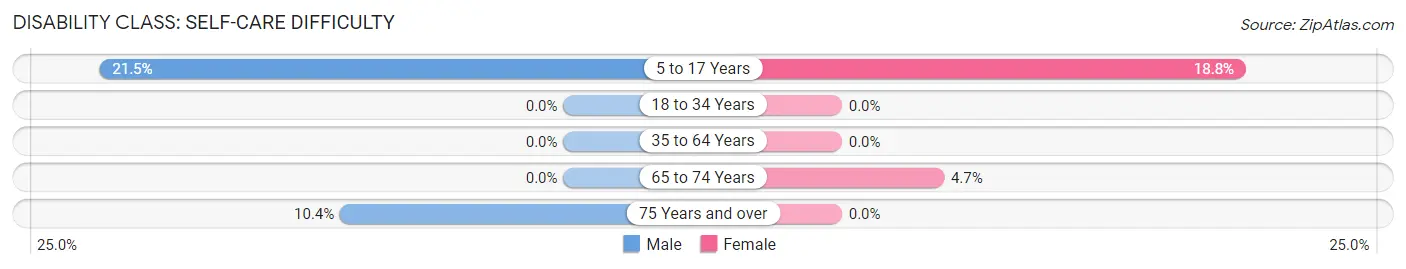
| Age Bracket | Male | Female |
| 5 to 17 Years | 177 (21.5%) | 159 (18.8%) |
| 18 to 34 Years | 0 (0.0%) | 0 (0.0%) |
| 35 to 64 Years | 0 (0.0%) | 0 (0.0%) |
| 65 to 74 Years | 0 (0.0%) | 27 (4.7%) |
| 75 Years and over | 26 (10.4%) | 0 (0.0%) |
Technology Access in Spring Valley Lake
Computing Device Access in Spring Valley Lake
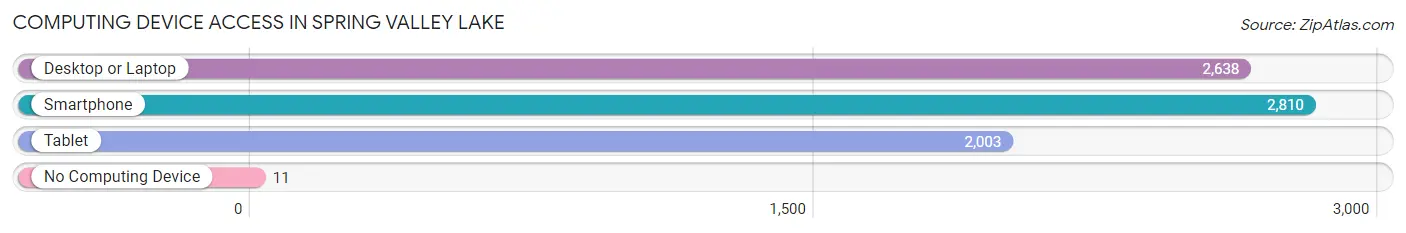
| Device Type | # Households | % Households |
| Desktop or Laptop | 2,638 | 89.2% |
| Smartphone | 2,810 | 95.0% |
| Tablet | 2,003 | 67.7% |
| No Computing Device | 11 | 0.4% |
| Total | 2,958 | 100.0% |
Internet Access in Spring Valley Lake
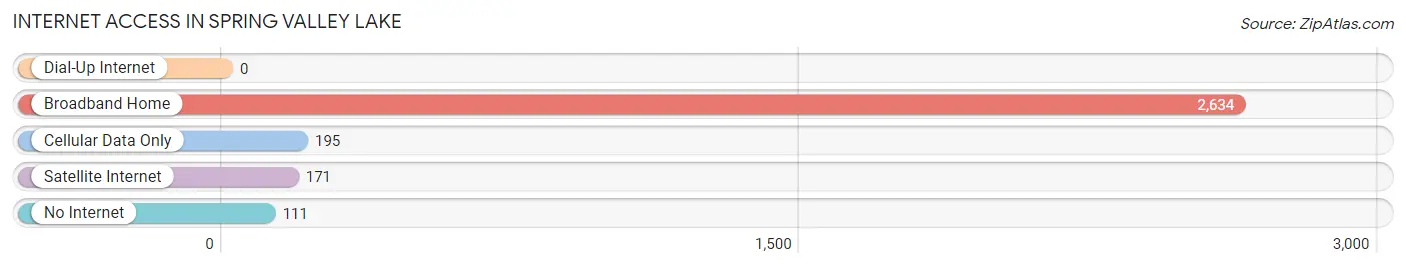
| Internet Type | # Households | % Households |
| Dial-Up Internet | 0 | 0.0% |
| Broadband Home | 2,634 | 89.0% |
| Cellular Data Only | 195 | 6.6% |
| Satellite Internet | 171 | 5.8% |
| No Internet | 111 | 3.7% |
| Total | 2,958 | 100.0% |
Spring Valley Lake Summary
Introduction
Spring Valley Lake is a private, gated community located in the Victor Valley of San Bernardino County, California. It is situated in the Mojave Desert, approximately 85 miles northeast of Los Angeles. The community was established in 1963 and is home to approximately 8,000 residents. It is known for its beautiful lake, which is the centerpiece of the community.
History
The area that is now Spring Valley Lake was originally inhabited by the Serrano Indians. In the late 1800s, the area was used for cattle grazing and farming. In the early 1900s, the area was developed for mining and the Victor Valley was established.
In 1963, the Spring Valley Lake Corporation was formed to develop the area into a residential community. The corporation purchased the land and began construction of the lake, which was completed in 1965. The lake was stocked with fish and the community was developed around it.
The community was designed to be a private, gated community with a variety of amenities. The community includes a golf course, tennis courts, a clubhouse, a swimming pool, and a marina. The community also has its own fire department, police department, and post office.
Geography
Spring Valley Lake is located in the Victor Valley of San Bernardino County, California. It is situated in the Mojave Desert, approximately 85 miles northeast of Los Angeles. The community is located at an elevation of 2,400 feet and has an average annual temperature of 70 degrees Fahrenheit.
The community is surrounded by the San Bernardino National Forest and is home to a variety of wildlife, including coyotes, bobcats, and mountain lions. The lake is the centerpiece of the community and is a popular spot for fishing, boating, and swimming.
Economy
The economy of Spring Valley Lake is largely based on tourism and recreation. The community is home to a variety of businesses, including restaurants, retail stores, and professional services. The community also has a variety of recreational activities, including golf, tennis, and boating.
The community is also home to a variety of manufacturing and industrial businesses. The community is home to a variety of manufacturing and industrial businesses, including aerospace, automotive, and medical device companies.
Demographics
As of the 2010 census, the population of Spring Valley Lake was 8,000. The population is predominantly white (83.3%) and Hispanic (14.2%). The median household income is $68,000 and the median home value is $250,000.
Conclusion
Spring Valley Lake is a private, gated community located in the Victor Valley of San Bernardino County, California. It is situated in the Mojave Desert, approximately 85 miles northeast of Los Angeles. The community was established in 1963 and is home to approximately 8,000 residents. It is known for its beautiful lake, which is the centerpiece of the community. The economy of Spring Valley Lake is largely based on tourism and recreation. The population is predominantly white (83.3%) and Hispanic (14.2%). The median household income is $68,000 and the median home value is $250,000.
Common Questions
What is Per Capita Income in Spring Valley Lake?
Per Capita income in Spring Valley Lake is $40,042.
What is the Median Family Income in Spring Valley Lake?
Median Family Income in Spring Valley Lake is $91,928.
What is the Median Household income in Spring Valley Lake?
Median Household Income in Spring Valley Lake is $90,663.
What is Income or Wage Gap in Spring Valley Lake?
Income or Wage Gap in Spring Valley Lake is 52.5%.
Women in Spring Valley Lake earn 47.5 cents for every dollar earned by a man.
What is Inequality or Gini Index in Spring Valley Lake?
Inequality or Gini Index in Spring Valley Lake is 0.43.
What is the Total Population of Spring Valley Lake?
Total Population of Spring Valley Lake is 8,764.
What is the Total Male Population of Spring Valley Lake?
Total Male Population of Spring Valley Lake is 4,174.
What is the Total Female Population of Spring Valley Lake?
Total Female Population of Spring Valley Lake is 4,590.
What is the Ratio of Males per 100 Females in Spring Valley Lake?
There are 90.94 Males per 100 Females in Spring Valley Lake.
What is the Ratio of Females per 100 Males in Spring Valley Lake?
There are 109.97 Females per 100 Males in Spring Valley Lake.
What is the Median Population Age in Spring Valley Lake?
Median Population Age in Spring Valley Lake is 39.0 Years.
What is the Average Family Size in Spring Valley Lake
Average Family Size in Spring Valley Lake is 3.4 People.
What is the Average Household Size in Spring Valley Lake
Average Household Size in Spring Valley Lake is 3.0 People.
How Large is the Labor Force in Spring Valley Lake?
There are 3,759 People in the Labor Forcein in Spring Valley Lake.
What is the Percentage of People in the Labor Force in Spring Valley Lake?
55.3% of People are in the Labor Force in Spring Valley Lake.
What is the Unemployment Rate in Spring Valley Lake?
Unemployment Rate in Spring Valley Lake is 6.2%.