Interlaken, CA Map & Demographics
Interlaken Map
Interlaken Overview
$33,500
PER CAPITA INCOME
$109,876
AVG FAMILY INCOME
$108,695
AVG HOUSEHOLD INCOME
25.3%
WAGE / INCOME GAP [ % ]
74.7¢/ $1
WAGE / INCOME GAP [ $ ]
0.43
INEQUALITY / GINI INDEX
8,039
TOTAL POPULATION
4,271
MALE POPULATION
3,768
FEMALE POPULATION
113.35
MALES / 100 FEMALES
88.22
FEMALES / 100 MALES
33.4
MEDIAN AGE
4.2
AVG FAMILY SIZE
4.0
AVG HOUSEHOLD SIZE
3,719
LABOR FORCE [ PEOPLE ]
65.4%
PERCENT IN LABOR FORCE
5.4%
UNEMPLOYMENT RATE
Income in Interlaken
Income Overview in Interlaken
Per Capita Income in Interlaken is $33,500, while median incomes of families and households are $109,876 and $108,695 respectively.
| Characteristic | Number | Measure |
| Per Capita Income | 8,039 | $33,500 |
| Median Family Income | 1,675 | $109,876 |
| Mean Family Income | 1,675 | $129,367 |
| Median Household Income | 1,945 | $108,695 |
| Mean Household Income | 1,945 | $137,852 |
| Income Deficit | 1,675 | $0 |
| Wage / Income Gap (%) | 8,039 | 25.26% |
| Wage / Income Gap ($) | 8,039 | 74.74¢ per $1 |
| Gini / Inequality Index | 8,039 | 0.43 |
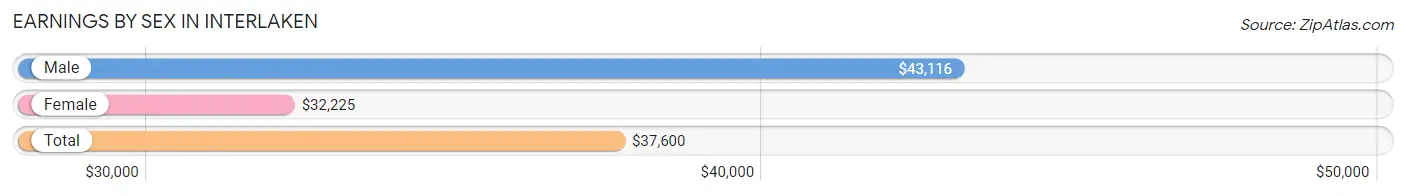
Earnings by Sex in Interlaken
Average Earnings in Interlaken are $37,600, $43,116 for men and $32,225 for women, a difference of 25.3%.
| Sex | Number | Average Earnings |
| Male | 2,089 (54.8%) | $43,116 |
| Female | 1,721 (45.2%) | $32,225 |
| Total | 3,810 (100.0%) | $37,600 |
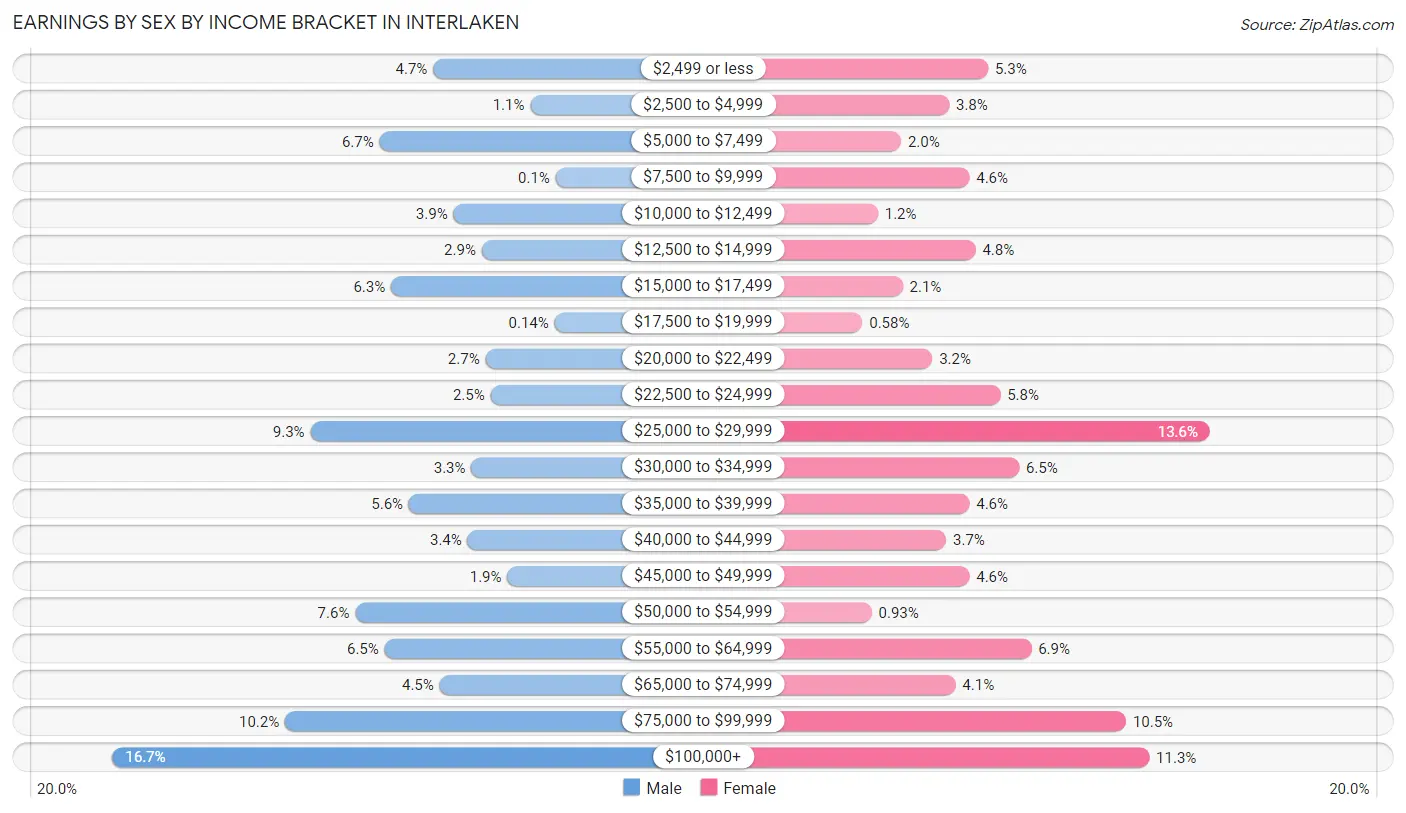
Earnings by Sex by Income Bracket in Interlaken
The most common earnings brackets in Interlaken are $100,000+ for men (349 | 16.7%) and $25,000 to $29,999 for women (234 | 13.6%).
| Income | Male | Female |
| $2,499 or less | 98 (4.7%) | 91 (5.3%) |
| $2,500 to $4,999 | 22 (1.1%) | 66 (3.8%) |
| $5,000 to $7,499 | 140 (6.7%) | 35 (2.0%) |
| $7,500 to $9,999 | 2 (0.1%) | 79 (4.6%) |
| $10,000 to $12,499 | 82 (3.9%) | 20 (1.2%) |
| $12,500 to $14,999 | 60 (2.9%) | 83 (4.8%) |
| $15,000 to $17,499 | 131 (6.3%) | 36 (2.1%) |
| $17,500 to $19,999 | 3 (0.1%) | 10 (0.6%) |
| $20,000 to $22,499 | 57 (2.7%) | 55 (3.2%) |
| $22,500 to $24,999 | 53 (2.5%) | 99 (5.8%) |
| $25,000 to $29,999 | 194 (9.3%) | 234 (13.6%) |
| $30,000 to $34,999 | 68 (3.3%) | 111 (6.5%) |
| $35,000 to $39,999 | 117 (5.6%) | 79 (4.6%) |
| $40,000 to $44,999 | 71 (3.4%) | 64 (3.7%) |
| $45,000 to $49,999 | 40 (1.9%) | 79 (4.6%) |
| $50,000 to $54,999 | 159 (7.6%) | 16 (0.9%) |
| $55,000 to $64,999 | 136 (6.5%) | 119 (6.9%) |
| $65,000 to $74,999 | 93 (4.4%) | 70 (4.1%) |
| $75,000 to $99,999 | 214 (10.2%) | 180 (10.5%) |
| $100,000+ | 349 (16.7%) | 195 (11.3%) |
| Total | 2,089 (100.0%) | 1,721 (100.0%) |
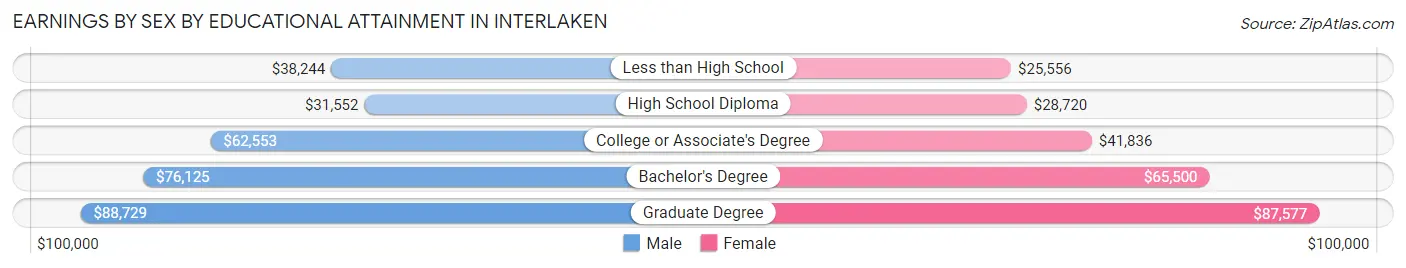
Earnings by Sex by Educational Attainment in Interlaken
Average earnings in Interlaken are $50,737 for men and $40,391 for women, a difference of 20.4%. Men with an educational attainment of graduate degree enjoy the highest average annual earnings of $88,729, while those with high school diploma education earn the least with $31,552. Women with an educational attainment of graduate degree earn the most with the average annual earnings of $87,577, while those with less than high school education have the smallest earnings of $25,556.
| Educational Attainment | Male Income | Female Income |
| Less than High School | $38,244 | $25,556 |
| High School Diploma | $31,552 | $28,720 |
| College or Associate's Degree | $62,553 | $41,836 |
| Bachelor's Degree | $76,125 | $65,500 |
| Graduate Degree | $88,729 | $87,577 |
| Total | $50,737 | $40,391 |
Family Income in Interlaken
Family Income Brackets in Interlaken
According to the Interlaken family income data, there are 449 families falling into the $100,000 to $149,999 income range, which is the most common income bracket and makes up 26.8% of all families.
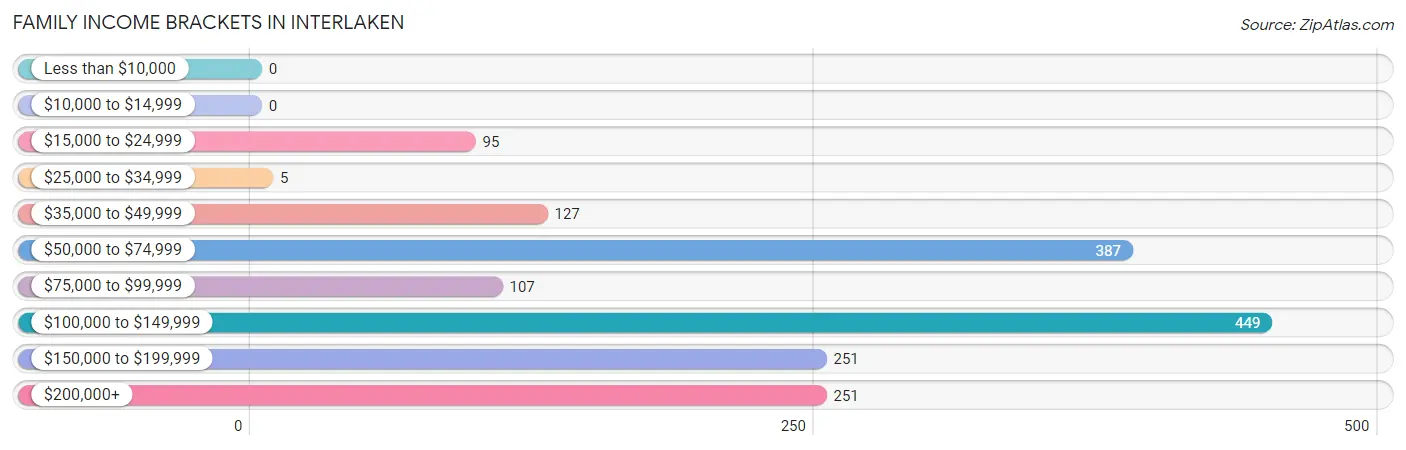
| Income Bracket | # Families | % Families |
| Less than $10,000 | 0 | 0.0% |
| $10,000 to $14,999 | 0 | 0.0% |
| $15,000 to $24,999 | 95 | 5.7% |
| $25,000 to $34,999 | 5 | 0.3% |
| $35,000 to $49,999 | 127 | 7.6% |
| $50,000 to $74,999 | 387 | 23.1% |
| $75,000 to $99,999 | 107 | 6.4% |
| $100,000 to $149,999 | 449 | 26.8% |
| $150,000 to $199,999 | 251 | 15.0% |
| $200,000+ | 251 | 15.0% |
Family Income by Famaliy Size in Interlaken
4-person families (391 | 23.3%) account for the highest median family income in Interlaken with $135,820 per family, while 2-person families (368 | 22.0%) have the highest median income of $49,286 per family member.
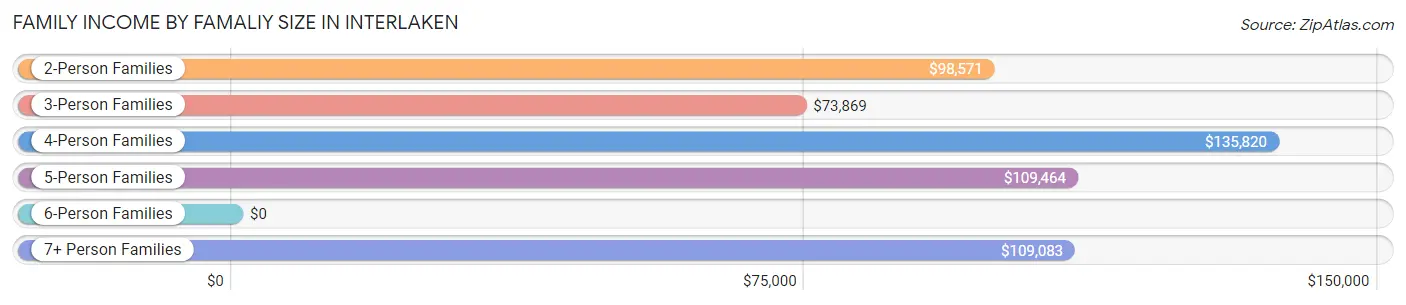
| Income Bracket | # Families | Median Income |
| 2-Person Families | 368 (22.0%) | $98,571 |
| 3-Person Families | 306 (18.3%) | $73,869 |
| 4-Person Families | 391 (23.3%) | $135,820 |
| 5-Person Families | 259 (15.5%) | $109,464 |
| 6-Person Families | 189 (11.3%) | $0 |
| 7+ Person Families | 162 (9.7%) | $109,083 |
| Total | 1,675 (100.0%) | $109,876 |
Family Income by Number of Earners in Interlaken
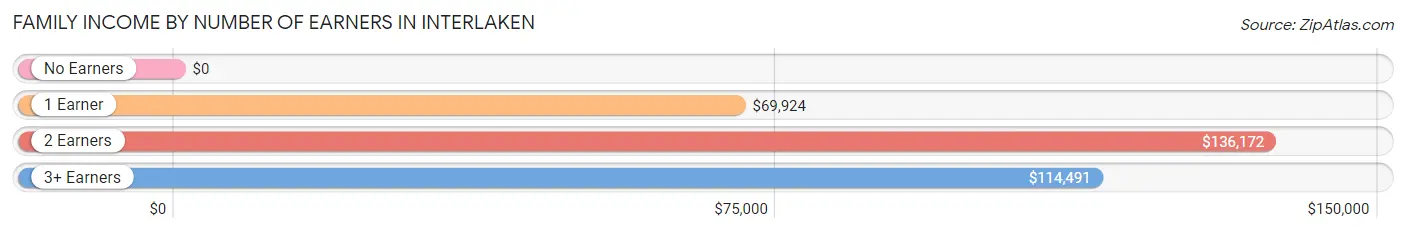
| Number of Earners | # Families | Median Income |
| No Earners | 105 (6.3%) | $0 |
| 1 Earner | 418 (25.0%) | $69,924 |
| 2 Earners | 732 (43.7%) | $136,172 |
| 3+ Earners | 420 (25.1%) | $114,491 |
| Total | 1,675 (100.0%) | $109,876 |
Household Income in Interlaken
Household Income Brackets in Interlaken
With 547 households falling in the category, the $100,000 to $149,999 income range is the most frequent in Interlaken, accounting for 28.1% of all households. In contrast, only 10 households (0.5%) fall into the $25,000 to $34,999 income bracket, making it the least populous group.
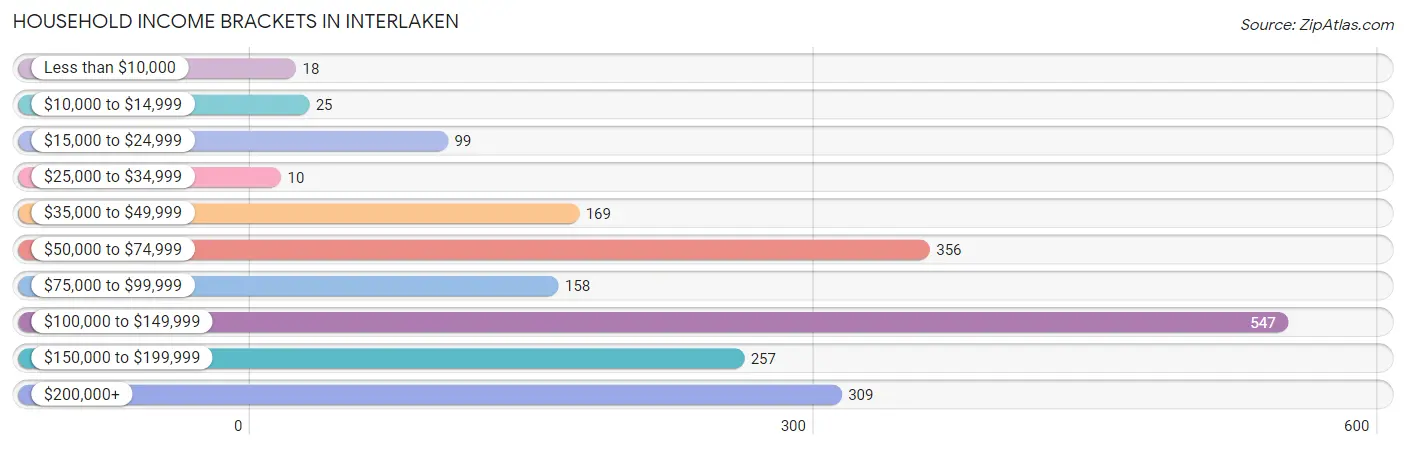
| Income Bracket | # Households | % Households |
| Less than $10,000 | 18 | 0.9% |
| $10,000 to $14,999 | 25 | 1.3% |
| $15,000 to $24,999 | 99 | 5.1% |
| $25,000 to $34,999 | 10 | 0.5% |
| $35,000 to $49,999 | 169 | 8.7% |
| $50,000 to $74,999 | 356 | 18.3% |
| $75,000 to $99,999 | 158 | 8.1% |
| $100,000 to $149,999 | 547 | 28.1% |
| $150,000 to $199,999 | 257 | 13.2% |
| $200,000+ | 309 | 15.9% |
Household Income by Householder Age in Interlaken
The median household income in Interlaken is $108,695, with the highest median household income of $132,578 found in the 45 to 64 years age bracket for the primary householder. A total of 819 households (42.1%) fall into this category.
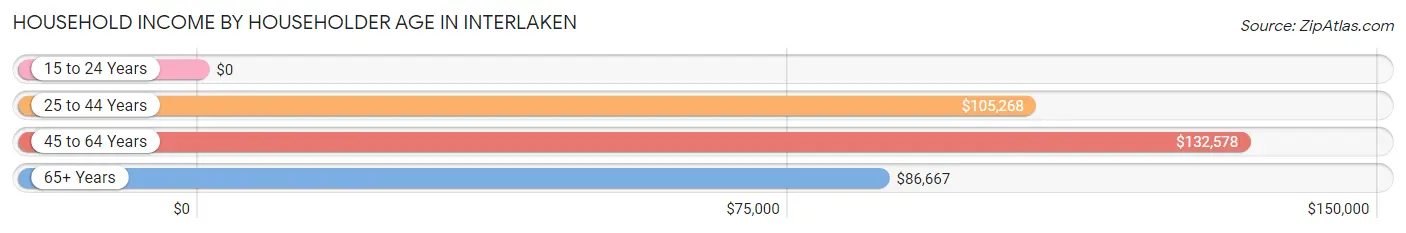
| Income Bracket | # Households | Median Income |
| 15 to 24 Years | 0 (0.0%) | $0 |
| 25 to 44 Years | 660 (33.9%) | $105,268 |
| 45 to 64 Years | 819 (42.1%) | $132,578 |
| 65+ Years | 466 (24.0%) | $86,667 |
| Total | 1,945 (100.0%) | $108,695 |
Poverty in Interlaken
Income Below Poverty by Sex and Age in Interlaken
With 7.2% poverty level for males and 6.8% for females among the residents of Interlaken, 65 to 74 year old males and 45 to 54 year old females are the most vulnerable to poverty, with 65 males (20.9%) and 125 females (34.0%) in their respective age groups living below the poverty level.
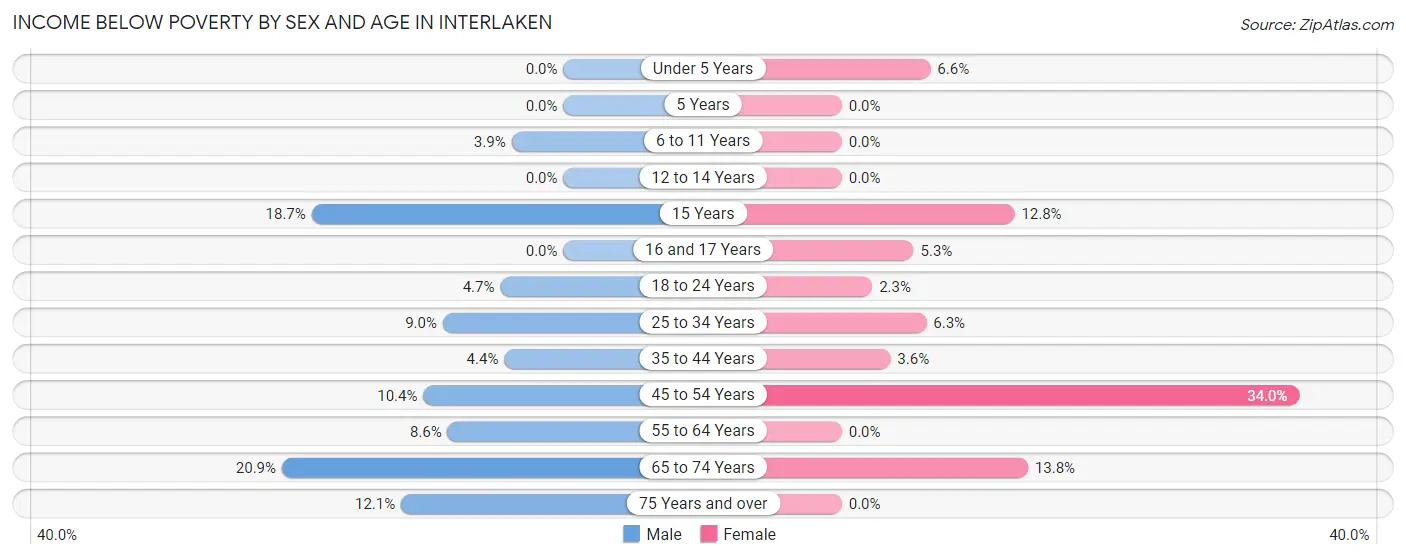
| Age Bracket | Male | Female |
| Under 5 Years | 0 (0.0%) | 24 (6.6%) |
| 5 Years | 0 (0.0%) | 0 (0.0%) |
| 6 to 11 Years | 22 (3.8%) | 0 (0.0%) |
| 12 to 14 Years | 0 (0.0%) | 0 (0.0%) |
| 15 Years | 20 (18.7%) | 15 (12.8%) |
| 16 and 17 Years | 0 (0.0%) | 4 (5.3%) |
| 18 to 24 Years | 18 (4.7%) | 7 (2.3%) |
| 25 to 34 Years | 58 (8.9%) | 24 (6.3%) |
| 35 to 44 Years | 23 (4.4%) | 19 (3.6%) |
| 45 to 54 Years | 44 (10.4%) | 125 (34.0%) |
| 55 to 64 Years | 38 (8.6%) | 0 (0.0%) |
| 65 to 74 Years | 65 (20.9%) | 38 (13.8%) |
| 75 Years and over | 20 (12.0%) | 0 (0.0%) |
| Total | 308 (7.2%) | 256 (6.8%) |
Income Above Poverty by Sex and Age in Interlaken
According to the poverty statistics in Interlaken, males aged under 5 years and females aged 5 years are the age groups that are most secure financially, with 100.0% of males and 100.0% of females in these age groups living above the poverty line.
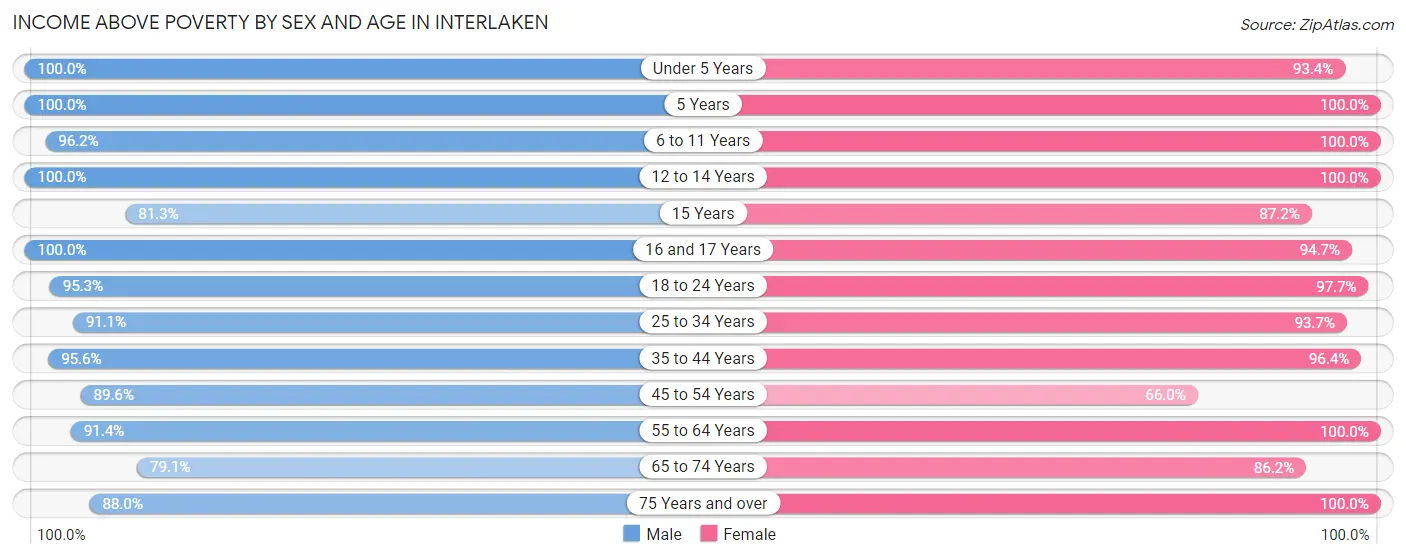
| Age Bracket | Male | Female |
| Under 5 Years | 311 (100.0%) | 341 (93.4%) |
| 5 Years | 46 (100.0%) | 39 (100.0%) |
| 6 to 11 Years | 550 (96.2%) | 382 (100.0%) |
| 12 to 14 Years | 246 (100.0%) | 145 (100.0%) |
| 15 Years | 87 (81.3%) | 102 (87.2%) |
| 16 and 17 Years | 90 (100.0%) | 71 (94.7%) |
| 18 to 24 Years | 367 (95.3%) | 303 (97.7%) |
| 25 to 34 Years | 590 (91.0%) | 358 (93.7%) |
| 35 to 44 Years | 501 (95.6%) | 508 (96.4%) |
| 45 to 54 Years | 379 (89.6%) | 243 (66.0%) |
| 55 to 64 Years | 404 (91.4%) | 491 (100.0%) |
| 65 to 74 Years | 246 (79.1%) | 237 (86.2%) |
| 75 Years and over | 146 (87.9%) | 270 (100.0%) |
| Total | 3,963 (92.8%) | 3,490 (93.2%) |
Income Below Poverty Among Married-Couple Families in Interlaken
The poverty statistics for married-couple families in Interlaken show that 1.2% or 15 of the total 1,292 families live below the poverty line. Families with 1 or 2 children have the highest poverty rate of 2.8%, comprising of 15 families. On the other hand, families with no children have the lowest poverty rate of 0.0%, which includes 0 families.
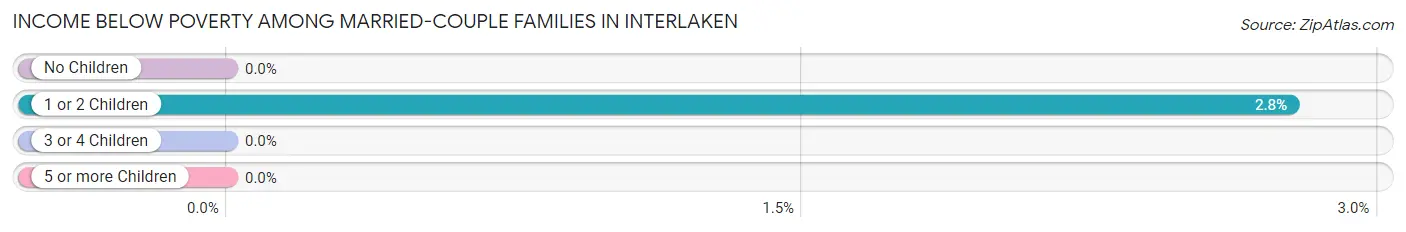
| Children | Above Poverty | Below Poverty |
| No Children | 397 (100.0%) | 0 (0.0%) |
| 1 or 2 Children | 526 (97.2%) | 15 (2.8%) |
| 3 or 4 Children | 306 (100.0%) | 0 (0.0%) |
| 5 or more Children | 48 (100.0%) | 0 (0.0%) |
| Total | 1,277 (98.8%) | 15 (1.2%) |
Income Below Poverty Among Single-Parent Households in Interlaken
According to the poverty data in Interlaken, 13.7% or 23 single-father households and 9.8% or 21 single-mother households are living below the poverty line. Among single-father households, those with no children have the highest poverty rate, with 23 households (18.7%) experiencing poverty. Likewise, among single-mother households, those with 1 or 2 children have the highest poverty rate, with 21 households (31.3%) falling below the poverty line.
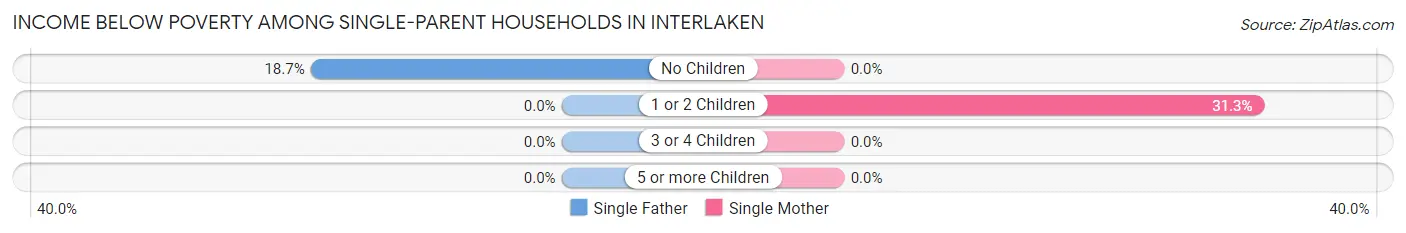
| Children | Single Father | Single Mother |
| No Children | 23 (18.7%) | 0 (0.0%) |
| 1 or 2 Children | 0 (0.0%) | 21 (31.3%) |
| 3 or 4 Children | 0 (0.0%) | 0 (0.0%) |
| 5 or more Children | 0 (0.0%) | 0 (0.0%) |
| Total | 23 (13.7%) | 21 (9.8%) |
Income Below Poverty Among Married-Couple vs Single-Parent Households in Interlaken
The poverty data for Interlaken shows that 15 of the married-couple family households (1.2%) and 44 of the single-parent households (11.5%) are living below the poverty level. Within the married-couple family households, those with 1 or 2 children have the highest poverty rate, with 15 households (2.8%) falling below the poverty line. Among the single-parent households, those with 1 or 2 children have the highest poverty rate, with 21 household (19.1%) living below poverty.
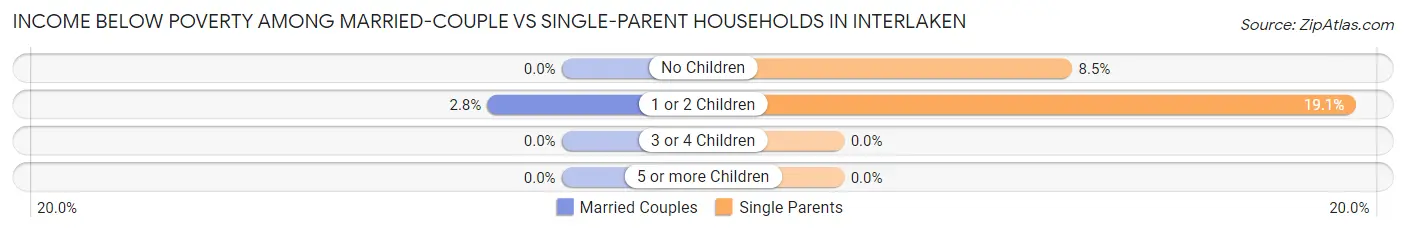
| Children | Married-Couple Families | Single-Parent Households |
| No Children | 0 (0.0%) | 23 (8.5%) |
| 1 or 2 Children | 15 (2.8%) | 21 (19.1%) |
| 3 or 4 Children | 0 (0.0%) | 0 (0.0%) |
| 5 or more Children | 0 (0.0%) | 0 (0.0%) |
| Total | 15 (1.2%) | 44 (11.5%) |
Race in Interlaken
The most populous races in Interlaken are Hispanic or Latino (6,282 | 78.1%), Some other Race (3,149 | 39.2%), and White / Caucasian (2,379 | 29.6%).
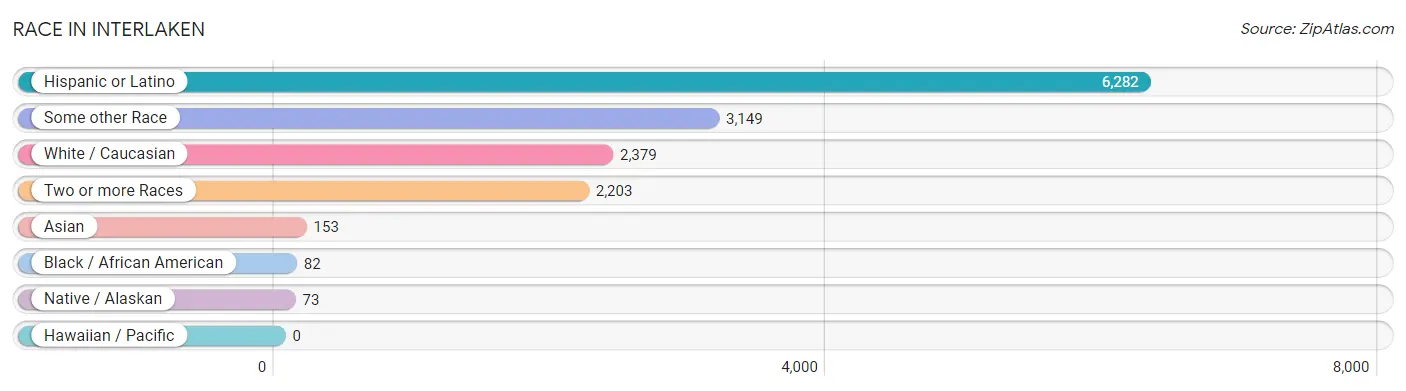
| Race | # Population | % Population |
| Asian | 153 | 1.9% |
| Black / African American | 82 | 1.0% |
| Hawaiian / Pacific | 0 | 0.0% |
| Hispanic or Latino | 6,282 | 78.1% |
| Native / Alaskan | 73 | 0.9% |
| White / Caucasian | 2,379 | 29.6% |
| Two or more Races | 2,203 | 27.4% |
| Some other Race | 3,149 | 39.2% |
| Total | 8,039 | 100.0% |
Ancestry in Interlaken
The most populous ancestries reported in Interlaken are Mexican (6,094 | 75.8%), German (321 | 4.0%), Korean (299 | 3.7%), English (274 | 3.4%), and Irish (218 | 2.7%), together accounting for 89.6% of all Interlaken residents.
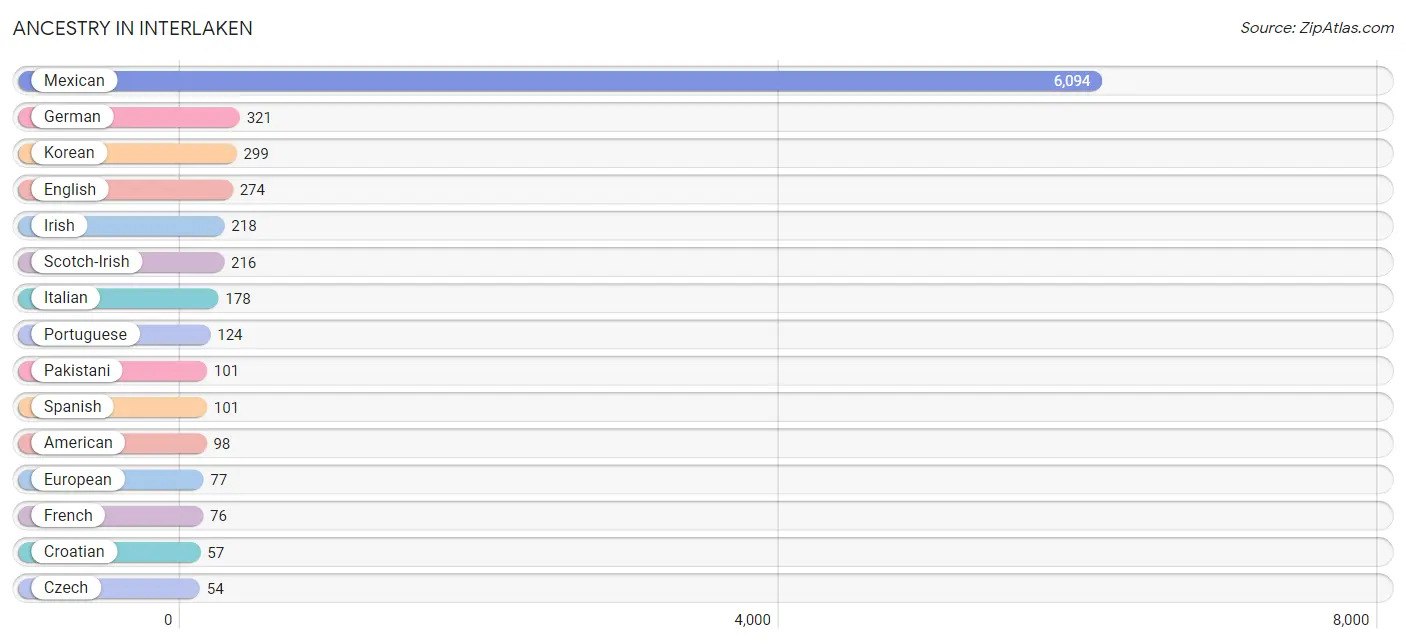
| Ancestry | # Population | % Population |
| American | 98 | 1.2% |
| Apache | 7 | 0.1% |
| Armenian | 10 | 0.1% |
| Bhutanese | 33 | 0.4% |
| British | 8 | 0.1% |
| Canadian | 21 | 0.3% |
| Central American | 23 | 0.3% |
| Cherokee | 37 | 0.5% |
| Croatian | 57 | 0.7% |
| Czech | 54 | 0.7% |
| Danish | 6 | 0.1% |
| English | 274 | 3.4% |
| European | 77 | 1.0% |
| Finnish | 10 | 0.1% |
| French | 76 | 0.9% |
| French Canadian | 5 | 0.1% |
| German | 321 | 4.0% |
| Guatemalan | 23 | 0.3% |
| Hungarian | 36 | 0.4% |
| Iranian | 12 | 0.2% |
| Irish | 218 | 2.7% |
| Iroquois | 6 | 0.1% |
| Italian | 178 | 2.2% |
| Japanese | 5 | 0.1% |
| Korean | 299 | 3.7% |
| Mexican | 6,094 | 75.8% |
| Mexican American Indian | 7 | 0.1% |
| Navajo | 9 | 0.1% |
| Northern European | 36 | 0.4% |
| Norwegian | 15 | 0.2% |
| Pakistani | 101 | 1.3% |
| Polish | 21 | 0.3% |
| Portuguese | 124 | 1.5% |
| Russian | 6 | 0.1% |
| Scandinavian | 4 | 0.1% |
| Scotch-Irish | 216 | 2.7% |
| Scottish | 35 | 0.4% |
| Slavic | 24 | 0.3% |
| Slovak | 22 | 0.3% |
| Spaniard | 28 | 0.4% |
| Spanish | 101 | 1.3% |
| Sri Lankan | 50 | 0.6% |
| Swedish | 17 | 0.2% |
| Yaqui | 9 | 0.1% | View All 44 Rows |
Immigrants in Interlaken
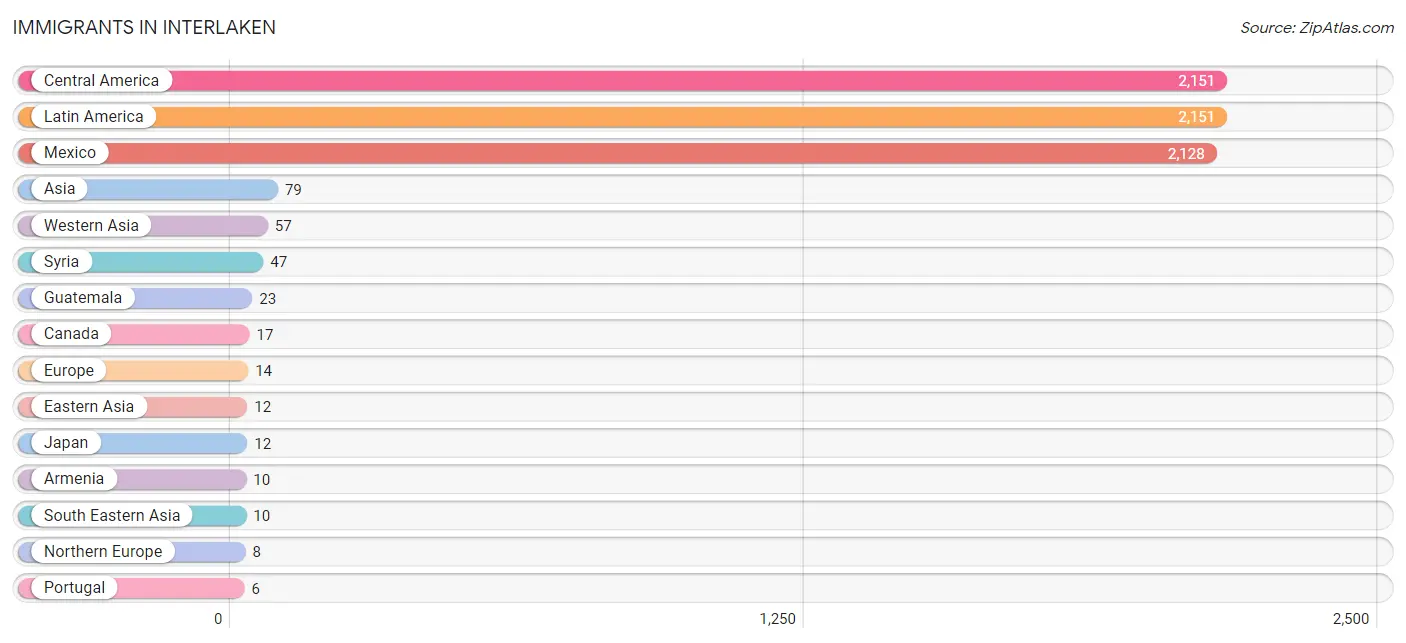
The most numerous immigrant groups reported in Interlaken came from Central America (2,151 | 26.8%), Latin America (2,151 | 26.8%), Mexico (2,128 | 26.5%), Asia (79 | 1.0%), and Western Asia (57 | 0.7%), together accounting for 81.7% of all Interlaken residents.
| Immigration Origin | # Population | % Population |
| Armenia | 10 | 0.1% |
| Asia | 79 | 1.0% |
| Canada | 17 | 0.2% |
| Central America | 2,151 | 26.8% |
| Eastern Asia | 12 | 0.2% |
| England | 3 | 0.0% |
| Europe | 14 | 0.2% |
| Guatemala | 23 | 0.3% |
| Japan | 12 | 0.2% |
| Latin America | 2,151 | 26.8% |
| Mexico | 2,128 | 26.5% |
| Northern Europe | 8 | 0.1% |
| Philippines | 5 | 0.1% |
| Portugal | 6 | 0.1% |
| Scotland | 5 | 0.1% |
| South Eastern Asia | 10 | 0.1% |
| Southern Europe | 6 | 0.1% |
| Syria | 47 | 0.6% |
| Thailand | 5 | 0.1% |
| Western Asia | 57 | 0.7% | View All 20 Rows |
Sex and Age in Interlaken
Sex and Age in Interlaken
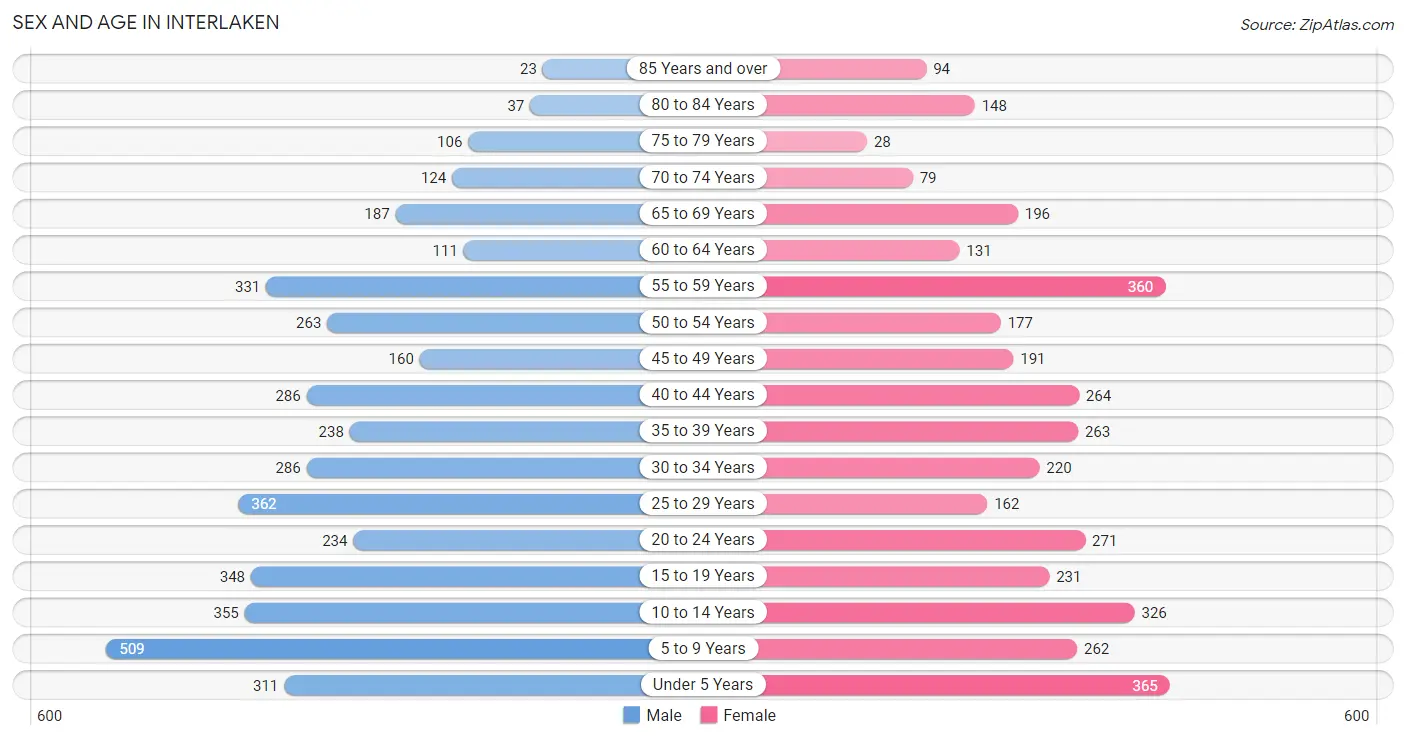
The most populous age groups in Interlaken are 5 to 9 Years (509 | 11.9%) for men and Under 5 Years (365 | 9.7%) for women.
| Age Bracket | Male | Female |
| Under 5 Years | 311 (7.3%) | 365 (9.7%) |
| 5 to 9 Years | 509 (11.9%) | 262 (7.0%) |
| 10 to 14 Years | 355 (8.3%) | 326 (8.6%) |
| 15 to 19 Years | 348 (8.2%) | 231 (6.1%) |
| 20 to 24 Years | 234 (5.5%) | 271 (7.2%) |
| 25 to 29 Years | 362 (8.5%) | 162 (4.3%) |
| 30 to 34 Years | 286 (6.7%) | 220 (5.8%) |
| 35 to 39 Years | 238 (5.6%) | 263 (7.0%) |
| 40 to 44 Years | 286 (6.7%) | 264 (7.0%) |
| 45 to 49 Years | 160 (3.7%) | 191 (5.1%) |
| 50 to 54 Years | 263 (6.2%) | 177 (4.7%) |
| 55 to 59 Years | 331 (7.7%) | 360 (9.6%) |
| 60 to 64 Years | 111 (2.6%) | 131 (3.5%) |
| 65 to 69 Years | 187 (4.4%) | 196 (5.2%) |
| 70 to 74 Years | 124 (2.9%) | 79 (2.1%) |
| 75 to 79 Years | 106 (2.5%) | 28 (0.7%) |
| 80 to 84 Years | 37 (0.9%) | 148 (3.9%) |
| 85 Years and over | 23 (0.5%) | 94 (2.5%) |
| Total | 4,271 (100.0%) | 3,768 (100.0%) |
Families and Households in Interlaken
Median Family Size in Interlaken
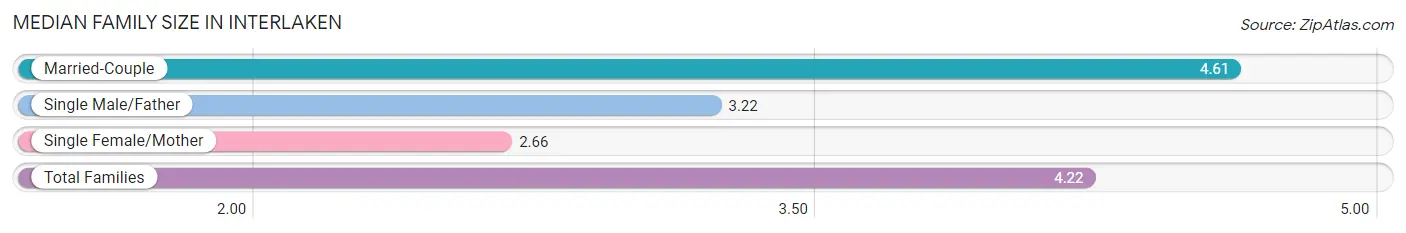
The median family size in Interlaken is 4.22 persons per family, with married-couple families (1,292 | 77.1%) accounting for the largest median family size of 4.61 persons per family. On the other hand, single female/mother families (215 | 12.8%) represent the smallest median family size with 2.66 persons per family.
| Family Type | # Families | Family Size |
| Married-Couple | 1,292 (77.1%) | 4.61 |
| Single Male/Father | 168 (10.0%) | 3.22 |
| Single Female/Mother | 215 (12.8%) | 2.66 |
| Total Families | 1,675 (100.0%) | 4.22 |
Median Household Size in Interlaken
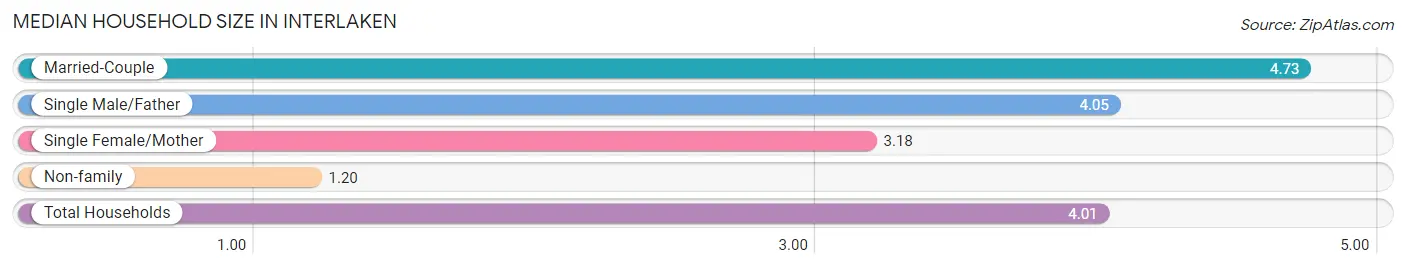
The median household size in Interlaken is 4.01 persons per household, with married-couple households (1,292 | 66.4%) accounting for the largest median household size of 4.73 persons per household. non-family households (270 | 13.9%) represent the smallest median household size with 1.20 persons per household.
| Household Type | # Households | Household Size |
| Married-Couple | 1,292 (66.4%) | 4.73 |
| Single Male/Father | 168 (8.6%) | 4.05 |
| Single Female/Mother | 215 (11.1%) | 3.18 |
| Non-family | 270 (13.9%) | 1.20 |
| Total Households | 1,945 (100.0%) | 4.01 |
Household Size by Marriage Status in Interlaken
Out of a total of 1,945 households in Interlaken, 1,675 (86.1%) are family households, while 270 (13.9%) are nonfamily households. The most numerous type of family households are 4-person households, comprising 366, and the most common type of nonfamily households are 1-person households, comprising 232.
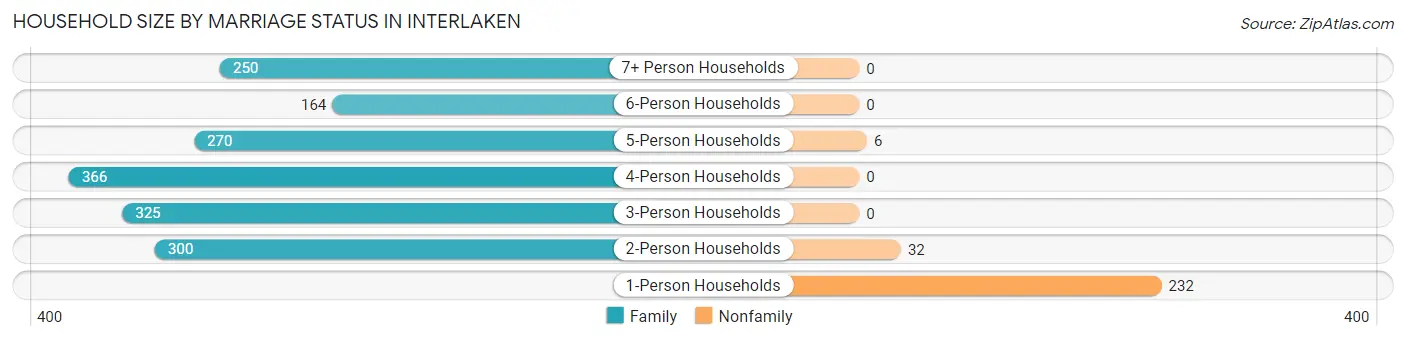
| Household Size | Family Households | Nonfamily Households |
| 1-Person Households | - | 232 (11.9%) |
| 2-Person Households | 300 (15.4%) | 32 (1.7%) |
| 3-Person Households | 325 (16.7%) | 0 (0.0%) |
| 4-Person Households | 366 (18.8%) | 0 (0.0%) |
| 5-Person Households | 270 (13.9%) | 6 (0.3%) |
| 6-Person Households | 164 (8.4%) | 0 (0.0%) |
| 7+ Person Households | 250 (12.9%) | 0 (0.0%) |
| Total | 1,675 (86.1%) | 270 (13.9%) |
Female Fertility in Interlaken
Fertility by Age in Interlaken
Average fertility rate in Interlaken is 107.0 births per 1,000 women. Women in the age bracket of 20 to 34 years have the highest fertility rate with 136.0 births per 1,000 women. Women in the age bracket of 20 to 34 years acount for 51.4% of all women with births.
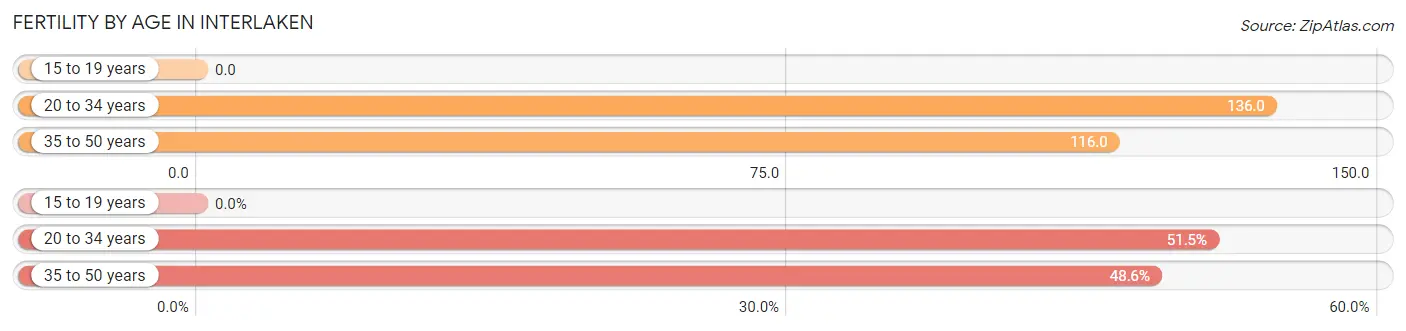
| Age Bracket | Women with Births | Births / 1,000 Women |
| 15 to 19 years | 0 (0.0%) | 0.0 |
| 20 to 34 years | 89 (51.4%) | 136.0 |
| 35 to 50 years | 84 (48.5%) | 116.0 |
| Total | 173 (100.0%) | 107.0 |
Fertility by Age by Marriage Status in Interlaken
50.9% of women with births (173) in Interlaken are married. The highest percentage of unmarried women with births falls into 20 to 34 years age bracket with 95.5% of them unmarried at the time of birth, while the lowest percentage of unmarried women with births belong to 35 to 50 years age bracket with 0.0% of them unmarried.
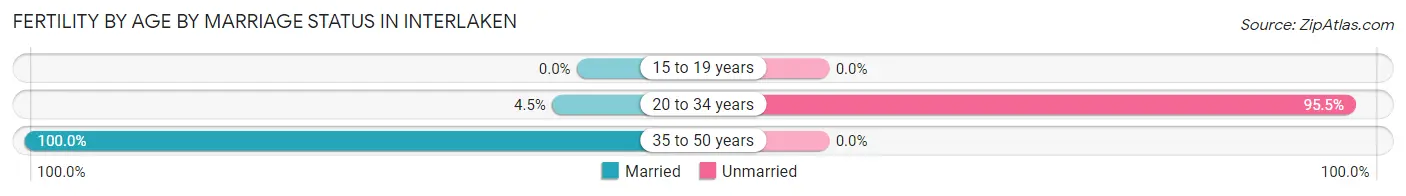
| Age Bracket | Married | Unmarried |
| 15 to 19 years | 0 (0.0%) | 0 (0.0%) |
| 20 to 34 years | 4 (4.5%) | 85 (95.5%) |
| 35 to 50 years | 84 (100.0%) | 0 (0.0%) |
| Total | 88 (50.9%) | 85 (49.1%) |
Fertility by Education in Interlaken
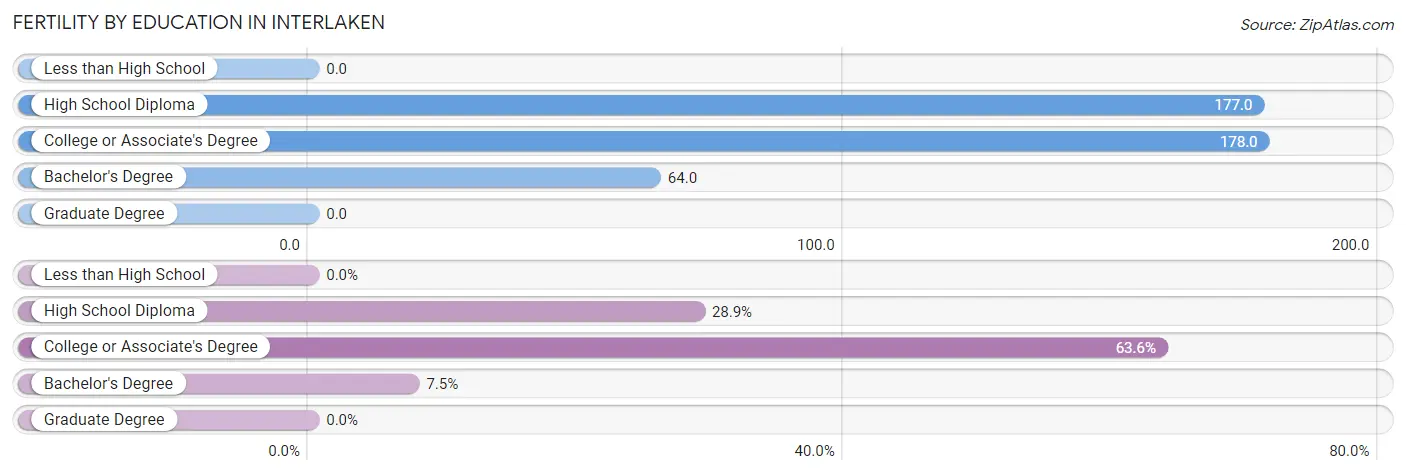
| Educational Attainment | Women with Births | Births / 1,000 Women |
| Less than High School | 0 (0.0%) | 0.0 |
| High School Diploma | 50 (28.9%) | 177.0 |
| College or Associate's Degree | 110 (63.6%) | 178.0 |
| Bachelor's Degree | 13 (7.5%) | 64.0 |
| Graduate Degree | 0 (0.0%) | 0.0 |
| Total | 173 (100.0%) | 107.0 |
Fertility by Education by Marriage Status in Interlaken
49.1% of women with births in Interlaken are unmarried. Women with the educational attainment of high school diploma are most likely to be married with 100.0% of them married at childbirth, while women with the educational attainment of college or associate's degree are least likely to be married with 77.3% of them unmarried at childbirth.
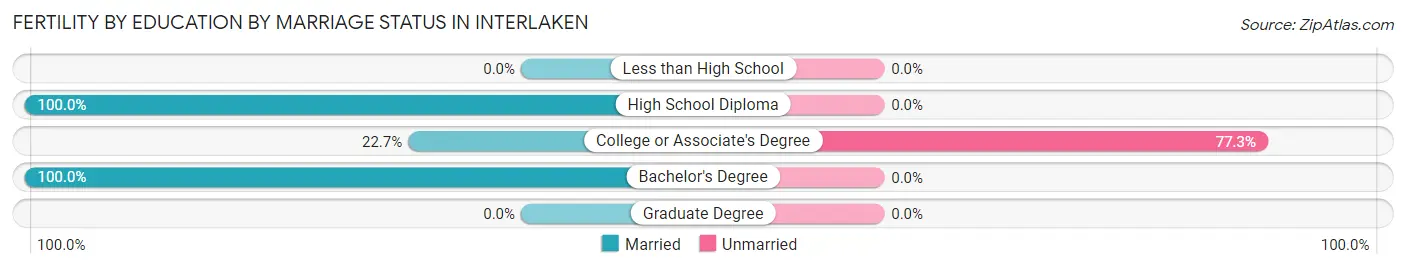
| Educational Attainment | Married | Unmarried |
| Less than High School | 0 (0.0%) | 0 (0.0%) |
| High School Diploma | 50 (100.0%) | 0 (0.0%) |
| College or Associate's Degree | 25 (22.7%) | 85 (77.3%) |
| Bachelor's Degree | 13 (100.0%) | 0 (0.0%) |
| Graduate Degree | 0 (0.0%) | 0 (0.0%) |
| Total | 88 (50.9%) | 85 (49.1%) |
Employment Characteristics in Interlaken
Employment by Class of Employer in Interlaken
Among the 3,336 employed individuals in Interlaken, private company employees (2,100 | 62.9%), local government employees (453 | 13.6%), and self-employed (not incorporated) (355 | 10.6%) make up the most common classes of employment.
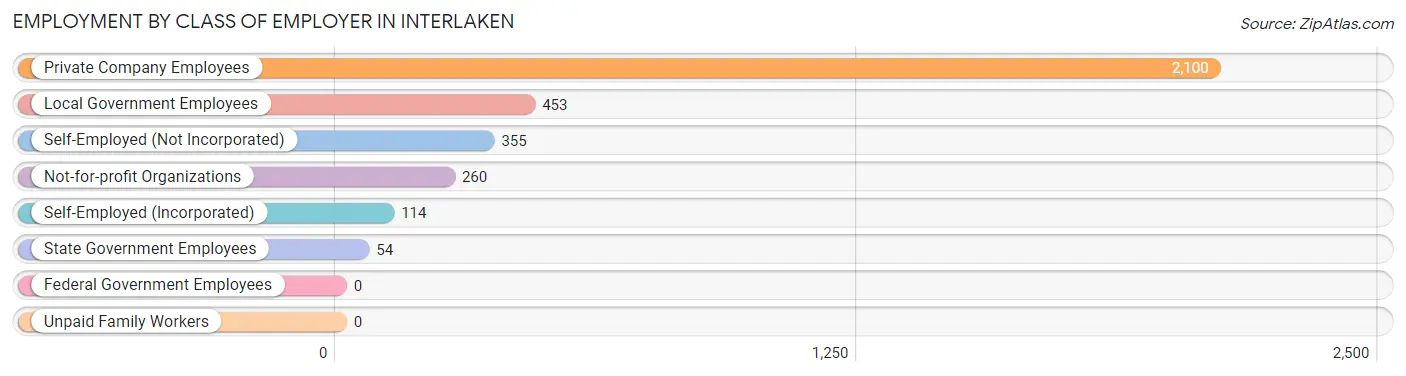
| Employer Class | # Employees | % Employees |
| Private Company Employees | 2,100 | 62.9% |
| Self-Employed (Incorporated) | 114 | 3.4% |
| Self-Employed (Not Incorporated) | 355 | 10.6% |
| Not-for-profit Organizations | 260 | 7.8% |
| Local Government Employees | 453 | 13.6% |
| State Government Employees | 54 | 1.6% |
| Federal Government Employees | 0 | 0.0% |
| Unpaid Family Workers | 0 | 0.0% |
| Total | 3,336 | 100.0% |
Employment Status by Age in Interlaken
According to the labor force statistics for Interlaken, out of the total population over 16 years of age (5,687), 65.4% or 3,719 individuals are in the labor force, with 5.4% or 201 of them unemployed. The age group with the highest labor force participation rate is 25 to 29 years, with 96.9% or 508 individuals in the labor force. Within the labor force, the 16 to 19 years age range has the highest percentage of unemployed individuals, with 15.7% or 17 of them being unemployed.
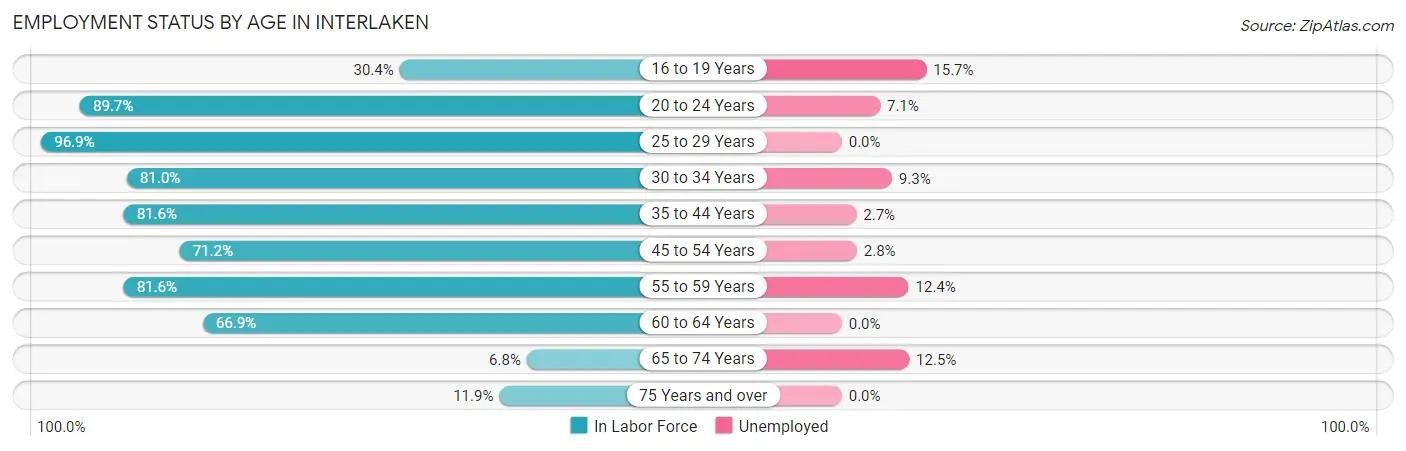
| Age Bracket | In Labor Force | Unemployed |
| 16 to 19 Years | 108 (30.4%) | 17 (15.7%) |
| 20 to 24 Years | 453 (89.7%) | 32 (7.1%) |
| 25 to 29 Years | 508 (96.9%) | 0 (0.0%) |
| 30 to 34 Years | 410 (81.0%) | 38 (9.3%) |
| 35 to 44 Years | 858 (81.6%) | 23 (2.7%) |
| 45 to 54 Years | 563 (71.2%) | 16 (2.8%) |
| 55 to 59 Years | 564 (81.6%) | 70 (12.4%) |
| 60 to 64 Years | 162 (66.9%) | 0 (0.0%) |
| 65 to 74 Years | 40 (6.8%) | 5 (12.5%) |
| 75 Years and over | 52 (11.9%) | 0 (0.0%) |
| Total | 3,719 (65.4%) | 201 (5.4%) |
Employment Status by Educational Attainment in Interlaken
According to labor force statistics for Interlaken, 80.6% of individuals (3,067) out of the total population between 25 and 64 years of age (3,805) are in the labor force, with 4.8% or 147 of them being unemployed. The group with the highest labor force participation rate are those with the educational attainment of bachelor's degree or higher, with 93.6% or 647 individuals in the labor force. Within the labor force, individuals with college / associate degree education have the highest percentage of unemployment, with 7.7% or 79 of them being unemployed.
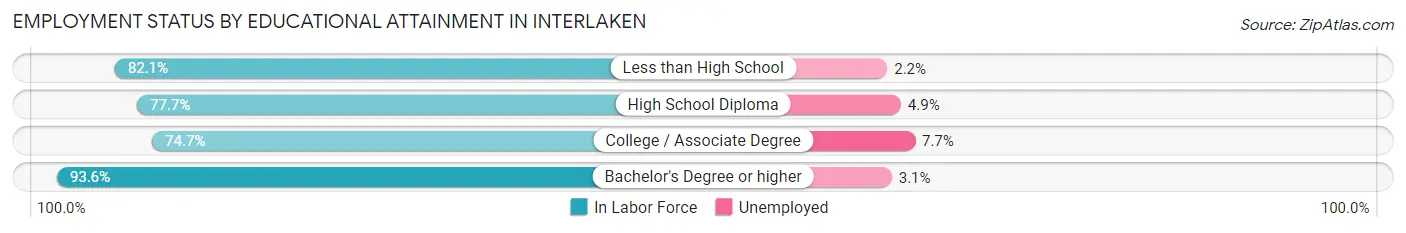
| Educational Attainment | In Labor Force | Unemployed |
| Less than High School | 736 (82.1%) | 20 (2.2%) |
| High School Diploma | 651 (77.7%) | 41 (4.9%) |
| College / Associate Degree | 1,031 (74.7%) | 106 (7.7%) |
| Bachelor's Degree or higher | 647 (93.6%) | 21 (3.1%) |
| Total | 3,067 (80.6%) | 183 (4.8%) |
Employment Occupations by Sex in Interlaken
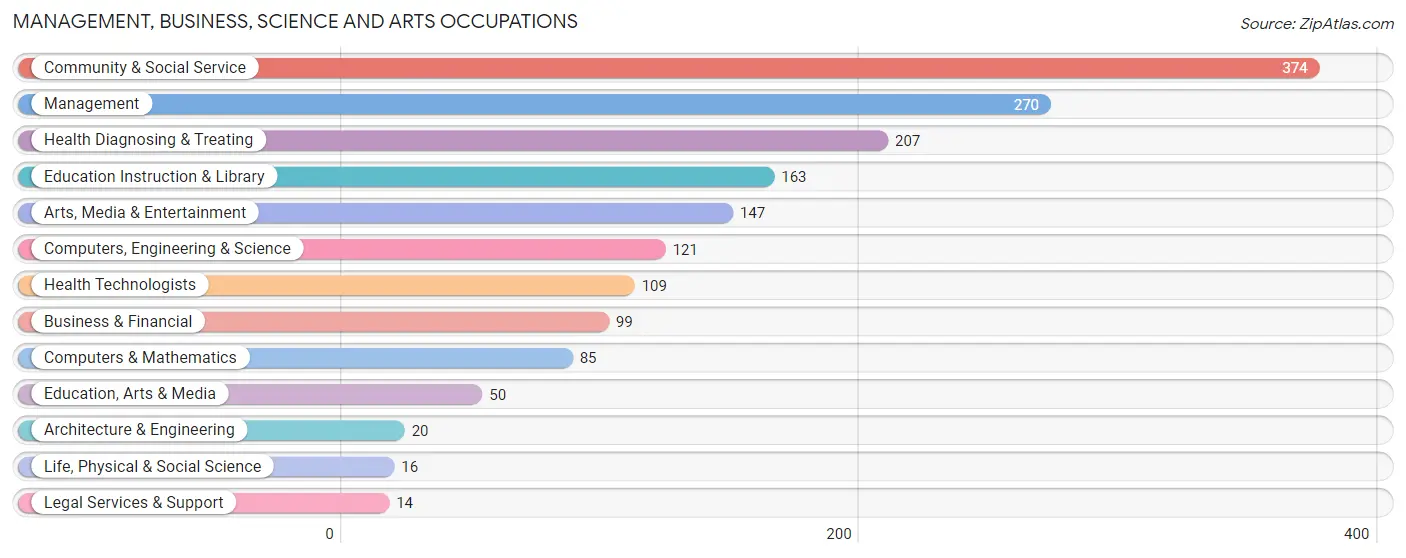
Management, Business, Science and Arts Occupations
The most common Management, Business, Science and Arts occupations in Interlaken are Community & Social Service (374 | 10.6%), Management (270 | 7.7%), Health Diagnosing & Treating (207 | 5.9%), Education Instruction & Library (163 | 4.6%), and Arts, Media & Entertainment (147 | 4.2%).
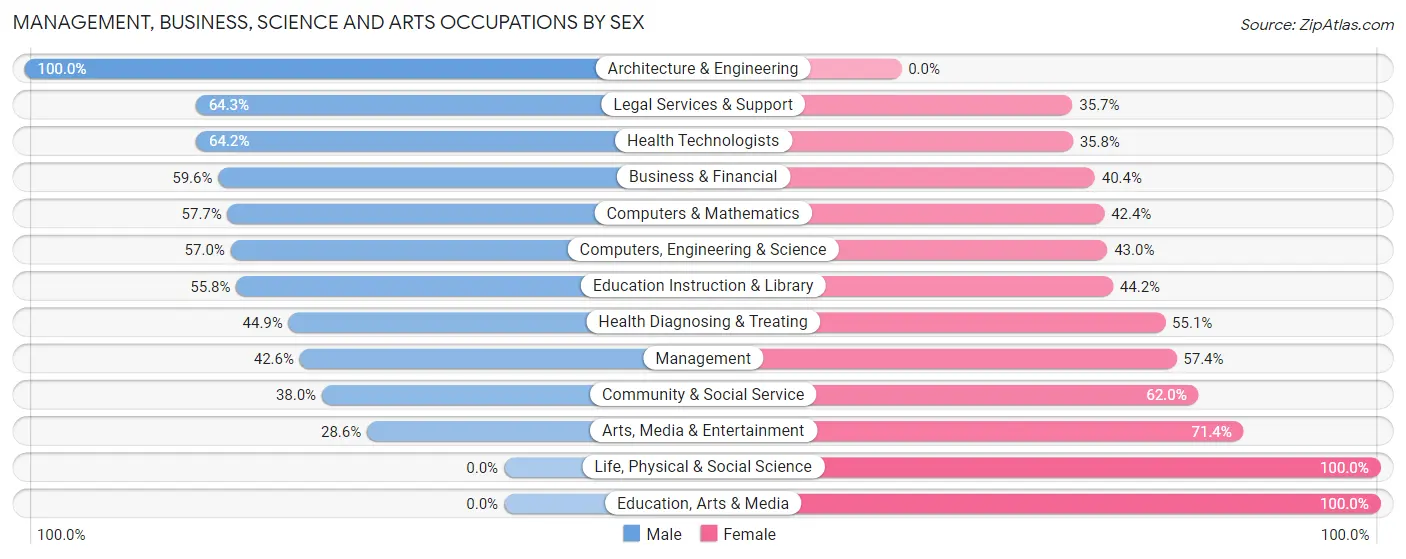
Management, Business, Science and Arts Occupations by Sex
Within the Management, Business, Science and Arts occupations in Interlaken, the most male-oriented occupations are Architecture & Engineering (100.0%), Legal Services & Support (64.3%), and Health Technologists (64.2%), while the most female-oriented occupations are Life, Physical & Social Science (100.0%), Education, Arts & Media (100.0%), and Arts, Media & Entertainment (71.4%).
| Occupation | Male | Female |
| Management | 115 (42.6%) | 155 (57.4%) |
| Business & Financial | 59 (59.6%) | 40 (40.4%) |
| Computers, Engineering & Science | 69 (57.0%) | 52 (43.0%) |
| Computers & Mathematics | 49 (57.7%) | 36 (42.3%) |
| Architecture & Engineering | 20 (100.0%) | 0 (0.0%) |
| Life, Physical & Social Science | 0 (0.0%) | 16 (100.0%) |
| Community & Social Service | 142 (38.0%) | 232 (62.0%) |
| Education, Arts & Media | 0 (0.0%) | 50 (100.0%) |
| Legal Services & Support | 9 (64.3%) | 5 (35.7%) |
| Education Instruction & Library | 91 (55.8%) | 72 (44.2%) |
| Arts, Media & Entertainment | 42 (28.6%) | 105 (71.4%) |
| Health Diagnosing & Treating | 93 (44.9%) | 114 (55.1%) |
| Health Technologists | 70 (64.2%) | 39 (35.8%) |
| Total (Category) | 478 (44.6%) | 593 (55.4%) |
| Total (Overall) | 1,891 (53.8%) | 1,626 (46.2%) |
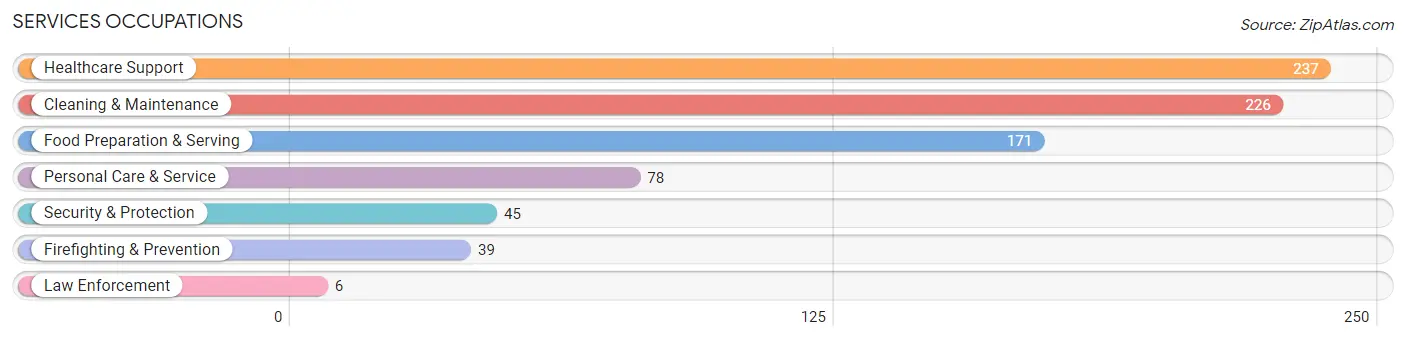
Services Occupations
The most common Services occupations in Interlaken are Healthcare Support (237 | 6.7%), Cleaning & Maintenance (226 | 6.4%), Food Preparation & Serving (171 | 4.9%), Personal Care & Service (78 | 2.2%), and Security & Protection (45 | 1.3%).
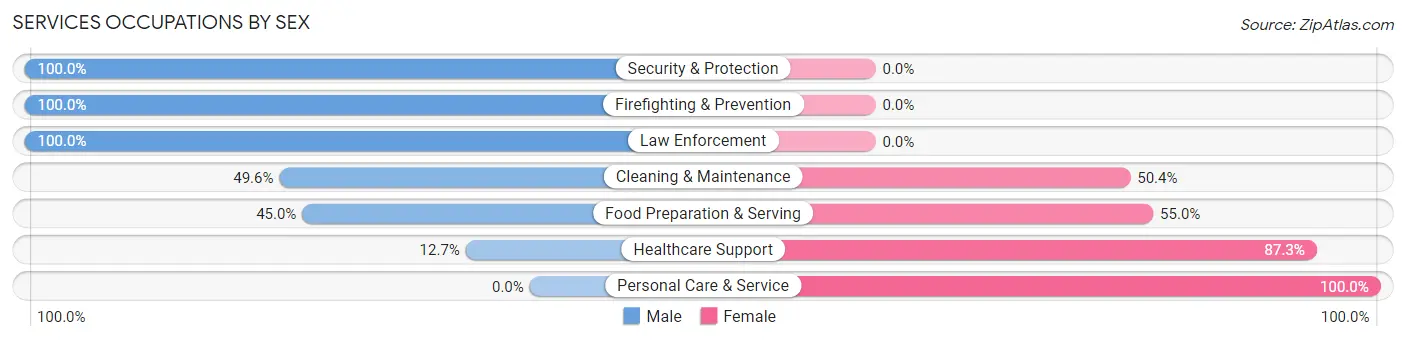
Services Occupations by Sex
Within the Services occupations in Interlaken, the most male-oriented occupations are Security & Protection (100.0%), Firefighting & Prevention (100.0%), and Law Enforcement (100.0%), while the most female-oriented occupations are Personal Care & Service (100.0%), Healthcare Support (87.3%), and Food Preparation & Serving (55.0%).
| Occupation | Male | Female |
| Healthcare Support | 30 (12.7%) | 207 (87.3%) |
| Security & Protection | 45 (100.0%) | 0 (0.0%) |
| Firefighting & Prevention | 39 (100.0%) | 0 (0.0%) |
| Law Enforcement | 6 (100.0%) | 0 (0.0%) |
| Food Preparation & Serving | 77 (45.0%) | 94 (55.0%) |
| Cleaning & Maintenance | 112 (49.6%) | 114 (50.4%) |
| Personal Care & Service | 0 (0.0%) | 78 (100.0%) |
| Total (Category) | 264 (34.9%) | 493 (65.1%) |
| Total (Overall) | 1,891 (53.8%) | 1,626 (46.2%) |
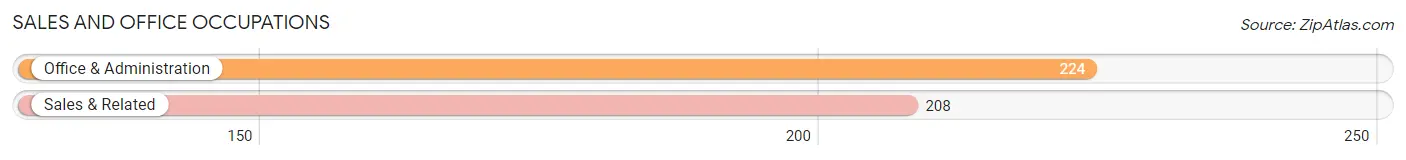
Sales and Office Occupations
The most common Sales and Office occupations in Interlaken are Office & Administration (224 | 6.4%), and Sales & Related (208 | 5.9%).
Sales and Office Occupations by Sex
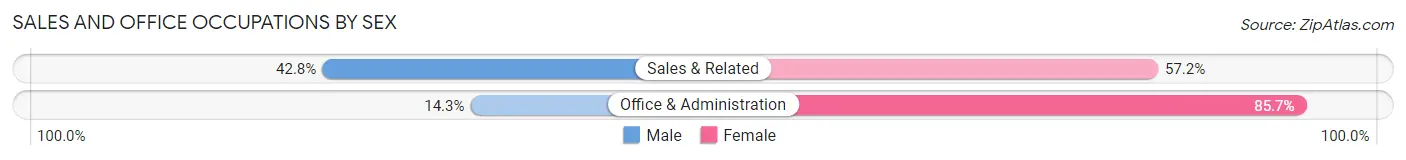
| Occupation | Male | Female |
| Sales & Related | 89 (42.8%) | 119 (57.2%) |
| Office & Administration | 32 (14.3%) | 192 (85.7%) |
| Total (Category) | 121 (28.0%) | 311 (72.0%) |
| Total (Overall) | 1,891 (53.8%) | 1,626 (46.2%) |
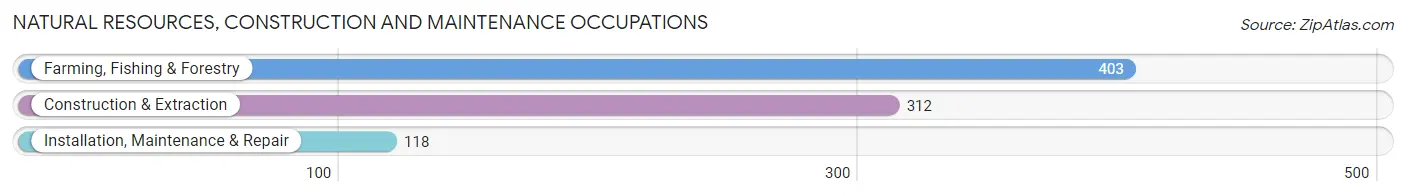
Natural Resources, Construction and Maintenance Occupations
The most common Natural Resources, Construction and Maintenance occupations in Interlaken are Farming, Fishing & Forestry (403 | 11.5%), Construction & Extraction (312 | 8.9%), and Installation, Maintenance & Repair (118 | 3.4%).
Natural Resources, Construction and Maintenance Occupations by Sex
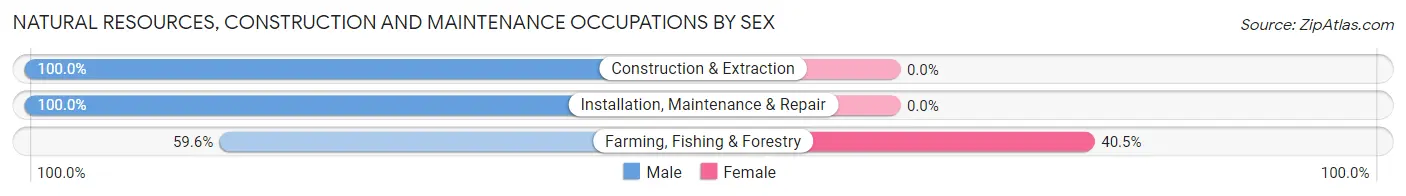
| Occupation | Male | Female |
| Farming, Fishing & Forestry | 240 (59.6%) | 163 (40.5%) |
| Construction & Extraction | 312 (100.0%) | 0 (0.0%) |
| Installation, Maintenance & Repair | 118 (100.0%) | 0 (0.0%) |
| Total (Category) | 670 (80.4%) | 163 (19.6%) |
| Total (Overall) | 1,891 (53.8%) | 1,626 (46.2%) |
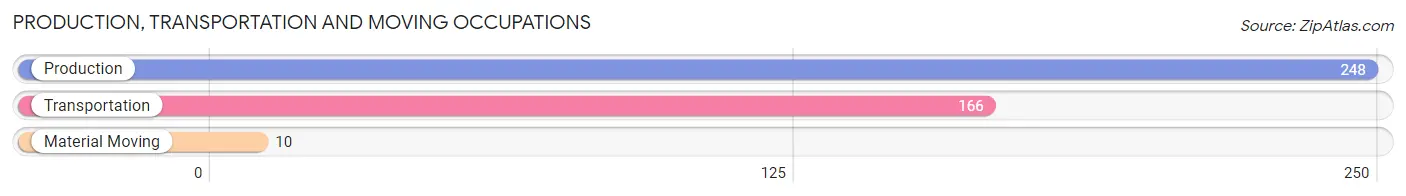
Production, Transportation and Moving Occupations
The most common Production, Transportation and Moving occupations in Interlaken are Production (248 | 7.0%), Transportation (166 | 4.7%), and Material Moving (10 | 0.3%).
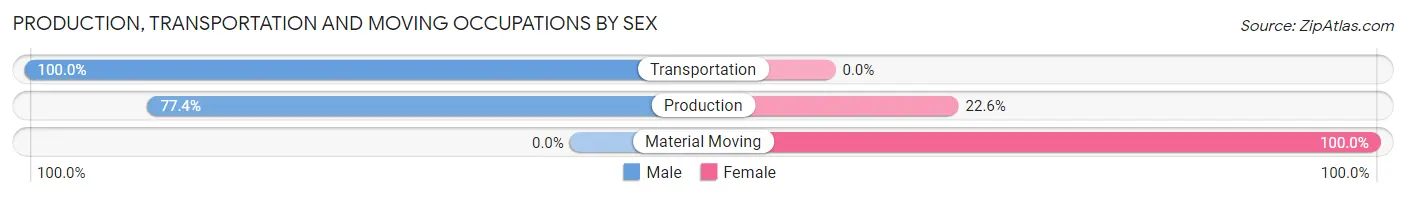
Production, Transportation and Moving Occupations by Sex
| Occupation | Male | Female |
| Production | 192 (77.4%) | 56 (22.6%) |
| Transportation | 166 (100.0%) | 0 (0.0%) |
| Material Moving | 0 (0.0%) | 10 (100.0%) |
| Total (Category) | 358 (84.4%) | 66 (15.6%) |
| Total (Overall) | 1,891 (53.8%) | 1,626 (46.2%) |
Employment Industries by Sex in Interlaken
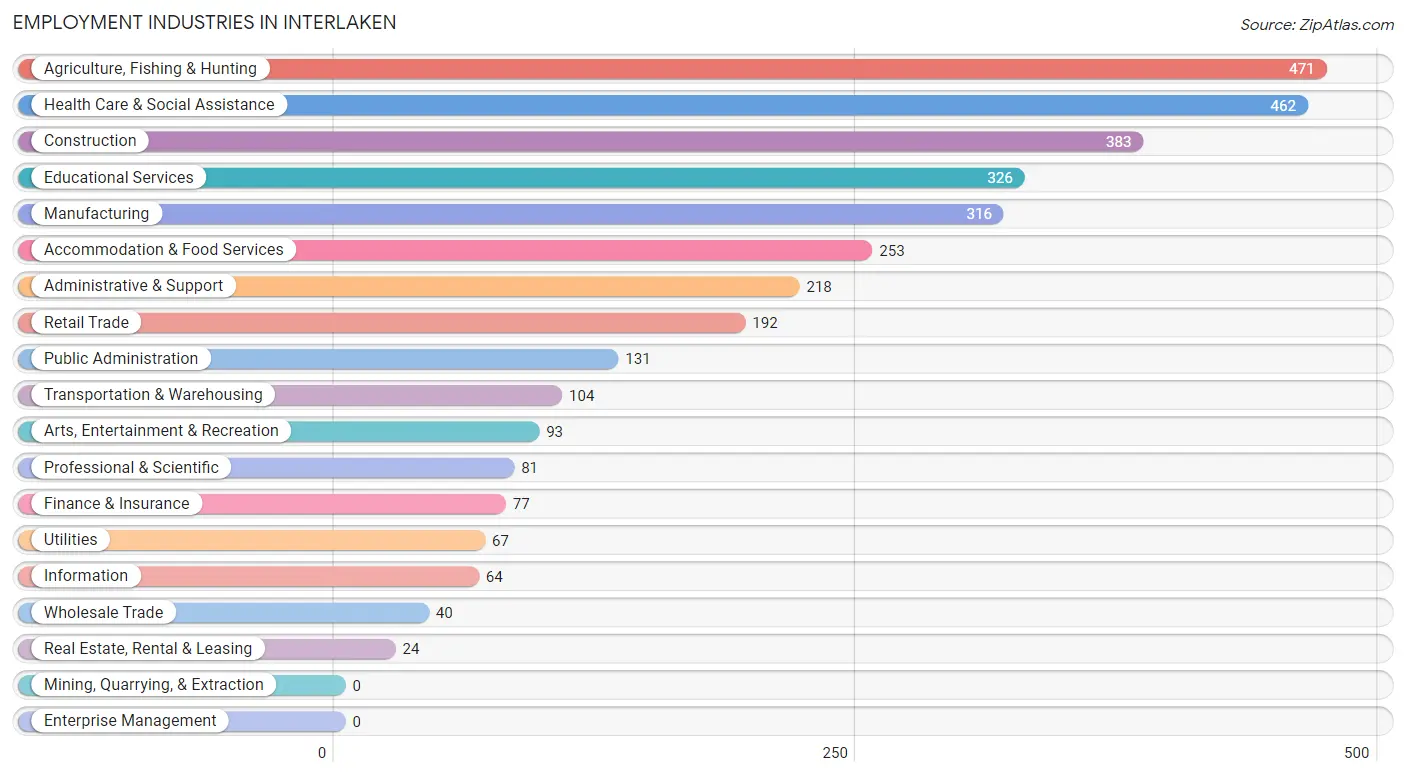
Employment Industries in Interlaken
The major employment industries in Interlaken include Agriculture, Fishing & Hunting (471 | 13.4%), Health Care & Social Assistance (462 | 13.1%), Construction (383 | 10.9%), Educational Services (326 | 9.3%), and Manufacturing (316 | 9.0%).
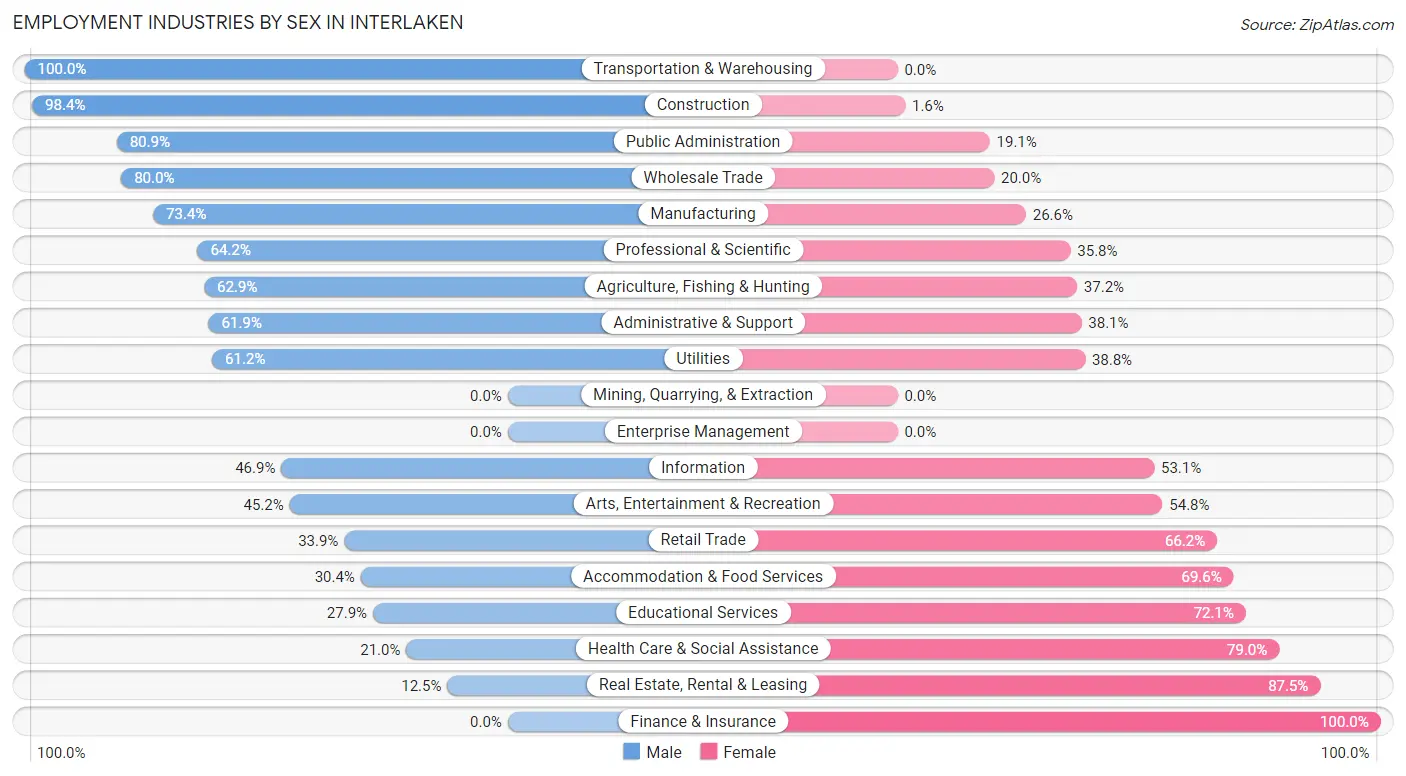
Employment Industries by Sex in Interlaken
The Interlaken industries that see more men than women are Transportation & Warehousing (100.0%), Construction (98.4%), and Public Administration (80.9%), whereas the industries that tend to have a higher number of women are Finance & Insurance (100.0%), Real Estate, Rental & Leasing (87.5%), and Health Care & Social Assistance (79.0%).
| Industry | Male | Female |
| Agriculture, Fishing & Hunting | 296 (62.8%) | 175 (37.1%) |
| Mining, Quarrying, & Extraction | 0 (0.0%) | 0 (0.0%) |
| Construction | 377 (98.4%) | 6 (1.6%) |
| Manufacturing | 232 (73.4%) | 84 (26.6%) |
| Wholesale Trade | 32 (80.0%) | 8 (20.0%) |
| Retail Trade | 65 (33.9%) | 127 (66.1%) |
| Transportation & Warehousing | 104 (100.0%) | 0 (0.0%) |
| Utilities | 41 (61.2%) | 26 (38.8%) |
| Information | 30 (46.9%) | 34 (53.1%) |
| Finance & Insurance | 0 (0.0%) | 77 (100.0%) |
| Real Estate, Rental & Leasing | 3 (12.5%) | 21 (87.5%) |
| Professional & Scientific | 52 (64.2%) | 29 (35.8%) |
| Enterprise Management | 0 (0.0%) | 0 (0.0%) |
| Administrative & Support | 135 (61.9%) | 83 (38.1%) |
| Educational Services | 91 (27.9%) | 235 (72.1%) |
| Health Care & Social Assistance | 97 (21.0%) | 365 (79.0%) |
| Arts, Entertainment & Recreation | 42 (45.2%) | 51 (54.8%) |
| Accommodation & Food Services | 77 (30.4%) | 176 (69.6%) |
| Public Administration | 106 (80.9%) | 25 (19.1%) |
| Total | 1,891 (53.8%) | 1,626 (46.2%) |
Education in Interlaken
School Enrollment in Interlaken
The most common levels of schooling among the 2,451 students in Interlaken are elementary school (622 | 25.4%), middle school (576 | 23.5%), and college / undergraduate (506 | 20.6%).
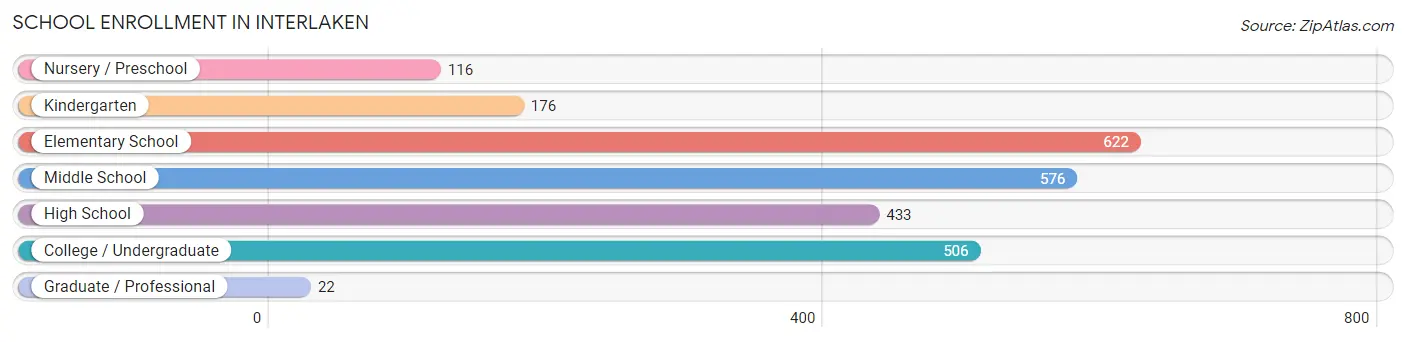
| School Level | # Students | % Students |
| Nursery / Preschool | 116 | 4.7% |
| Kindergarten | 176 | 7.2% |
| Elementary School | 622 | 25.4% |
| Middle School | 576 | 23.5% |
| High School | 433 | 17.7% |
| College / Undergraduate | 506 | 20.6% |
| Graduate / Professional | 22 | 0.9% |
| Total | 2,451 | 100.0% |
School Enrollment by Age by Funding Source in Interlaken
Out of a total of 2,451 students who are enrolled in schools in Interlaken, 319 (13.0%) attend a private institution, while the remaining 2,132 (87.0%) are enrolled in public schools. The age group of 3 to 4 year olds has the highest likelihood of being enrolled in private schools, with 88 (96.7% in the age bracket) enrolled. Conversely, the age group of 15 to 17 year olds has the lowest likelihood of being enrolled in a private school, with 347 (100.0% in the age bracket) attending a public institution.
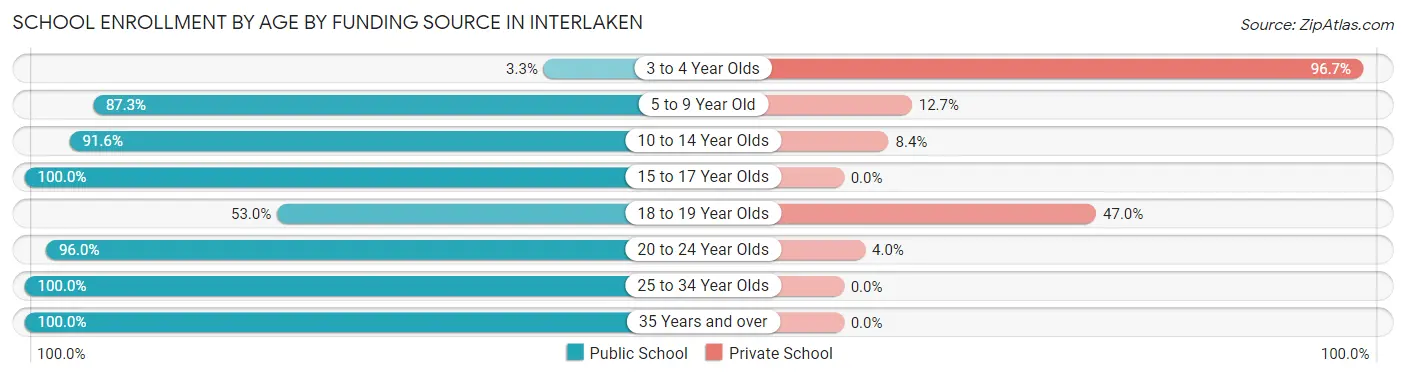
| Age Bracket | Public School | Private School |
| 3 to 4 Year Olds | 3 (3.3%) | 88 (96.7%) |
| 5 to 9 Year Old | 633 (87.3%) | 92 (12.7%) |
| 10 to 14 Year Olds | 624 (91.6%) | 57 (8.4%) |
| 15 to 17 Year Olds | 347 (100.0%) | 0 (0.0%) |
| 18 to 19 Year Olds | 80 (53.0%) | 71 (47.0%) |
| 20 to 24 Year Olds | 265 (96.0%) | 11 (4.0%) |
| 25 to 34 Year Olds | 88 (100.0%) | 0 (0.0%) |
| 35 Years and over | 92 (100.0%) | 0 (0.0%) |
| Total | 2,132 (87.0%) | 319 (13.0%) |
Educational Attainment by Field of Study in Interlaken
Literature & languages (172 | 15.2%), business (161 | 14.3%), social sciences (153 | 13.6%), bio, nature & agricultural (100 | 8.9%), and visual & performing arts (82 | 7.3%) are the most common fields of study among 1,128 individuals in Interlaken who have obtained a bachelor's degree or higher.
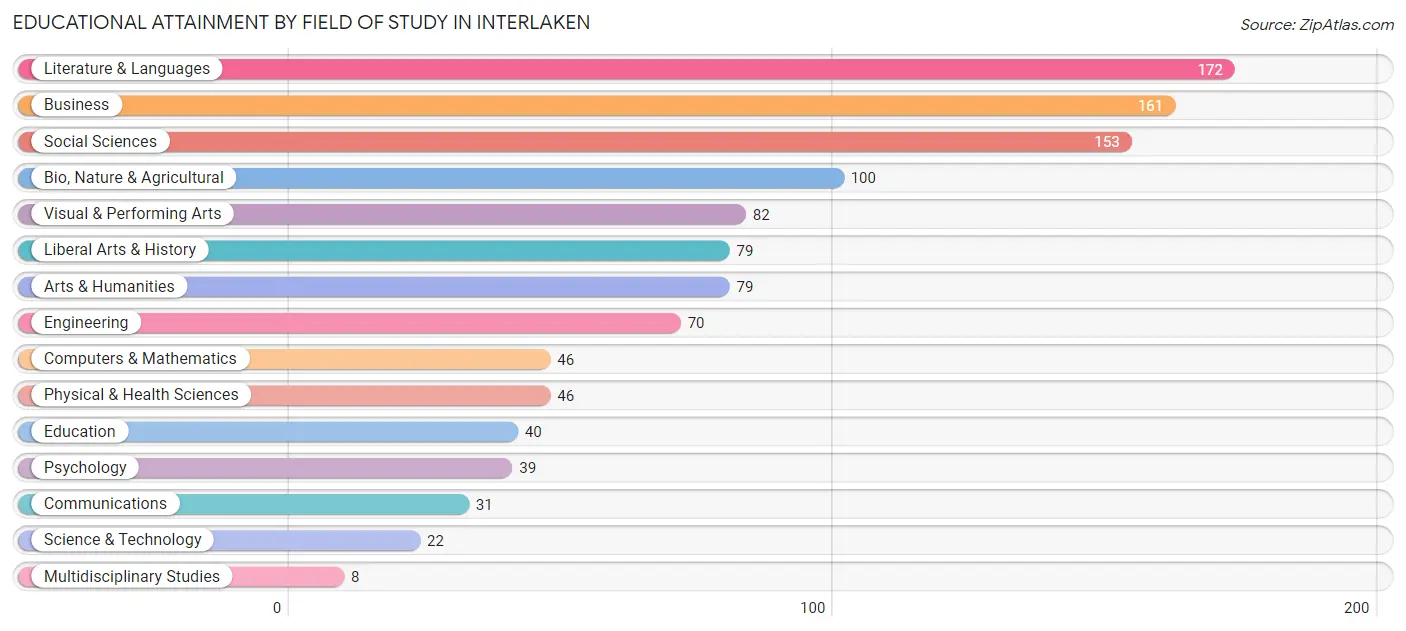
| Field of Study | # Graduates | % Graduates |
| Computers & Mathematics | 46 | 4.1% |
| Bio, Nature & Agricultural | 100 | 8.9% |
| Physical & Health Sciences | 46 | 4.1% |
| Psychology | 39 | 3.5% |
| Social Sciences | 153 | 13.6% |
| Engineering | 70 | 6.2% |
| Multidisciplinary Studies | 8 | 0.7% |
| Science & Technology | 22 | 1.9% |
| Business | 161 | 14.3% |
| Education | 40 | 3.5% |
| Literature & Languages | 172 | 15.2% |
| Liberal Arts & History | 79 | 7.0% |
| Visual & Performing Arts | 82 | 7.3% |
| Communications | 31 | 2.8% |
| Arts & Humanities | 79 | 7.0% |
| Total | 1,128 | 100.0% |
Transportation & Commute in Interlaken
Vehicle Availability by Sex in Interlaken
The most prevalent vehicle ownership categories in Interlaken are males with 4 vehicles (556, accounting for 29.9%) and females with 4 vehicles (367, making up 37.7%).
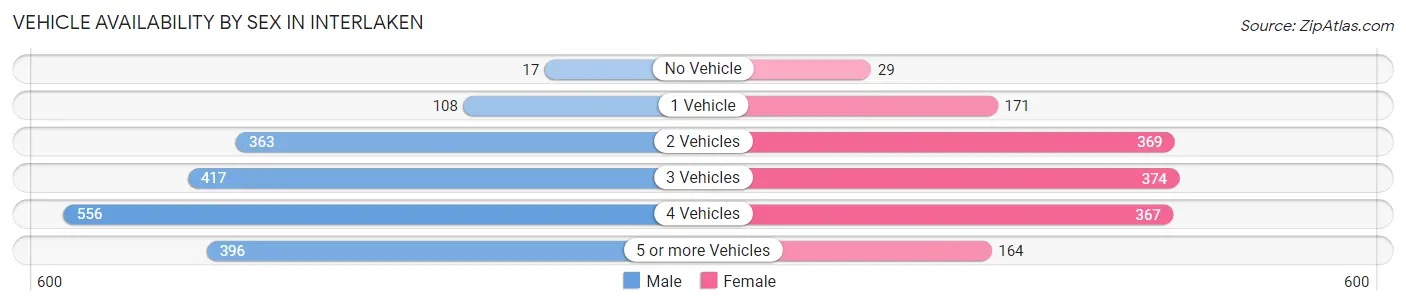
| Vehicles Available | Male | Female |
| No Vehicle | 17 (0.9%) | 29 (2.0%) |
| 1 Vehicle | 108 (5.8%) | 171 (11.6%) |
| 2 Vehicles | 363 (19.6%) | 369 (25.0%) |
| 3 Vehicles | 417 (22.5%) | 374 (25.4%) |
| 4 Vehicles | 556 (29.9%) | 367 (24.9%) |
| 5 or more Vehicles | 396 (21.3%) | 164 (11.1%) |
| Total | 1,857 (100.0%) | 1,474 (100.0%) |
Commute Time in Interlaken
The most frequently occuring commute durations in Interlaken are 15 to 19 minutes (594 commuters, 20.2%), 10 to 14 minutes (459 commuters, 15.6%), and 20 to 24 minutes (403 commuters, 13.7%).
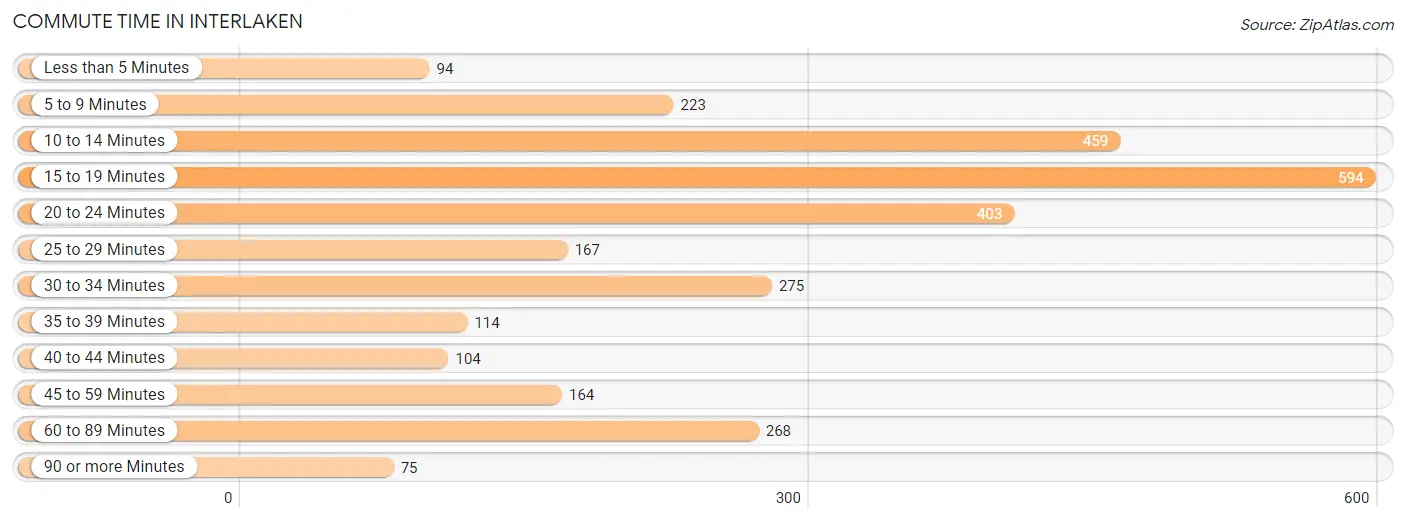
| Commute Time | # Commuters | % Commuters |
| Less than 5 Minutes | 94 | 3.2% |
| 5 to 9 Minutes | 223 | 7.6% |
| 10 to 14 Minutes | 459 | 15.6% |
| 15 to 19 Minutes | 594 | 20.2% |
| 20 to 24 Minutes | 403 | 13.7% |
| 25 to 29 Minutes | 167 | 5.7% |
| 30 to 34 Minutes | 275 | 9.3% |
| 35 to 39 Minutes | 114 | 3.9% |
| 40 to 44 Minutes | 104 | 3.5% |
| 45 to 59 Minutes | 164 | 5.6% |
| 60 to 89 Minutes | 268 | 9.1% |
| 90 or more Minutes | 75 | 2.5% |
Commute Time by Sex in Interlaken
The most common commute times in Interlaken are 15 to 19 minutes (246 commuters, 15.6%) for males and 15 to 19 minutes (348 commuters, 25.5%) for females.
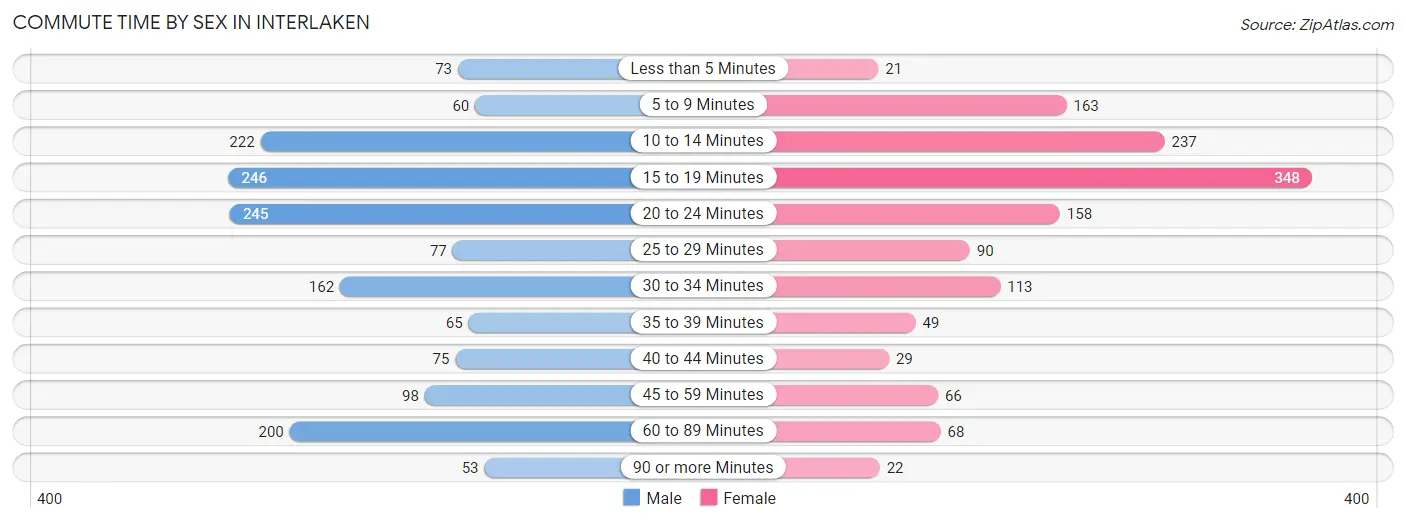
| Commute Time | Male | Female |
| Less than 5 Minutes | 73 (4.6%) | 21 (1.5%) |
| 5 to 9 Minutes | 60 (3.8%) | 163 (11.9%) |
| 10 to 14 Minutes | 222 (14.1%) | 237 (17.4%) |
| 15 to 19 Minutes | 246 (15.6%) | 348 (25.5%) |
| 20 to 24 Minutes | 245 (15.5%) | 158 (11.6%) |
| 25 to 29 Minutes | 77 (4.9%) | 90 (6.6%) |
| 30 to 34 Minutes | 162 (10.3%) | 113 (8.3%) |
| 35 to 39 Minutes | 65 (4.1%) | 49 (3.6%) |
| 40 to 44 Minutes | 75 (4.8%) | 29 (2.1%) |
| 45 to 59 Minutes | 98 (6.2%) | 66 (4.8%) |
| 60 to 89 Minutes | 200 (12.7%) | 68 (5.0%) |
| 90 or more Minutes | 53 (3.4%) | 22 (1.6%) |
Time of Departure to Work by Sex in Interlaken
The most frequent times of departure to work in Interlaken are 7:00 AM to 7:29 AM (322, 20.4%) for males and 7:30 AM to 7:59 AM (212, 15.5%) for females.
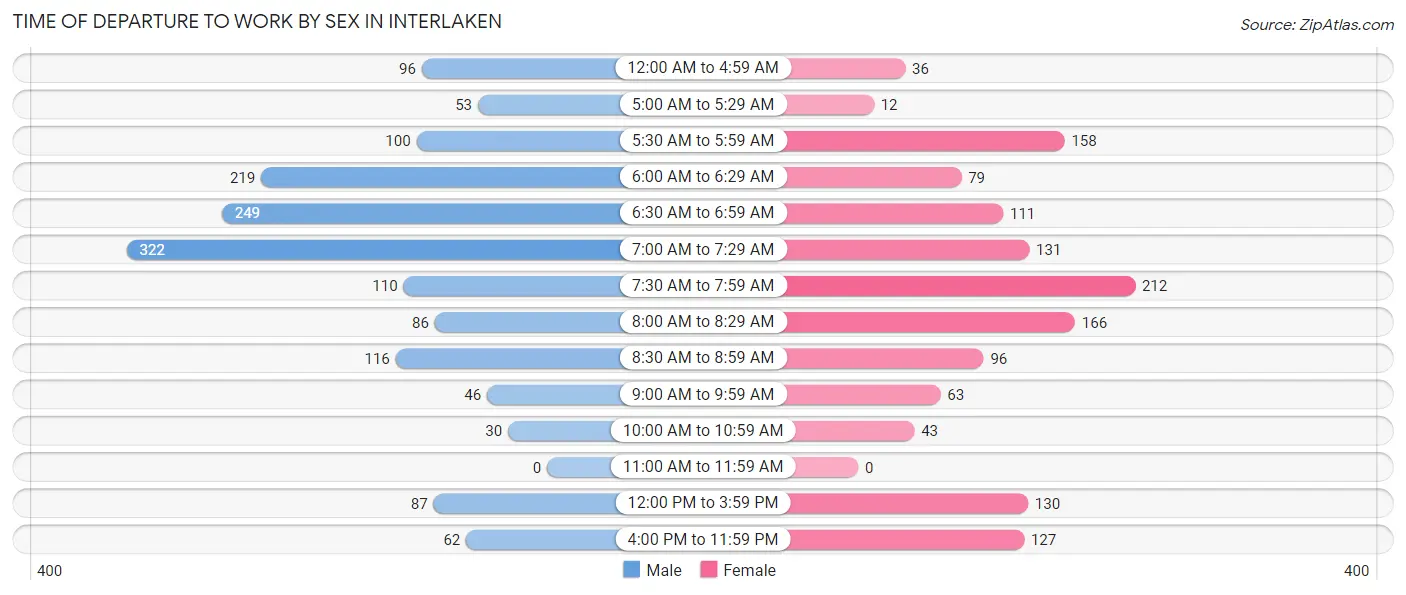
| Time of Departure | Male | Female |
| 12:00 AM to 4:59 AM | 96 (6.1%) | 36 (2.6%) |
| 5:00 AM to 5:29 AM | 53 (3.4%) | 12 (0.9%) |
| 5:30 AM to 5:59 AM | 100 (6.4%) | 158 (11.6%) |
| 6:00 AM to 6:29 AM | 219 (13.9%) | 79 (5.8%) |
| 6:30 AM to 6:59 AM | 249 (15.8%) | 111 (8.1%) |
| 7:00 AM to 7:29 AM | 322 (20.4%) | 131 (9.6%) |
| 7:30 AM to 7:59 AM | 110 (7.0%) | 212 (15.5%) |
| 8:00 AM to 8:29 AM | 86 (5.5%) | 166 (12.2%) |
| 8:30 AM to 8:59 AM | 116 (7.4%) | 96 (7.0%) |
| 9:00 AM to 9:59 AM | 46 (2.9%) | 63 (4.6%) |
| 10:00 AM to 10:59 AM | 30 (1.9%) | 43 (3.2%) |
| 11:00 AM to 11:59 AM | 0 (0.0%) | 0 (0.0%) |
| 12:00 PM to 3:59 PM | 87 (5.5%) | 130 (9.5%) |
| 4:00 PM to 11:59 PM | 62 (3.9%) | 127 (9.3%) |
| Total | 1,576 (100.0%) | 1,364 (100.0%) |
Housing Occupancy in Interlaken
Occupancy by Ownership in Interlaken
Of the total 1,945 dwellings in Interlaken, owner-occupied units account for 1,402 (72.1%), while renter-occupied units make up 543 (27.9%).
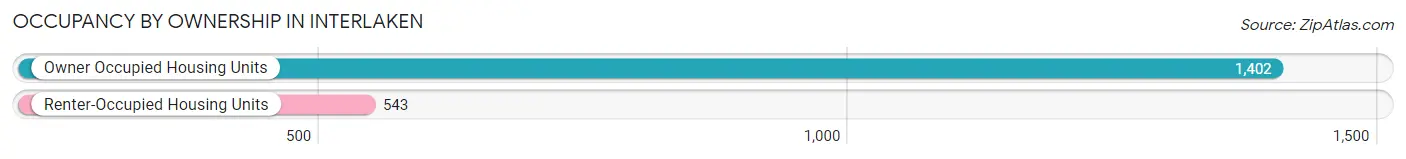
| Occupancy | # Housing Units | % Housing Units |
| Owner Occupied Housing Units | 1,402 | 72.1% |
| Renter-Occupied Housing Units | 543 | 27.9% |
| Total Occupied Housing Units | 1,945 | 100.0% |
Occupancy by Household Size in Interlaken
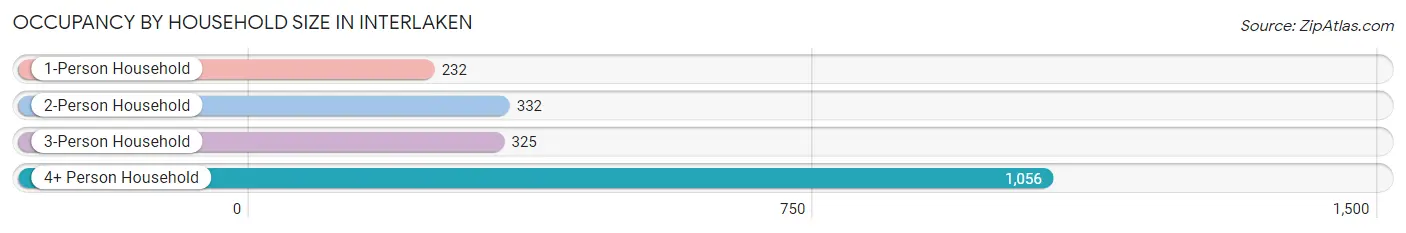
| Household Size | # Housing Units | % Housing Units |
| 1-Person Household | 232 | 11.9% |
| 2-Person Household | 332 | 17.1% |
| 3-Person Household | 325 | 16.7% |
| 4+ Person Household | 1,056 | 54.3% |
| Total Housing Units | 1,945 | 100.0% |
Occupancy by Ownership by Household Size in Interlaken
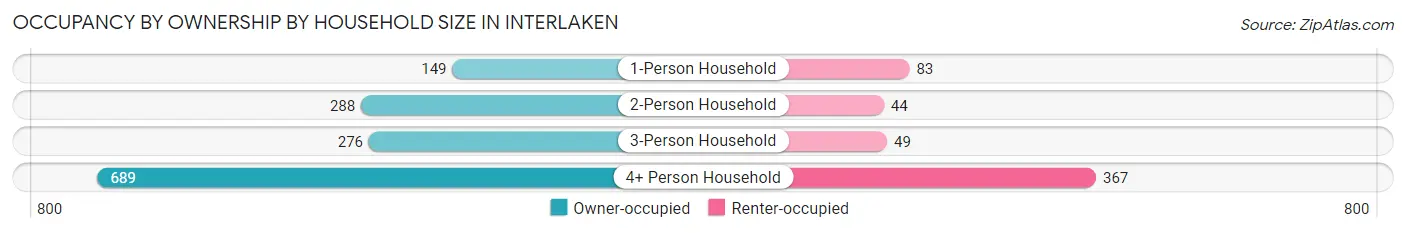
| Household Size | Owner-occupied | Renter-occupied |
| 1-Person Household | 149 (64.2%) | 83 (35.8%) |
| 2-Person Household | 288 (86.8%) | 44 (13.3%) |
| 3-Person Household | 276 (84.9%) | 49 (15.1%) |
| 4+ Person Household | 689 (65.2%) | 367 (34.7%) |
| Total Housing Units | 1,402 (72.1%) | 543 (27.9%) |
Occupancy by Educational Attainment in Interlaken
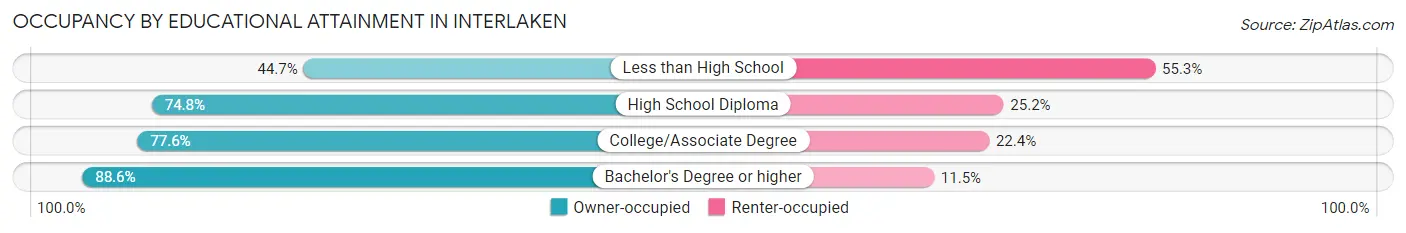
| Household Size | Owner-occupied | Renter-occupied |
| Less than High School | 198 (44.7%) | 245 (55.3%) |
| High School Diploma | 329 (74.8%) | 111 (25.2%) |
| College/Associate Degree | 465 (77.6%) | 134 (22.4%) |
| Bachelor's Degree or higher | 410 (88.5%) | 53 (11.5%) |
Occupancy by Age of Householder in Interlaken
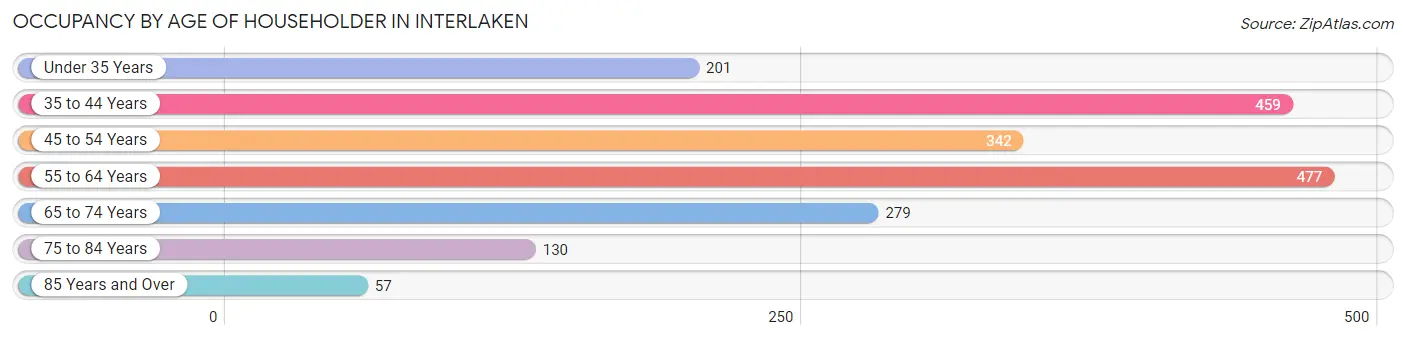
| Age Bracket | # Households | % Households |
| Under 35 Years | 201 | 10.3% |
| 35 to 44 Years | 459 | 23.6% |
| 45 to 54 Years | 342 | 17.6% |
| 55 to 64 Years | 477 | 24.5% |
| 65 to 74 Years | 279 | 14.3% |
| 75 to 84 Years | 130 | 6.7% |
| 85 Years and Over | 57 | 2.9% |
| Total | 1,945 | 100.0% |
Housing Finances in Interlaken
Median Income by Occupancy in Interlaken
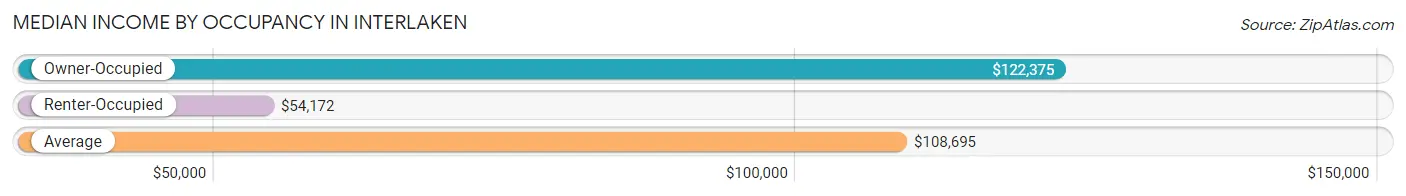
| Occupancy Type | # Households | Median Income |
| Owner-Occupied | 1,402 (72.1%) | $122,375 |
| Renter-Occupied | 543 (27.9%) | $54,172 |
| Average | 1,945 (100.0%) | $108,695 |
Occupancy by Householder Income Bracket in Interlaken
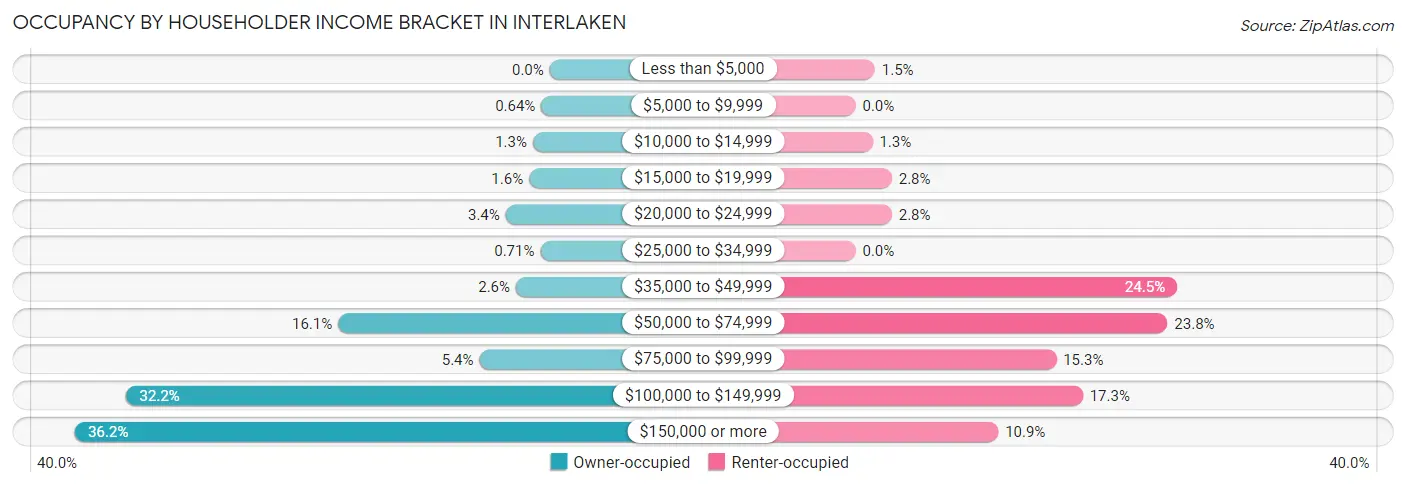
| Income Bracket | Owner-occupied | Renter-occupied |
| Less than $5,000 | 0 (0.0%) | 8 (1.5%) |
| $5,000 to $9,999 | 9 (0.6%) | 0 (0.0%) |
| $10,000 to $14,999 | 18 (1.3%) | 7 (1.3%) |
| $15,000 to $19,999 | 22 (1.6%) | 15 (2.8%) |
| $20,000 to $24,999 | 47 (3.4%) | 15 (2.8%) |
| $25,000 to $34,999 | 10 (0.7%) | 0 (0.0%) |
| $35,000 to $49,999 | 36 (2.6%) | 133 (24.5%) |
| $50,000 to $74,999 | 226 (16.1%) | 129 (23.8%) |
| $75,000 to $99,999 | 75 (5.3%) | 83 (15.3%) |
| $100,000 to $149,999 | 452 (32.2%) | 94 (17.3%) |
| $150,000 or more | 507 (36.2%) | 59 (10.9%) |
| Total | 1,402 (100.0%) | 543 (100.0%) |
Monthly Housing Cost Tiers in Interlaken
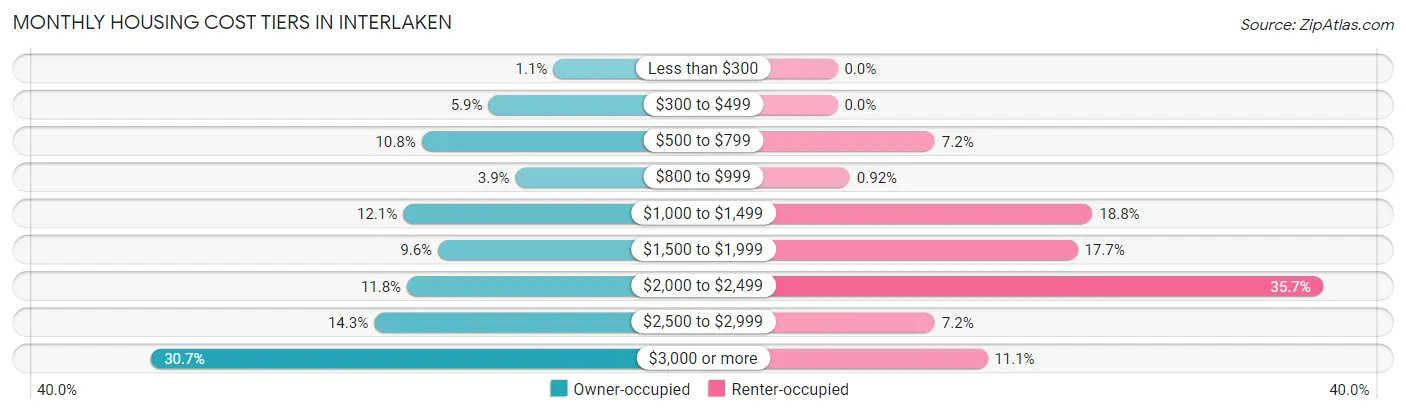
| Monthly Cost | Owner-occupied | Renter-occupied |
| Less than $300 | 15 (1.1%) | 0 (0.0%) |
| $300 to $499 | 82 (5.9%) | 0 (0.0%) |
| $500 to $799 | 151 (10.8%) | 39 (7.2%) |
| $800 to $999 | 54 (3.8%) | 5 (0.9%) |
| $1,000 to $1,499 | 170 (12.1%) | 102 (18.8%) |
| $1,500 to $1,999 | 134 (9.6%) | 96 (17.7%) |
| $2,000 to $2,499 | 166 (11.8%) | 194 (35.7%) |
| $2,500 to $2,999 | 200 (14.3%) | 39 (7.2%) |
| $3,000 or more | 430 (30.7%) | 60 (11.1%) |
| Total | 1,402 (100.0%) | 543 (100.0%) |
Physical Housing Characteristics in Interlaken
Housing Structures in Interlaken
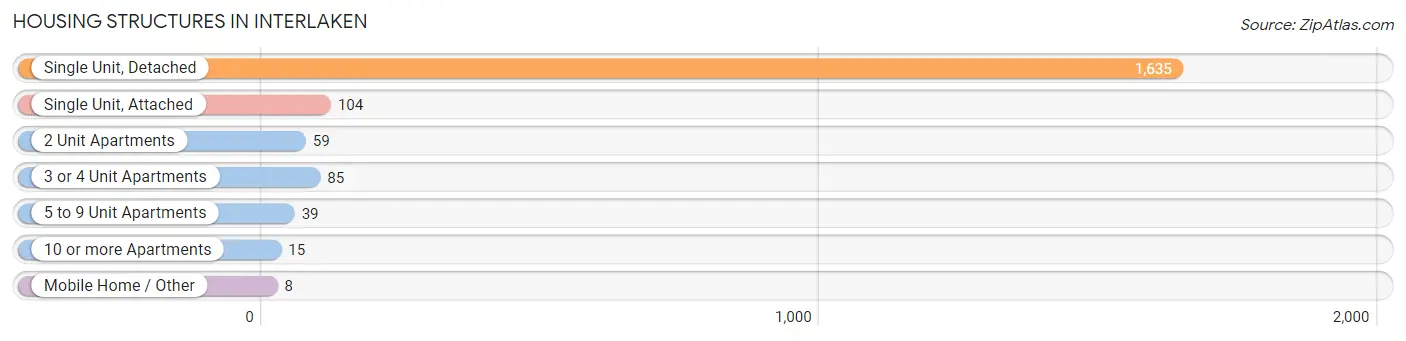
| Structure Type | # Housing Units | % Housing Units |
| Single Unit, Detached | 1,635 | 84.1% |
| Single Unit, Attached | 104 | 5.3% |
| 2 Unit Apartments | 59 | 3.0% |
| 3 or 4 Unit Apartments | 85 | 4.4% |
| 5 to 9 Unit Apartments | 39 | 2.0% |
| 10 or more Apartments | 15 | 0.8% |
| Mobile Home / Other | 8 | 0.4% |
| Total | 1,945 | 100.0% |
Housing Structures by Occupancy in Interlaken
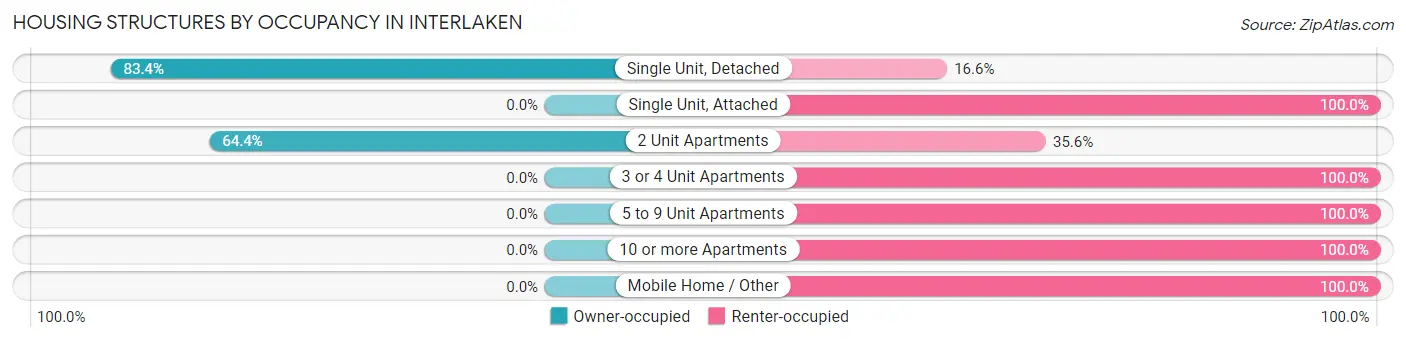
| Structure Type | Owner-occupied | Renter-occupied |
| Single Unit, Detached | 1,364 (83.4%) | 271 (16.6%) |
| Single Unit, Attached | 0 (0.0%) | 104 (100.0%) |
| 2 Unit Apartments | 38 (64.4%) | 21 (35.6%) |
| 3 or 4 Unit Apartments | 0 (0.0%) | 85 (100.0%) |
| 5 to 9 Unit Apartments | 0 (0.0%) | 39 (100.0%) |
| 10 or more Apartments | 0 (0.0%) | 15 (100.0%) |
| Mobile Home / Other | 0 (0.0%) | 8 (100.0%) |
| Total | 1,402 (72.1%) | 543 (27.9%) |
Housing Structures by Number of Rooms in Interlaken
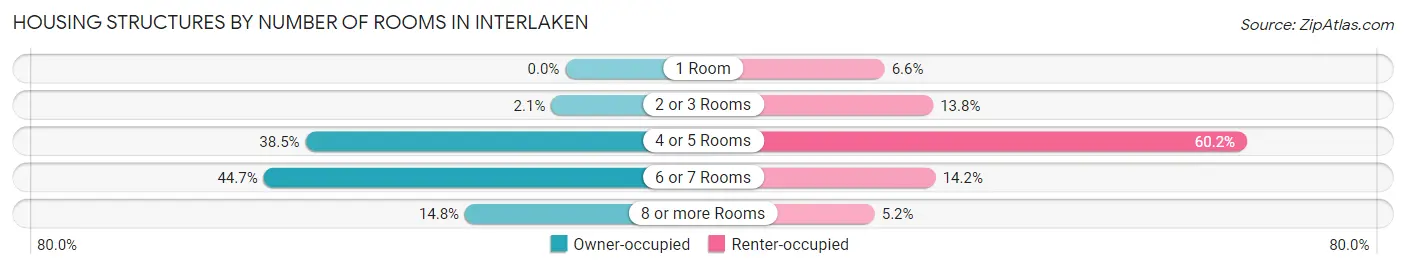
| Number of Rooms | Owner-occupied | Renter-occupied |
| 1 Room | 0 (0.0%) | 36 (6.6%) |
| 2 or 3 Rooms | 29 (2.1%) | 75 (13.8%) |
| 4 or 5 Rooms | 539 (38.5%) | 327 (60.2%) |
| 6 or 7 Rooms | 626 (44.7%) | 77 (14.2%) |
| 8 or more Rooms | 208 (14.8%) | 28 (5.2%) |
| Total | 1,402 (100.0%) | 543 (100.0%) |
Housing Structure by Heating Type in Interlaken
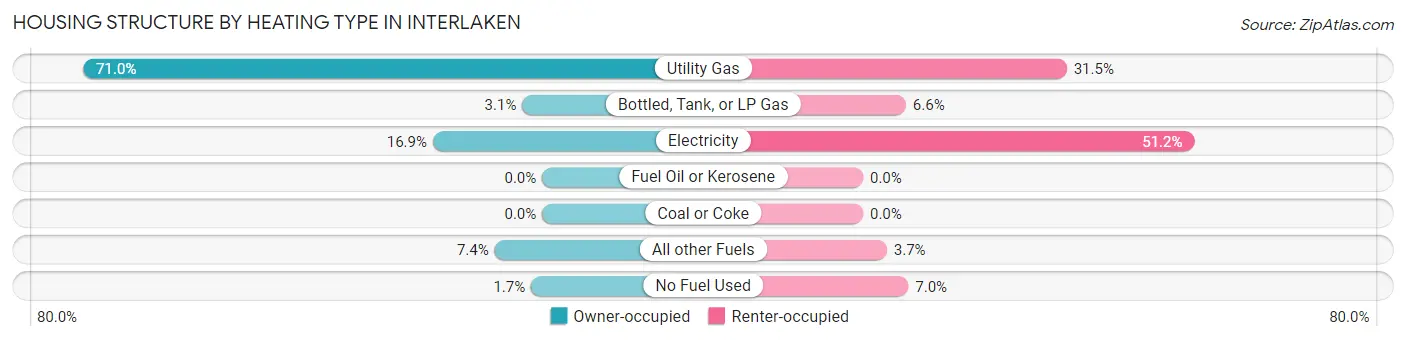
| Heating Type | Owner-occupied | Renter-occupied |
| Utility Gas | 995 (71.0%) | 171 (31.5%) |
| Bottled, Tank, or LP Gas | 43 (3.1%) | 36 (6.6%) |
| Electricity | 237 (16.9%) | 278 (51.2%) |
| Fuel Oil or Kerosene | 0 (0.0%) | 0 (0.0%) |
| Coal or Coke | 0 (0.0%) | 0 (0.0%) |
| All other Fuels | 103 (7.3%) | 20 (3.7%) |
| No Fuel Used | 24 (1.7%) | 38 (7.0%) |
| Total | 1,402 (100.0%) | 543 (100.0%) |
Household Vehicle Usage in Interlaken
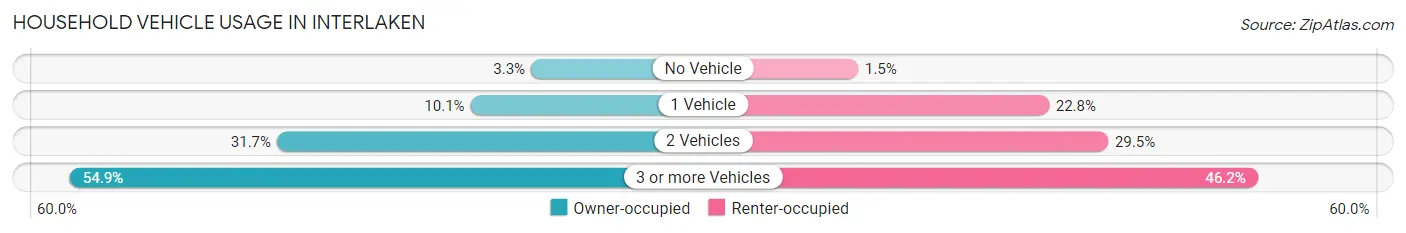
| Vehicles per Household | Owner-occupied | Renter-occupied |
| No Vehicle | 46 (3.3%) | 8 (1.5%) |
| 1 Vehicle | 141 (10.1%) | 124 (22.8%) |
| 2 Vehicles | 445 (31.7%) | 160 (29.5%) |
| 3 or more Vehicles | 770 (54.9%) | 251 (46.2%) |
| Total | 1,402 (100.0%) | 543 (100.0%) |
Real Estate & Mortgages in Interlaken
Real Estate and Mortgage Overview in Interlaken
| Characteristic | Without Mortgage | With Mortgage |
| Housing Units | 298 | 1,104 |
| Median Property Value | $623,200 | $665,900 |
| Median Household Income | $108,250 | $426 |
| Monthly Housing Costs | $614 | $430 |
| Real Estate Taxes | $3,268 | $26 |
Property Value by Mortgage Status in Interlaken
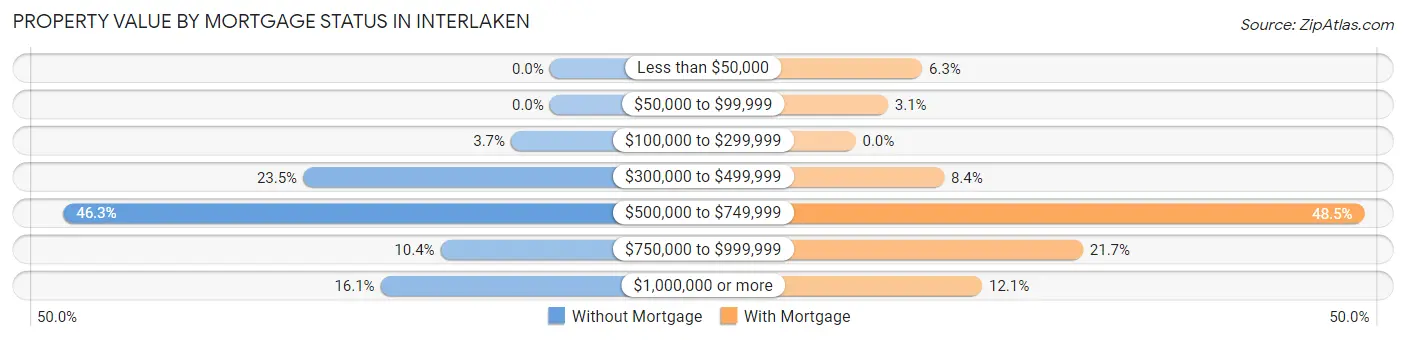
| Property Value | Without Mortgage | With Mortgage |
| Less than $50,000 | 0 (0.0%) | 70 (6.3%) |
| $50,000 to $99,999 | 0 (0.0%) | 34 (3.1%) |
| $100,000 to $299,999 | 11 (3.7%) | 0 (0.0%) |
| $300,000 to $499,999 | 70 (23.5%) | 93 (8.4%) |
| $500,000 to $749,999 | 138 (46.3%) | 535 (48.5%) |
| $750,000 to $999,999 | 31 (10.4%) | 239 (21.6%) |
| $1,000,000 or more | 48 (16.1%) | 133 (12.0%) |
| Total | 298 (100.0%) | 1,104 (100.0%) |
Household Income by Mortgage Status in Interlaken
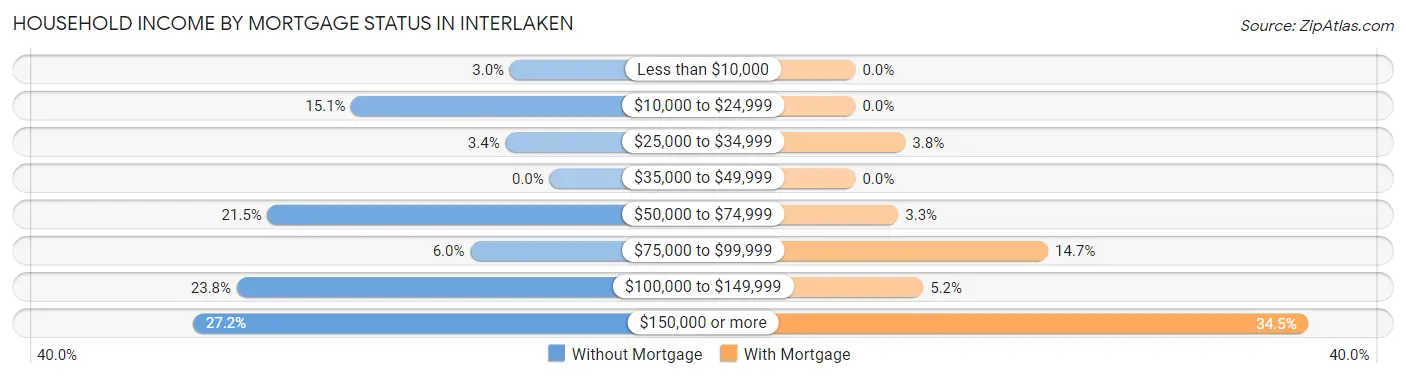
| Household Income | Without Mortgage | With Mortgage |
| Less than $10,000 | 9 (3.0%) | 0 (0.0%) |
| $10,000 to $24,999 | 45 (15.1%) | 0 (0.0%) |
| $25,000 to $34,999 | 10 (3.4%) | 42 (3.8%) |
| $35,000 to $49,999 | 0 (0.0%) | 0 (0.0%) |
| $50,000 to $74,999 | 64 (21.5%) | 36 (3.3%) |
| $75,000 to $99,999 | 18 (6.0%) | 162 (14.7%) |
| $100,000 to $149,999 | 71 (23.8%) | 57 (5.2%) |
| $150,000 or more | 81 (27.2%) | 381 (34.5%) |
| Total | 298 (100.0%) | 1,104 (100.0%) |
Property Value to Household Income Ratio in Interlaken
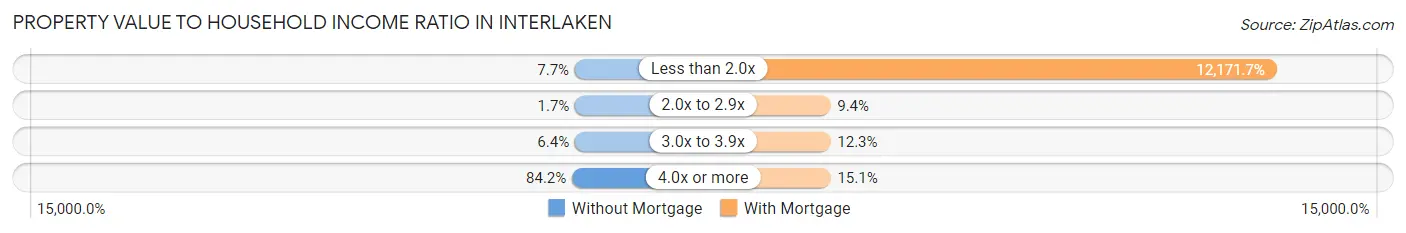
| Value-to-Income Ratio | Without Mortgage | With Mortgage |
| Less than 2.0x | 23 (7.7%) | 134,375 (12,171.6%) |
| 2.0x to 2.9x | 5 (1.7%) | 104 (9.4%) |
| 3.0x to 3.9x | 19 (6.4%) | 136 (12.3%) |
| 4.0x or more | 251 (84.2%) | 167 (15.1%) |
| Total | 298 (100.0%) | 1,104 (100.0%) |
Real Estate Taxes by Mortgage Status in Interlaken
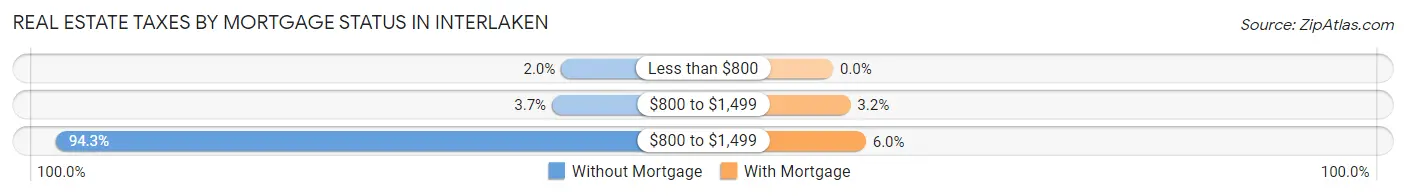
| Property Taxes | Without Mortgage | With Mortgage |
| Less than $800 | 6 (2.0%) | 0 (0.0%) |
| $800 to $1,499 | 11 (3.7%) | 35 (3.2%) |
| $800 to $1,499 | 281 (94.3%) | 66 (6.0%) |
| Total | 298 (100.0%) | 1,104 (100.0%) |
Health & Disability in Interlaken
Health Insurance Coverage by Age in Interlaken
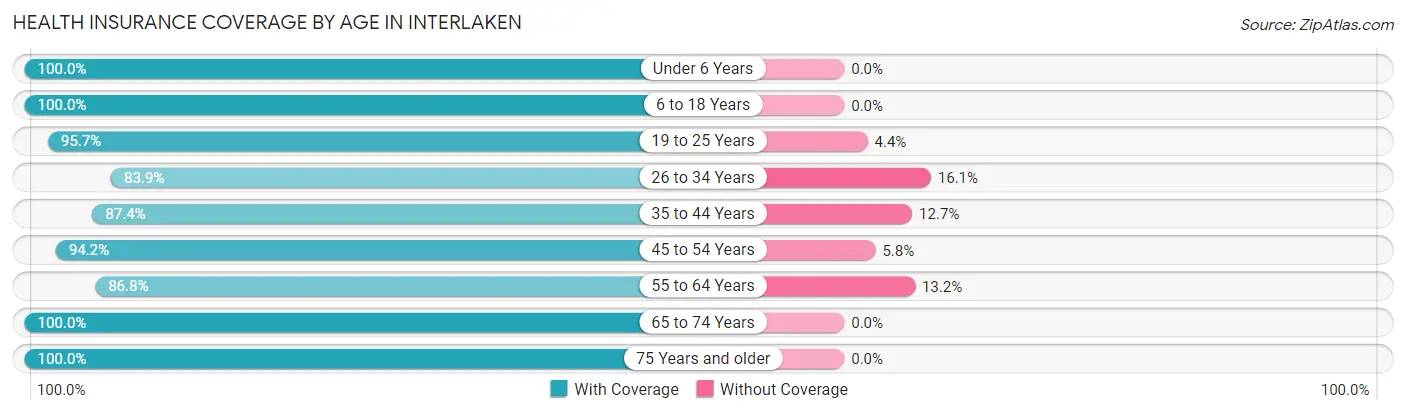
| Age Bracket | With Coverage | Without Coverage |
| Under 6 Years | 761 (100.0%) | 0 (0.0%) |
| 6 to 18 Years | 1,773 (100.0%) | 0 (0.0%) |
| 19 to 25 Years | 792 (95.7%) | 36 (4.3%) |
| 26 to 34 Years | 738 (83.9%) | 142 (16.1%) |
| 35 to 44 Years | 918 (87.4%) | 133 (12.7%) |
| 45 to 54 Years | 745 (94.2%) | 46 (5.8%) |
| 55 to 64 Years | 810 (86.8%) | 123 (13.2%) |
| 65 to 74 Years | 586 (100.0%) | 0 (0.0%) |
| 75 Years and older | 436 (100.0%) | 0 (0.0%) |
| Total | 7,559 (94.0%) | 480 (6.0%) |
Health Insurance Coverage by Citizenship Status in Interlaken
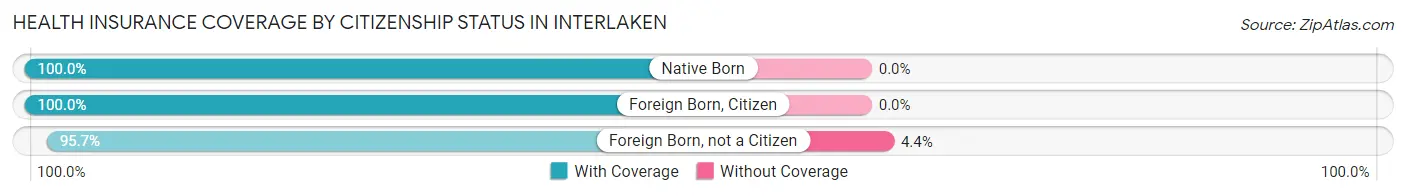
| Citizenship Status | With Coverage | Without Coverage |
| Native Born | 761 (100.0%) | 0 (0.0%) |
| Foreign Born, Citizen | 1,773 (100.0%) | 0 (0.0%) |
| Foreign Born, not a Citizen | 792 (95.7%) | 36 (4.3%) |
Health Insurance Coverage by Household Income in Interlaken
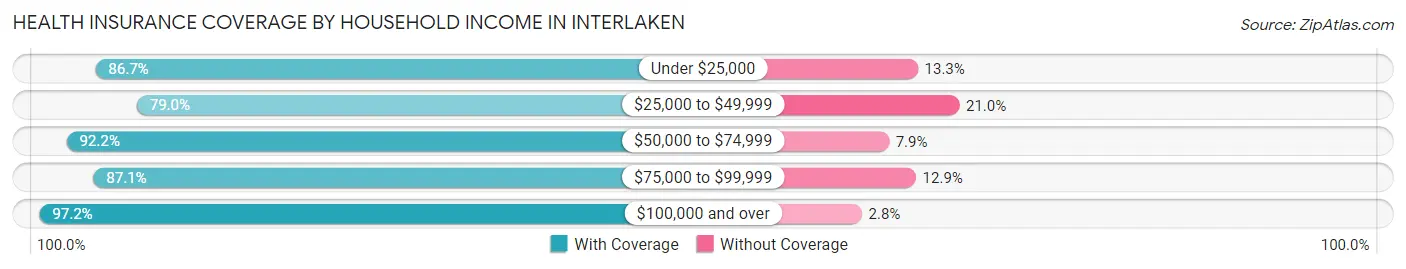
| Household Income | With Coverage | Without Coverage |
| Under $25,000 | 255 (86.7%) | 39 (13.3%) |
| $25,000 to $49,999 | 462 (79.0%) | 123 (21.0%) |
| $50,000 to $74,999 | 1,209 (92.1%) | 103 (7.9%) |
| $75,000 to $99,999 | 466 (87.1%) | 69 (12.9%) |
| $100,000 and over | 4,937 (97.2%) | 141 (2.8%) |
Public vs Private Health Insurance Coverage by Age in Interlaken
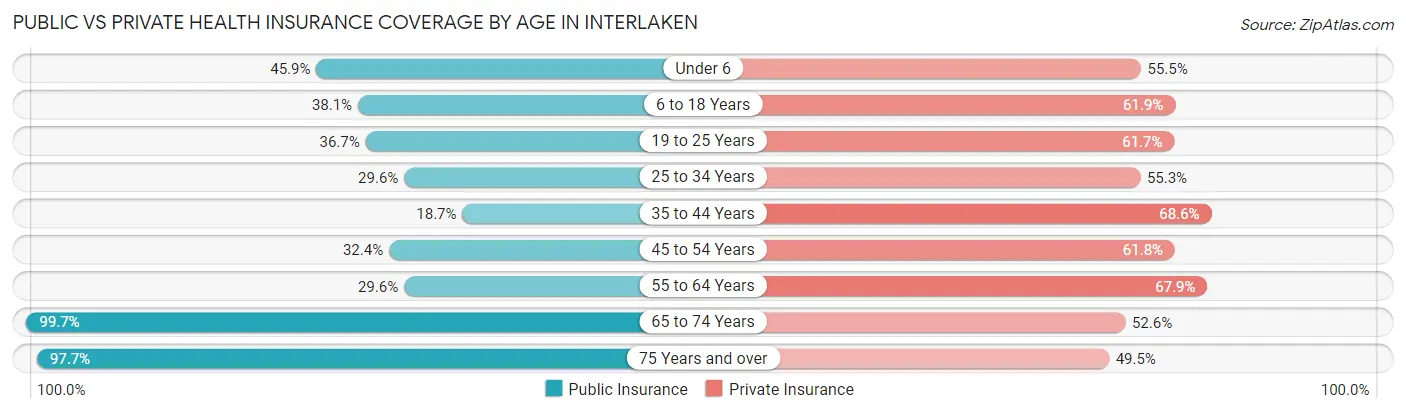
| Age Bracket | Public Insurance | Private Insurance |
| Under 6 | 349 (45.9%) | 422 (55.4%) |
| 6 to 18 Years | 676 (38.1%) | 1,097 (61.9%) |
| 19 to 25 Years | 304 (36.7%) | 511 (61.7%) |
| 25 to 34 Years | 260 (29.5%) | 487 (55.3%) |
| 35 to 44 Years | 197 (18.7%) | 721 (68.6%) |
| 45 to 54 Years | 256 (32.4%) | 489 (61.8%) |
| 55 to 64 Years | 276 (29.6%) | 633 (67.8%) |
| 65 to 74 Years | 584 (99.7%) | 308 (52.6%) |
| 75 Years and over | 426 (97.7%) | 216 (49.5%) |
| Total | 3,328 (41.4%) | 4,884 (60.8%) |
Disability Status by Sex by Age in Interlaken
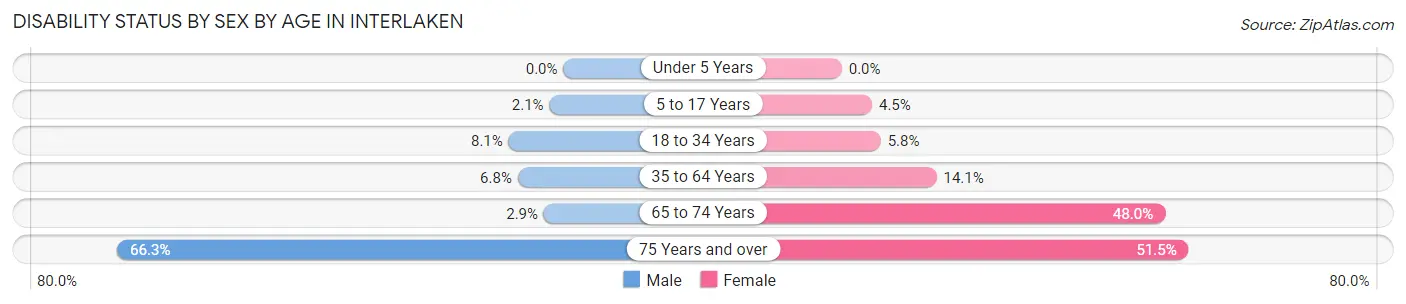
| Age Bracket | Male | Female |
| Under 5 Years | 0 (0.0%) | 0 (0.0%) |
| 5 to 17 Years | 22 (2.1%) | 35 (4.5%) |
| 18 to 34 Years | 84 (8.1%) | 40 (5.8%) |
| 35 to 64 Years | 94 (6.8%) | 195 (14.1%) |
| 65 to 74 Years | 9 (2.9%) | 132 (48.0%) |
| 75 Years and over | 110 (66.3%) | 139 (51.5%) |
Disability Class by Sex by Age in Interlaken
Disability Class: Hearing Difficulty
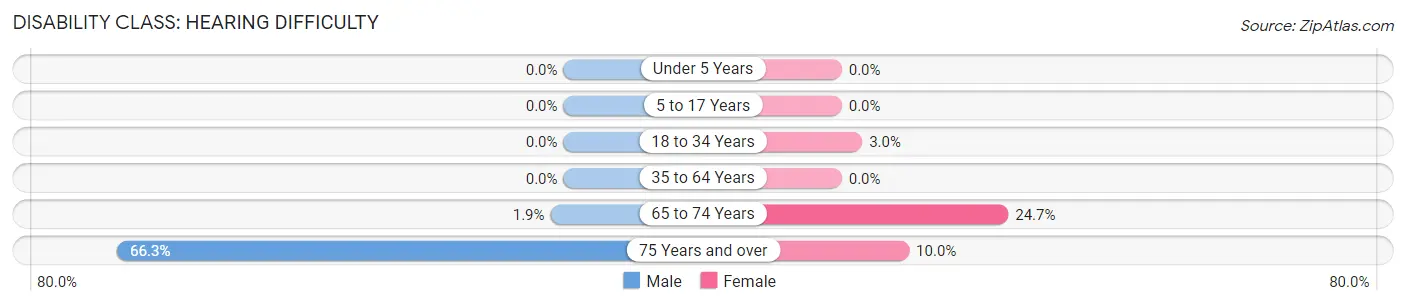
| Age Bracket | Male | Female |
| Under 5 Years | 0 (0.0%) | 0 (0.0%) |
| 5 to 17 Years | 0 (0.0%) | 0 (0.0%) |
| 18 to 34 Years | 0 (0.0%) | 21 (3.0%) |
| 35 to 64 Years | 0 (0.0%) | 0 (0.0%) |
| 65 to 74 Years | 6 (1.9%) | 68 (24.7%) |
| 75 Years and over | 110 (66.3%) | 27 (10.0%) |
Disability Class: Vision Difficulty
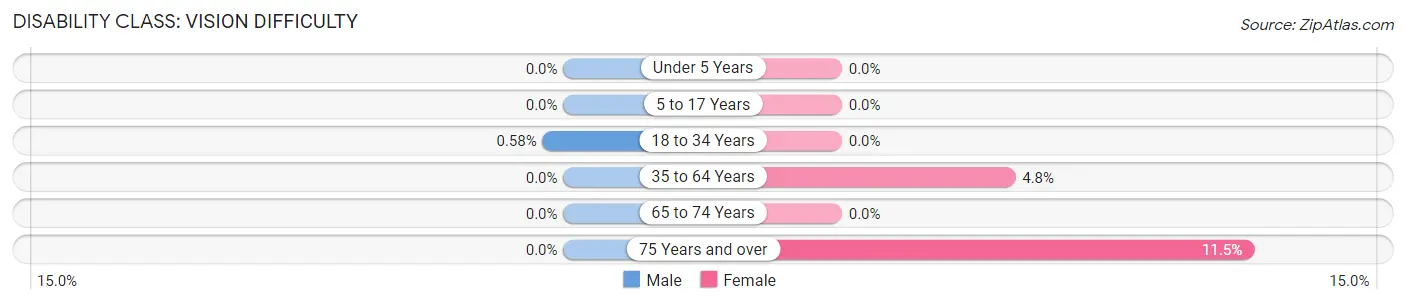
| Age Bracket | Male | Female |
| Under 5 Years | 0 (0.0%) | 0 (0.0%) |
| 5 to 17 Years | 0 (0.0%) | 0 (0.0%) |
| 18 to 34 Years | 6 (0.6%) | 0 (0.0%) |
| 35 to 64 Years | 0 (0.0%) | 67 (4.8%) |
| 65 to 74 Years | 0 (0.0%) | 0 (0.0%) |
| 75 Years and over | 0 (0.0%) | 31 (11.5%) |
Disability Class: Cognitive Difficulty
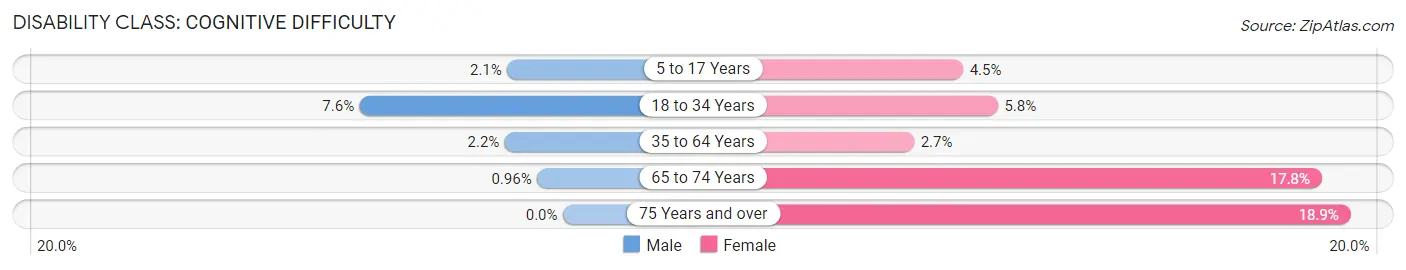
| Age Bracket | Male | Female |
| 5 to 17 Years | 22 (2.1%) | 35 (4.5%) |
| 18 to 34 Years | 78 (7.5%) | 40 (5.8%) |
| 35 to 64 Years | 30 (2.2%) | 37 (2.7%) |
| 65 to 74 Years | 3 (1.0%) | 49 (17.8%) |
| 75 Years and over | 0 (0.0%) | 51 (18.9%) |
Disability Class: Ambulatory Difficulty
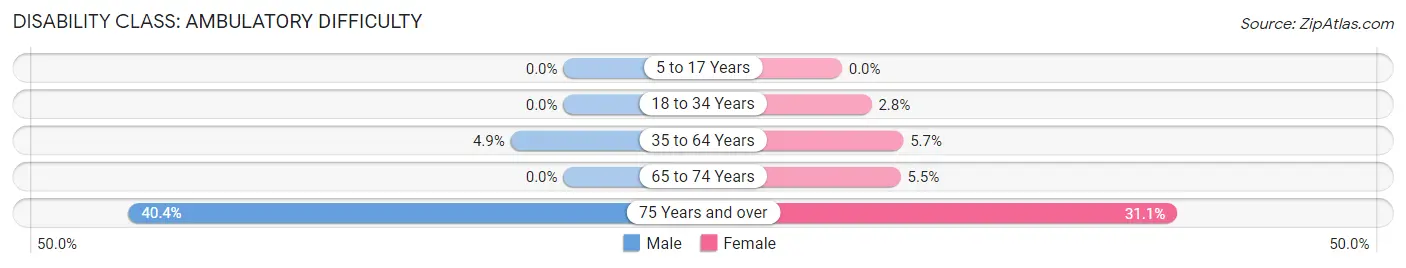
| Age Bracket | Male | Female |
| 5 to 17 Years | 0 (0.0%) | 0 (0.0%) |
| 18 to 34 Years | 0 (0.0%) | 19 (2.8%) |
| 35 to 64 Years | 68 (4.9%) | 79 (5.7%) |
| 65 to 74 Years | 0 (0.0%) | 15 (5.4%) |
| 75 Years and over | 67 (40.4%) | 84 (31.1%) |
Disability Class: Self-Care Difficulty
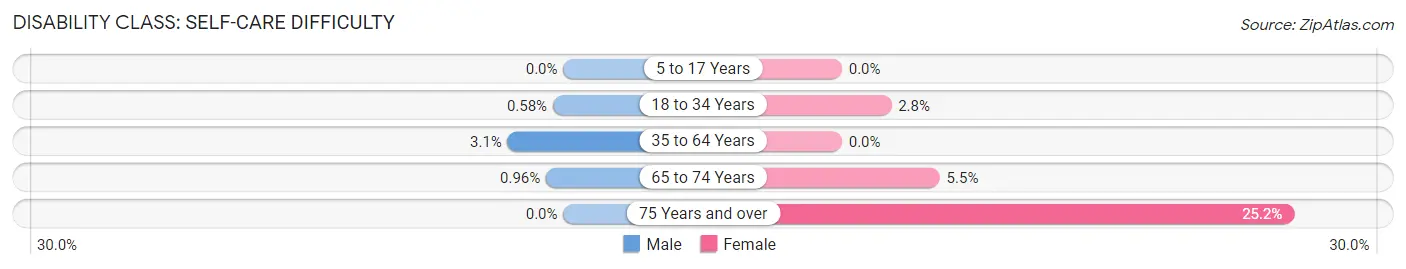
| Age Bracket | Male | Female |
| 5 to 17 Years | 0 (0.0%) | 0 (0.0%) |
| 18 to 34 Years | 6 (0.6%) | 19 (2.8%) |
| 35 to 64 Years | 43 (3.1%) | 0 (0.0%) |
| 65 to 74 Years | 3 (1.0%) | 15 (5.4%) |
| 75 Years and over | 0 (0.0%) | 68 (25.2%) |
Technology Access in Interlaken
Computing Device Access in Interlaken
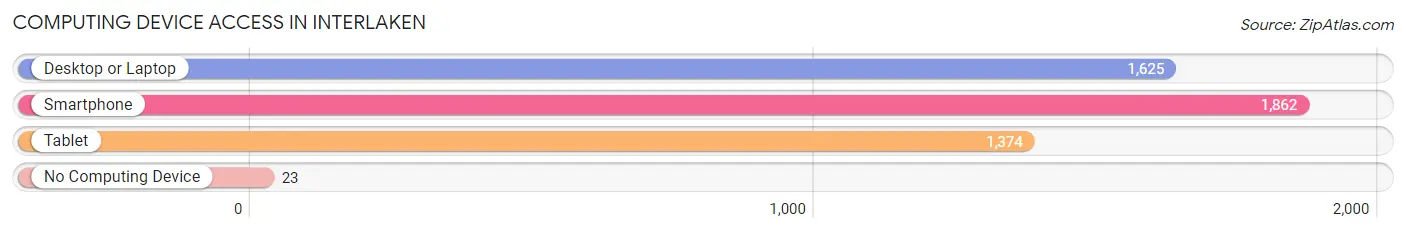
| Device Type | # Households | % Households |
| Desktop or Laptop | 1,625 | 83.6% |
| Smartphone | 1,862 | 95.7% |
| Tablet | 1,374 | 70.6% |
| No Computing Device | 23 | 1.2% |
| Total | 1,945 | 100.0% |
Internet Access in Interlaken
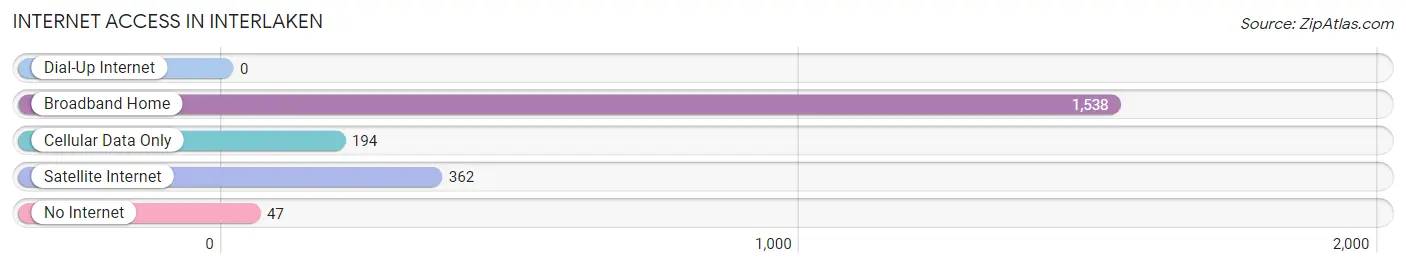
| Internet Type | # Households | % Households |
| Dial-Up Internet | 0 | 0.0% |
| Broadband Home | 1,538 | 79.1% |
| Cellular Data Only | 194 | 10.0% |
| Satellite Internet | 362 | 18.6% |
| No Internet | 47 | 2.4% |
| Total | 1,945 | 100.0% |
Interlaken Summary
Interlaken is a small unincorporated community located in Santa Cruz County, California. It is situated on the northern edge of the Monterey Bay, about 10 miles south of Santa Cruz and about 30 miles south of San Jose. The population of Interlaken was estimated to be around 1,000 in 2020.
History
Interlaken was originally inhabited by the Ohlone people, who lived in the area for thousands of years before the arrival of Europeans. The first Europeans to settle in the area were Spanish missionaries, who established the Mission Santa Cruz in 1791. The mission was abandoned in 1834, and the land was divided into large ranchos. In 1848, the area was ceded to the United States as part of the Treaty of Guadalupe Hidalgo.
In the late 19th century, Interlaken was a popular resort destination for wealthy San Franciscans. The area was known for its natural beauty, and many of the original Victorian-style homes still stand today. In the early 20th century, Interlaken was a popular destination for Hollywood stars, including Charlie Chaplin and Rudolph Valentino.
Geography
Interlaken is located in the northern part of Santa Cruz County, on the northern edge of the Monterey Bay. The town is situated on a small peninsula, surrounded by the Pacific Ocean to the west and the San Lorenzo River to the east. The town is bordered by the cities of Santa Cruz to the north and Capitola to the south.
The climate in Interlaken is mild and temperate, with warm summers and mild winters. The average high temperature in the summer is around 70 degrees Fahrenheit, and the average low temperature in the winter is around 50 degrees Fahrenheit.
Economy
Interlaken is a small, rural community with a limited economy. The primary industries in the area are tourism and agriculture. The town is home to several small businesses, including restaurants, cafes, and shops. The town is also home to a number of wineries and vineyards, which produce a variety of wines.
Demographics
As of the 2020 census, the population of Interlaken was estimated to be around 1,000. The racial makeup of the town was 79.3% White, 8.2% Hispanic or Latino, 5.2% Asian, 4.2% African American, and 3.1% other. The median household income in Interlaken was $63,750, and the median home value was $717,500.
Interlaken is a small, rural community with a unique history and culture. The town is known for its natural beauty and its close proximity to the Monterey Bay. The town is home to a diverse population, and it is a popular destination for tourists and locals alike.
Common Questions
What is Per Capita Income in Interlaken?
Per Capita income in Interlaken is $33,500.
What is the Median Family Income in Interlaken?
Median Family Income in Interlaken is $109,876.
What is the Median Household income in Interlaken?
Median Household Income in Interlaken is $108,695.
What is Income or Wage Gap in Interlaken?
Income or Wage Gap in Interlaken is 25.3%.
Women in Interlaken earn 74.7 cents for every dollar earned by a man.
What is Inequality or Gini Index in Interlaken?
Inequality or Gini Index in Interlaken is 0.43.
What is the Total Population of Interlaken?
Total Population of Interlaken is 8,039.
What is the Total Male Population of Interlaken?
Total Male Population of Interlaken is 4,271.
What is the Total Female Population of Interlaken?
Total Female Population of Interlaken is 3,768.
What is the Ratio of Males per 100 Females in Interlaken?
There are 113.35 Males per 100 Females in Interlaken.
What is the Ratio of Females per 100 Males in Interlaken?
There are 88.22 Females per 100 Males in Interlaken.
What is the Median Population Age in Interlaken?
Median Population Age in Interlaken is 33.4 Years.
What is the Average Family Size in Interlaken
Average Family Size in Interlaken is 4.2 People.
What is the Average Household Size in Interlaken
Average Household Size in Interlaken is 4.0 People.
How Large is the Labor Force in Interlaken?
There are 3,719 People in the Labor Forcein in Interlaken.
What is the Percentage of People in the Labor Force in Interlaken?
65.4% of People are in the Labor Force in Interlaken.
What is the Unemployment Rate in Interlaken?
Unemployment Rate in Interlaken is 5.4%.