Solana Beach, CA Map & Demographics
Solana Beach Map
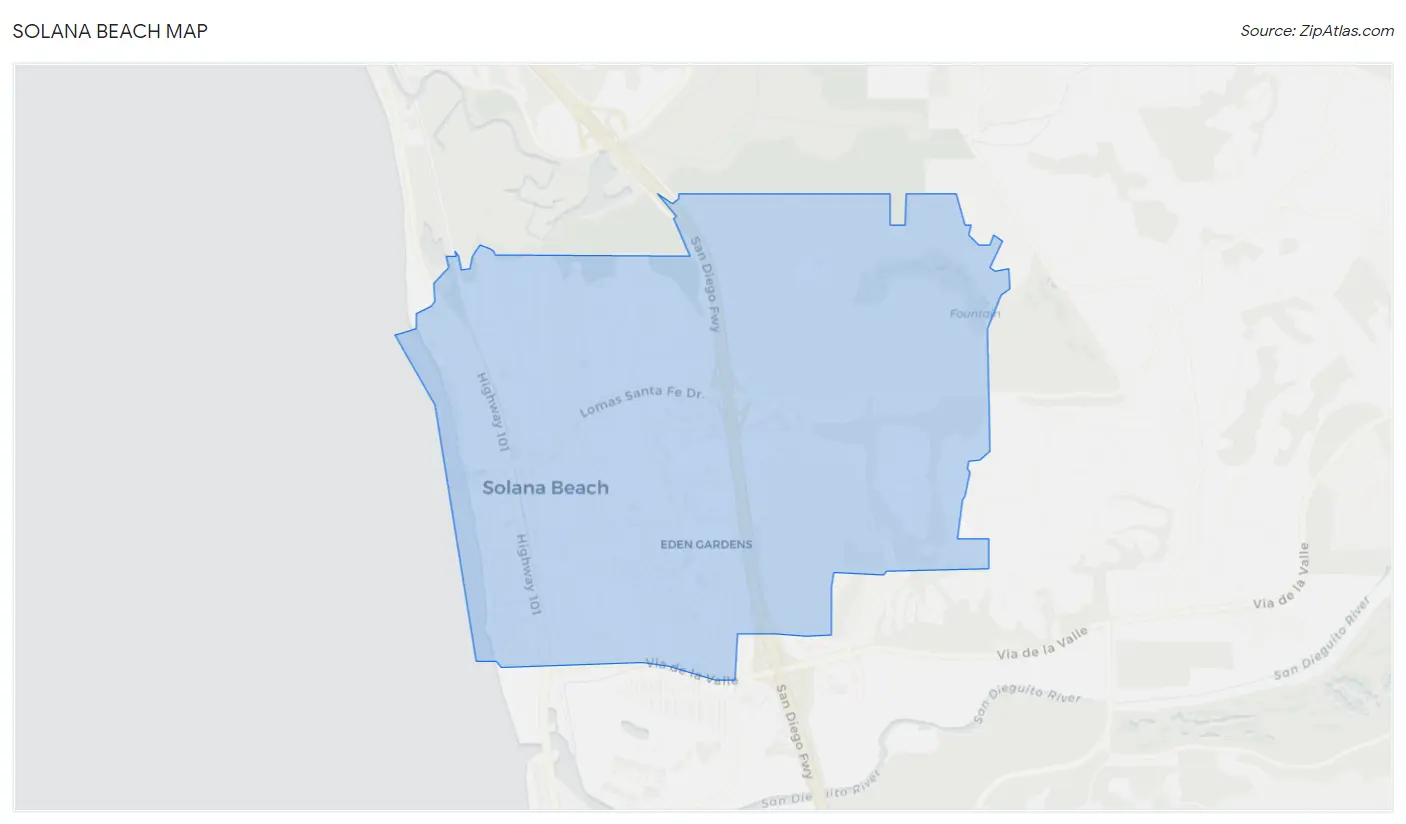
Solana Beach Overview
$86,222
PER CAPITA INCOME
$162,500
AVG FAMILY INCOME
$137,647
AVG HOUSEHOLD INCOME
30.5%
WAGE / INCOME GAP [ % ]
69.5¢/ $1
WAGE / INCOME GAP [ $ ]
0.49
INEQUALITY / GINI INDEX
12,946
TOTAL POPULATION
6,208
MALE POPULATION
6,738
FEMALE POPULATION
92.13
MALES / 100 FEMALES
108.54
FEMALES / 100 MALES
47.8
MEDIAN AGE
2.9
AVG FAMILY SIZE
2.4
AVG HOUSEHOLD SIZE
6,302
LABOR FORCE [ PEOPLE ]
59.5%
PERCENT IN LABOR FORCE
3.5%
UNEMPLOYMENT RATE
Solana Beach Zip Codes
Solana Beach Area Codes
Income in Solana Beach
Income Overview in Solana Beach
Per Capita Income in Solana Beach is $86,222, while median incomes of families and households are $162,500 and $137,647 respectively.
| Characteristic | Number | Measure |
| Per Capita Income | 12,946 | $86,222 |
| Median Family Income | 3,616 | $162,500 |
| Mean Family Income | 3,616 | $230,908 |
| Median Household Income | 5,436 | $137,647 |
| Mean Household Income | 5,436 | $203,783 |
| Income Deficit | 3,616 | $0 |
| Wage / Income Gap (%) | 12,946 | 30.46% |
| Wage / Income Gap ($) | 12,946 | 69.54¢ per $1 |
| Gini / Inequality Index | 12,946 | 0.49 |
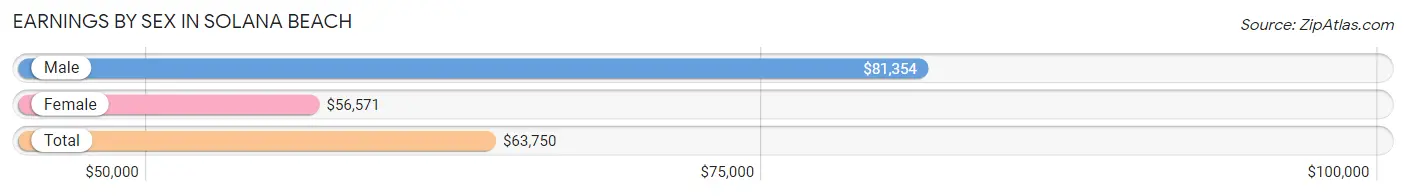
Earnings by Sex in Solana Beach
Average Earnings in Solana Beach are $63,750, $81,354 for men and $56,571 for women, a difference of 30.5%.
| Sex | Number | Average Earnings |
| Male | 3,549 (50.5%) | $81,354 |
| Female | 3,476 (49.5%) | $56,571 |
| Total | 7,025 (100.0%) | $63,750 |
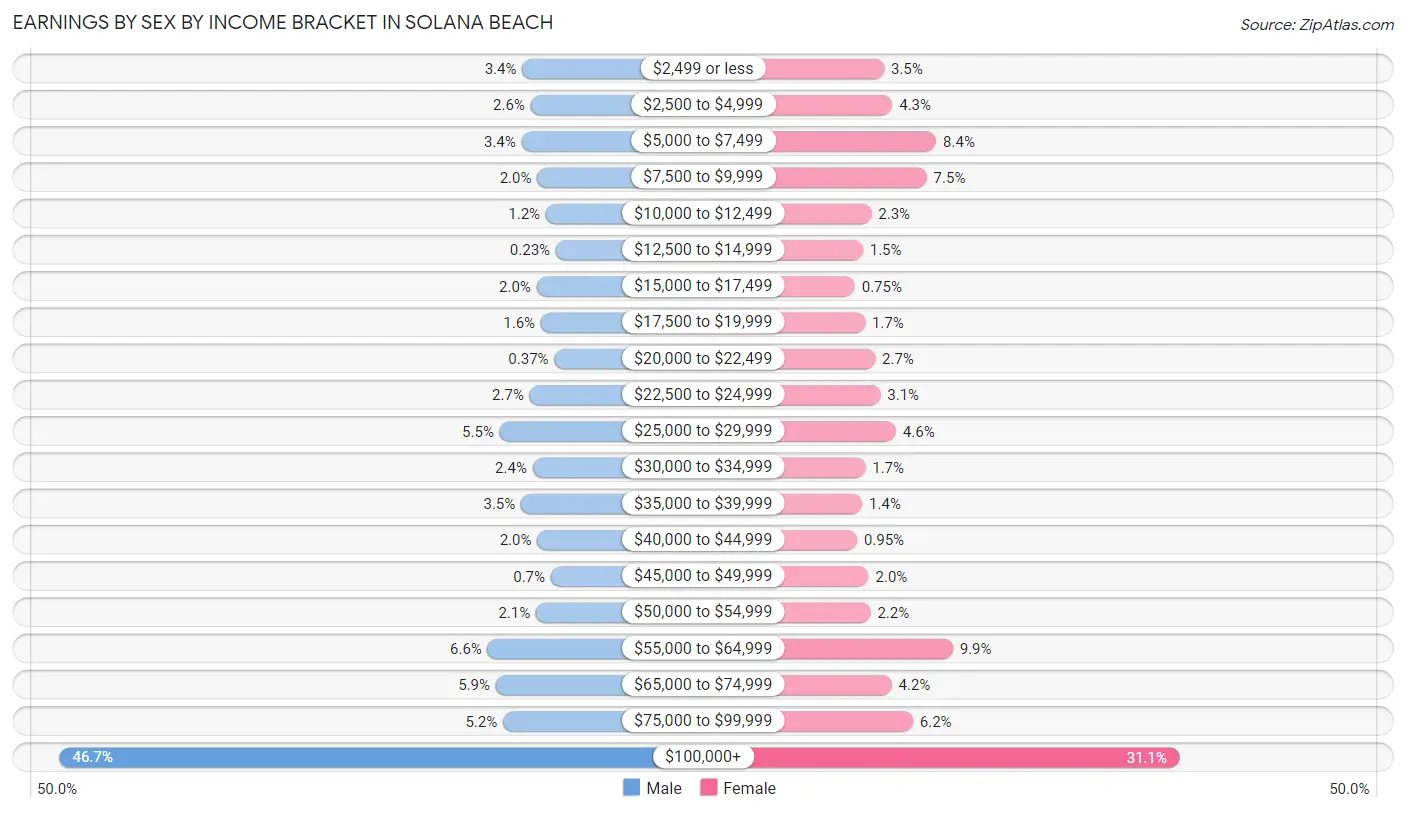
Earnings by Sex by Income Bracket in Solana Beach
The most common earnings brackets in Solana Beach are $100,000+ for men (1,658 | 46.7%) and $100,000+ for women (1,081 | 31.1%).
| Income | Male | Female |
| $2,499 or less | 120 (3.4%) | 121 (3.5%) |
| $2,500 to $4,999 | 92 (2.6%) | 148 (4.3%) |
| $5,000 to $7,499 | 122 (3.4%) | 291 (8.4%) |
| $7,500 to $9,999 | 70 (2.0%) | 260 (7.5%) |
| $10,000 to $12,499 | 41 (1.2%) | 80 (2.3%) |
| $12,500 to $14,999 | 8 (0.2%) | 52 (1.5%) |
| $15,000 to $17,499 | 72 (2.0%) | 26 (0.7%) |
| $17,500 to $19,999 | 58 (1.6%) | 59 (1.7%) |
| $20,000 to $22,499 | 13 (0.4%) | 92 (2.6%) |
| $22,500 to $24,999 | 95 (2.7%) | 109 (3.1%) |
| $25,000 to $29,999 | 195 (5.5%) | 160 (4.6%) |
| $30,000 to $34,999 | 85 (2.4%) | 60 (1.7%) |
| $35,000 to $39,999 | 124 (3.5%) | 50 (1.4%) |
| $40,000 to $44,999 | 70 (2.0%) | 33 (0.9%) |
| $45,000 to $49,999 | 25 (0.7%) | 71 (2.0%) |
| $50,000 to $54,999 | 74 (2.1%) | 77 (2.2%) |
| $55,000 to $64,999 | 235 (6.6%) | 345 (9.9%) |
| $65,000 to $74,999 | 208 (5.9%) | 146 (4.2%) |
| $75,000 to $99,999 | 184 (5.2%) | 215 (6.2%) |
| $100,000+ | 1,658 (46.7%) | 1,081 (31.1%) |
| Total | 3,549 (100.0%) | 3,476 (100.0%) |
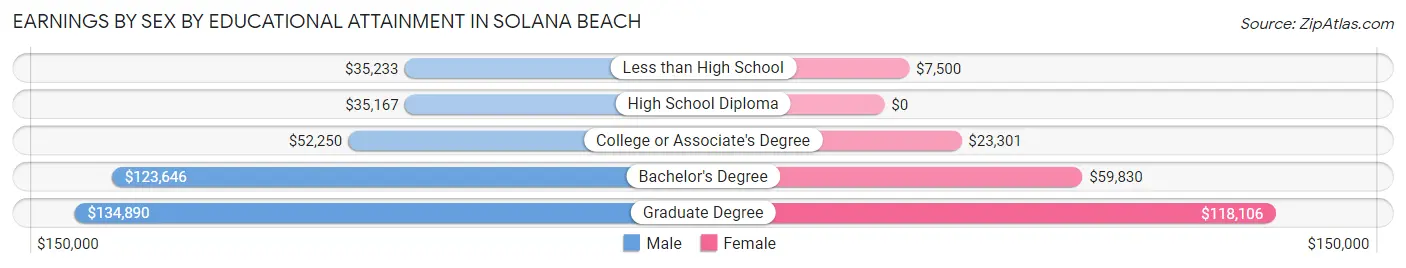
Earnings by Sex by Educational Attainment in Solana Beach
Average earnings in Solana Beach are $98,897 for men and $59,109 for women, a difference of 40.2%. Men with an educational attainment of graduate degree enjoy the highest average annual earnings of $134,890, while those with high school diploma education earn the least with $35,167. Women with an educational attainment of graduate degree earn the most with the average annual earnings of $118,106, while those with less than high school education have the smallest earnings of $7,500.
| Educational Attainment | Male Income | Female Income |
| Less than High School | $35,233 | $7,500 |
| High School Diploma | $35,167 | $0 |
| College or Associate's Degree | $52,250 | $23,301 |
| Bachelor's Degree | $123,646 | $59,830 |
| Graduate Degree | $134,890 | $118,106 |
| Total | $98,897 | $59,109 |
Family Income in Solana Beach
Family Income Brackets in Solana Beach
According to the Solana Beach family income data, there are 1,533 families falling into the $200,000+ income range, which is the most common income bracket and makes up 42.4% of all families.
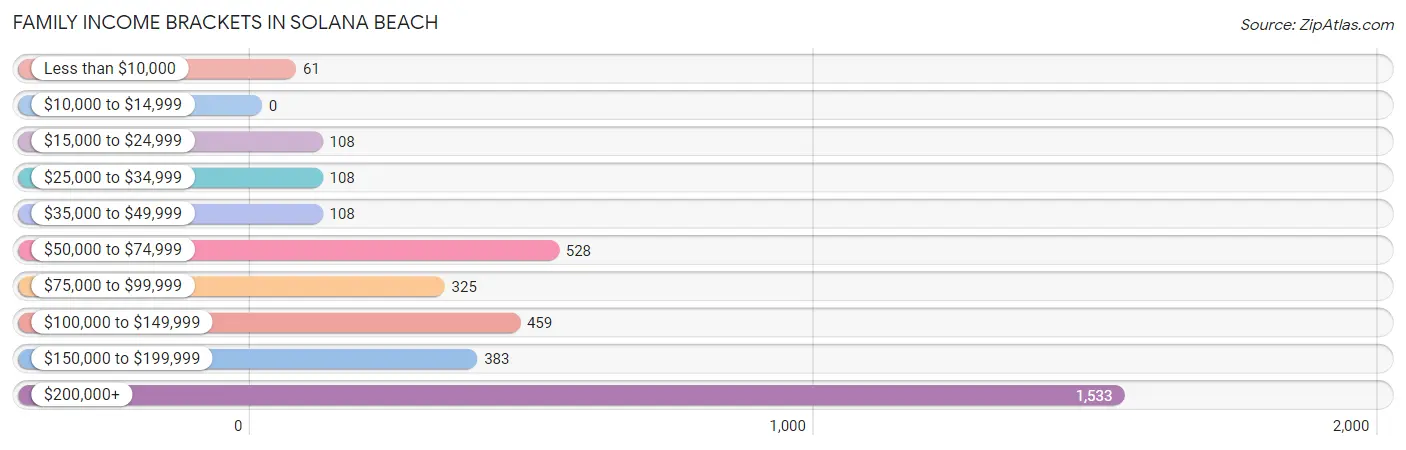
| Income Bracket | # Families | % Families |
| Less than $10,000 | 61 | 1.7% |
| $10,000 to $14,999 | 0 | 0.0% |
| $15,000 to $24,999 | 108 | 3.0% |
| $25,000 to $34,999 | 108 | 3.0% |
| $35,000 to $49,999 | 108 | 3.0% |
| $50,000 to $74,999 | 528 | 14.6% |
| $75,000 to $99,999 | 325 | 9.0% |
| $100,000 to $149,999 | 459 | 12.7% |
| $150,000 to $199,999 | 383 | 10.6% |
| $200,000+ | 1,533 | 42.4% |
Family Income by Famaliy Size in Solana Beach
4-person families (576 | 15.9%) account for the highest median family income in Solana Beach with $239,375 per family, while 3-person families (774 | 21.4%) have the highest median income of $70,875 per family member.
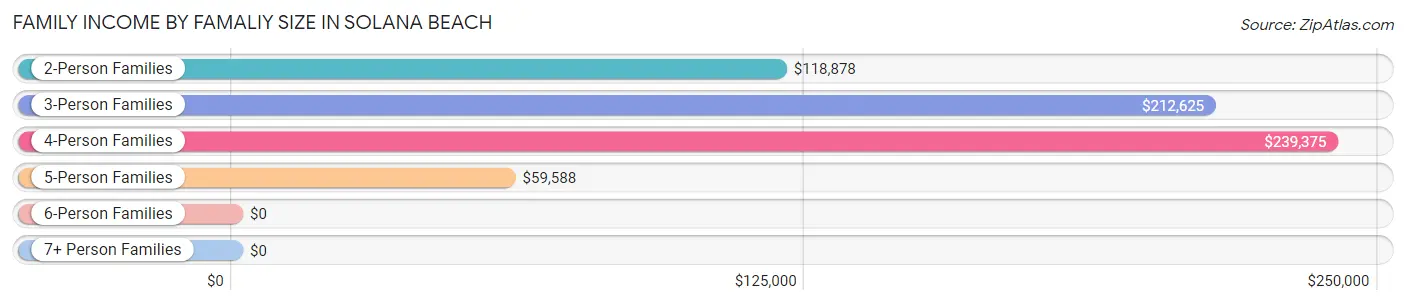
| Income Bracket | # Families | Median Income |
| 2-Person Families | 1,999 (55.3%) | $118,878 |
| 3-Person Families | 774 (21.4%) | $212,625 |
| 4-Person Families | 576 (15.9%) | $239,375 |
| 5-Person Families | 242 (6.7%) | $59,588 |
| 6-Person Families | 25 (0.7%) | $0 |
| 7+ Person Families | 0 (0.0%) | $0 |
| Total | 3,616 (100.0%) | $162,500 |
Family Income by Number of Earners in Solana Beach
The median family income in Solana Beach is $162,500, with families comprising 3+ earners (330) having the highest median family income of $230,870, while families with no earners (680) have the lowest median family income of $98,889, accounting for 9.1% and 18.8% of families, respectively.
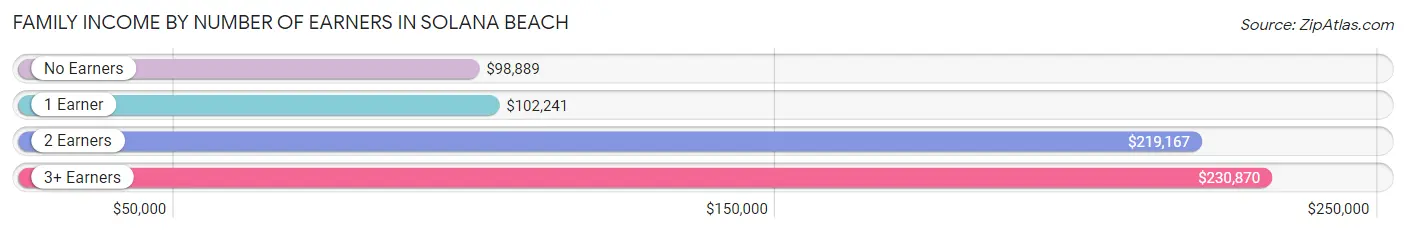
| Number of Earners | # Families | Median Income |
| No Earners | 680 (18.8%) | $98,889 |
| 1 Earner | 1,004 (27.8%) | $102,241 |
| 2 Earners | 1,602 (44.3%) | $219,167 |
| 3+ Earners | 330 (9.1%) | $230,870 |
| Total | 3,616 (100.0%) | $162,500 |
Household Income in Solana Beach
Household Income Brackets in Solana Beach
With 1,930 households falling in the category, the $200,000+ income range is the most frequent in Solana Beach, accounting for 35.5% of all households. In contrast, only 65 households (1.2%) fall into the $10,000 to $14,999 income bracket, making it the least populous group.
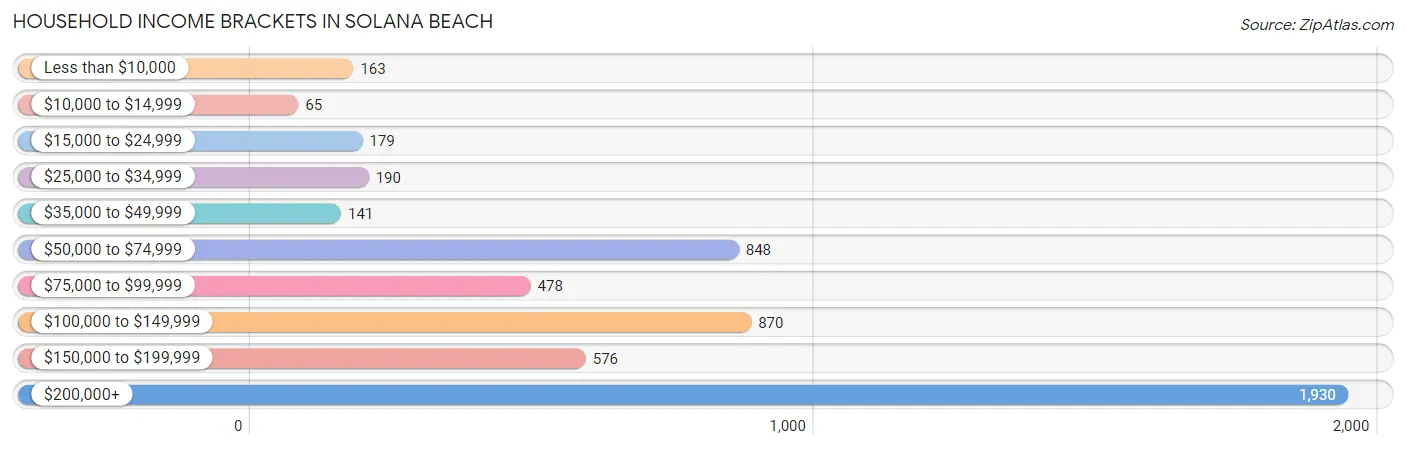
| Income Bracket | # Households | % Households |
| Less than $10,000 | 163 | 3.0% |
| $10,000 to $14,999 | 65 | 1.2% |
| $15,000 to $24,999 | 179 | 3.3% |
| $25,000 to $34,999 | 190 | 3.5% |
| $35,000 to $49,999 | 141 | 2.6% |
| $50,000 to $74,999 | 848 | 15.6% |
| $75,000 to $99,999 | 478 | 8.8% |
| $100,000 to $149,999 | 870 | 16.0% |
| $150,000 to $199,999 | 576 | 10.6% |
| $200,000+ | 1,930 | 35.5% |
Household Income by Householder Age in Solana Beach
The median household income in Solana Beach is $137,647, with the highest median household income of $164,657 found in the 45 to 64 years age bracket for the primary householder. A total of 2,481 households (45.6%) fall into this category. Meanwhile, the 15 to 24 years age bracket for the primary householder has the lowest median household income of $50,994, with 61 households (1.1%) in this group.
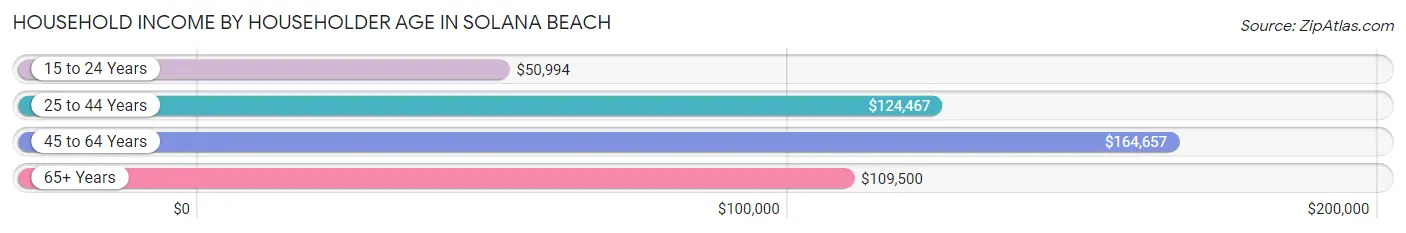
| Income Bracket | # Households | Median Income |
| 15 to 24 Years | 61 (1.1%) | $50,994 |
| 25 to 44 Years | 1,134 (20.9%) | $124,467 |
| 45 to 64 Years | 2,481 (45.6%) | $164,657 |
| 65+ Years | 1,760 (32.4%) | $109,500 |
| Total | 5,436 (100.0%) | $137,647 |
Poverty in Solana Beach
Income Below Poverty by Sex and Age in Solana Beach
With 5.0% poverty level for males and 4.6% for females among the residents of Solana Beach, 16 and 17 year old males and 16 and 17 year old females are the most vulnerable to poverty, with 21 males (17.1%) and 40 females (25.3%) in their respective age groups living below the poverty level.
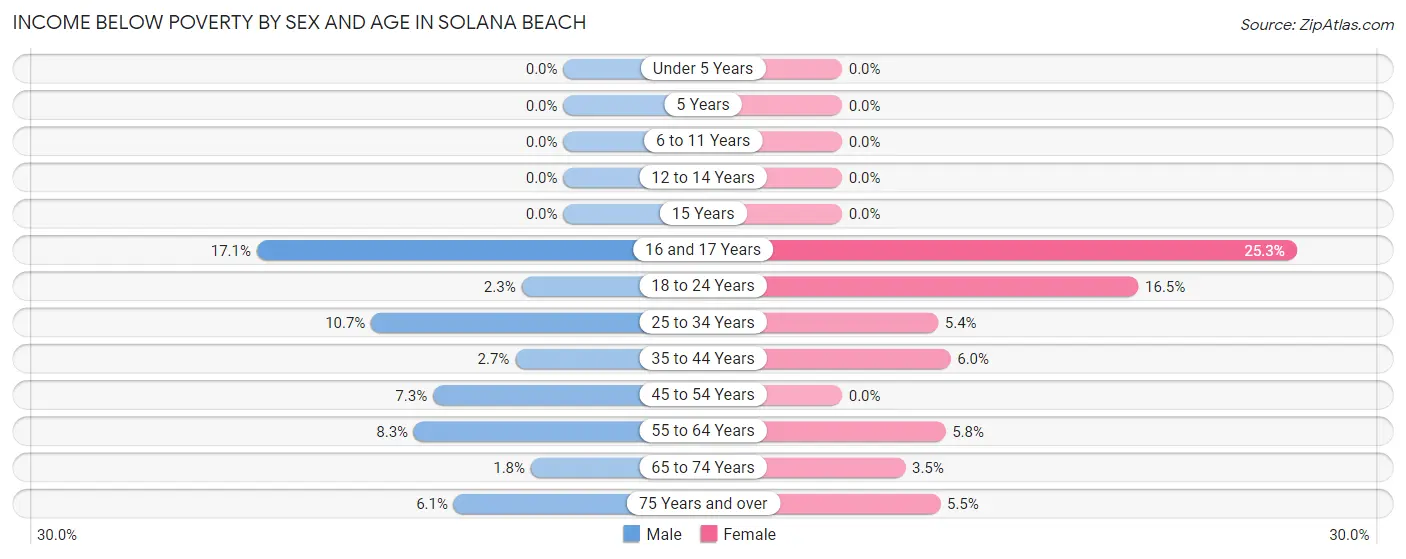
| Age Bracket | Male | Female |
| Under 5 Years | 0 (0.0%) | 0 (0.0%) |
| 5 Years | 0 (0.0%) | 0 (0.0%) |
| 6 to 11 Years | 0 (0.0%) | 0 (0.0%) |
| 12 to 14 Years | 0 (0.0%) | 0 (0.0%) |
| 15 Years | 0 (0.0%) | 0 (0.0%) |
| 16 and 17 Years | 21 (17.1%) | 40 (25.3%) |
| 18 to 24 Years | 6 (2.3%) | 49 (16.5%) |
| 25 to 34 Years | 43 (10.7%) | 34 (5.3%) |
| 35 to 44 Years | 18 (2.7%) | 60 (6.0%) |
| 45 to 54 Years | 67 (7.3%) | 0 (0.0%) |
| 55 to 64 Years | 102 (8.3%) | 58 (5.8%) |
| 65 to 74 Years | 13 (1.8%) | 31 (3.5%) |
| 75 Years and over | 37 (6.1%) | 38 (5.5%) |
| Total | 307 (5.0%) | 310 (4.6%) |
Income Above Poverty by Sex and Age in Solana Beach
According to the poverty statistics in Solana Beach, males aged under 5 years and females aged under 5 years are the age groups that are most secure financially, with 100.0% of males and 100.0% of females in these age groups living above the poverty line.
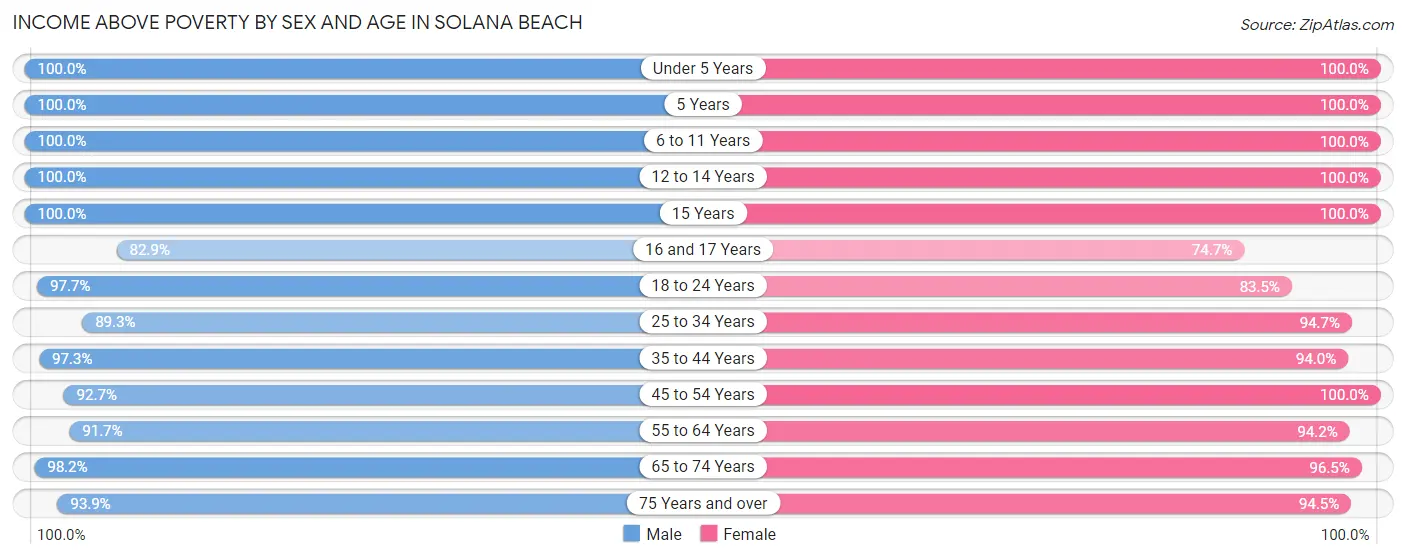
| Age Bracket | Male | Female |
| Under 5 Years | 384 (100.0%) | 255 (100.0%) |
| 5 Years | 143 (100.0%) | 75 (100.0%) |
| 6 to 11 Years | 355 (100.0%) | 480 (100.0%) |
| 12 to 14 Years | 282 (100.0%) | 238 (100.0%) |
| 15 Years | 115 (100.0%) | 27 (100.0%) |
| 16 and 17 Years | 102 (82.9%) | 118 (74.7%) |
| 18 to 24 Years | 251 (97.7%) | 248 (83.5%) |
| 25 to 34 Years | 359 (89.3%) | 602 (94.7%) |
| 35 to 44 Years | 654 (97.3%) | 933 (94.0%) |
| 45 to 54 Years | 856 (92.7%) | 997 (100.0%) |
| 55 to 64 Years | 1,124 (91.7%) | 949 (94.2%) |
| 65 to 74 Years | 706 (98.2%) | 849 (96.5%) |
| 75 Years and over | 570 (93.9%) | 657 (94.5%) |
| Total | 5,901 (95.1%) | 6,428 (95.4%) |
Income Below Poverty Among Married-Couple Families in Solana Beach
The poverty statistics for married-couple families in Solana Beach show that 1.5% or 44 of the total 3,034 families live below the poverty line. Families with no children have the highest poverty rate of 1.9%, comprising of 40 families. On the other hand, families with 3 or 4 children have the lowest poverty rate of 0.0%, which includes 0 families.
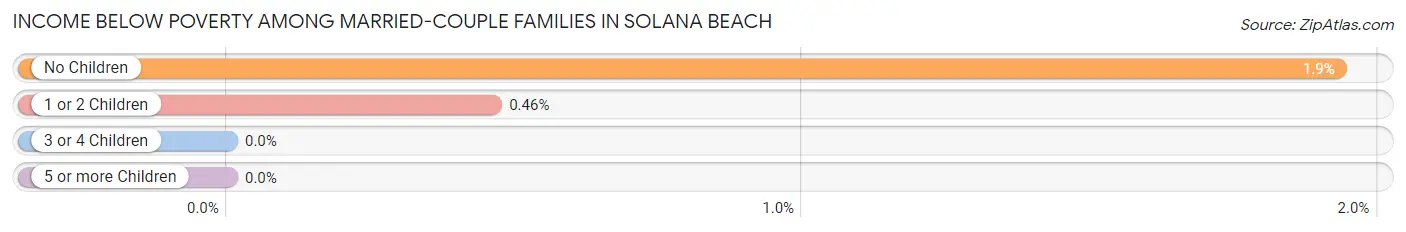
| Children | Above Poverty | Below Poverty |
| No Children | 2,032 (98.1%) | 40 (1.9%) |
| 1 or 2 Children | 868 (99.5%) | 4 (0.5%) |
| 3 or 4 Children | 90 (100.0%) | 0 (0.0%) |
| 5 or more Children | 0 (0.0%) | 0 (0.0%) |
| Total | 2,990 (98.6%) | 44 (1.5%) |
Income Below Poverty Among Single-Parent Households in Solana Beach
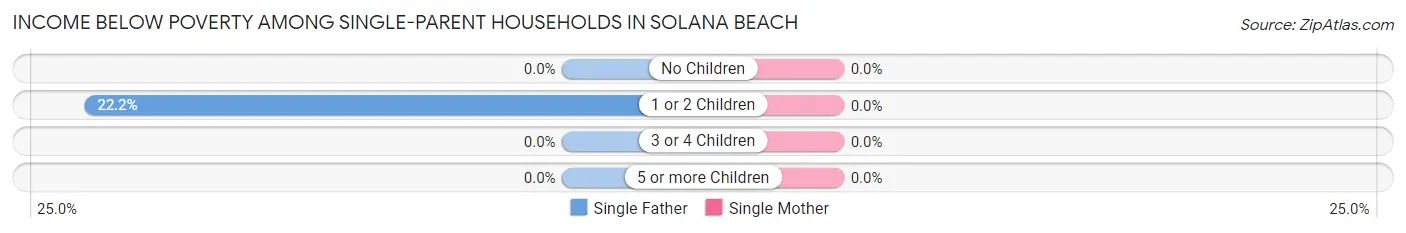
| Children | Single Father | Single Mother |
| No Children | 0 (0.0%) | 0 (0.0%) |
| 1 or 2 Children | 38 (22.2%) | 0 (0.0%) |
| 3 or 4 Children | 0 (0.0%) | 0 (0.0%) |
| 5 or more Children | 0 (0.0%) | 0 (0.0%) |
| Total | 38 (18.2%) | 0 (0.0%) |
Income Below Poverty Among Married-Couple vs Single-Parent Households in Solana Beach
The poverty data for Solana Beach shows that 44 of the married-couple family households (1.5%) and 38 of the single-parent households (6.5%) are living below the poverty level. Within the married-couple family households, those with no children have the highest poverty rate, with 40 households (1.9%) falling below the poverty line. Among the single-parent households, those with 1 or 2 children have the highest poverty rate, with 38 household (11.8%) living below poverty.
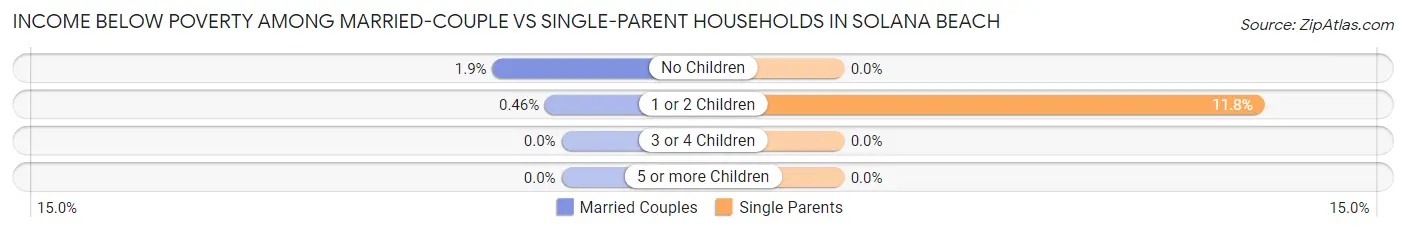
| Children | Married-Couple Families | Single-Parent Households |
| No Children | 40 (1.9%) | 0 (0.0%) |
| 1 or 2 Children | 4 (0.5%) | 38 (11.8%) |
| 3 or 4 Children | 0 (0.0%) | 0 (0.0%) |
| 5 or more Children | 0 (0.0%) | 0 (0.0%) |
| Total | 44 (1.5%) | 38 (6.5%) |
Race in Solana Beach
The most populous races in Solana Beach are White / Caucasian (10,094 | 78.0%), Hispanic or Latino (1,955 | 15.1%), and Two or more Races (1,432 | 11.1%).
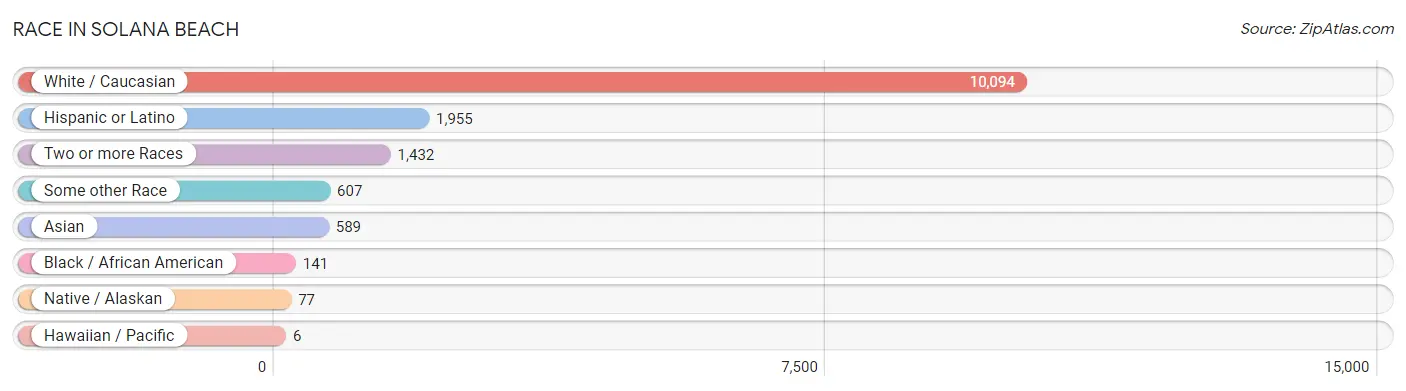
| Race | # Population | % Population |
| Asian | 589 | 4.5% |
| Black / African American | 141 | 1.1% |
| Hawaiian / Pacific | 6 | 0.1% |
| Hispanic or Latino | 1,955 | 15.1% |
| Native / Alaskan | 77 | 0.6% |
| White / Caucasian | 10,094 | 78.0% |
| Two or more Races | 1,432 | 11.1% |
| Some other Race | 607 | 4.7% |
| Total | 12,946 | 100.0% |
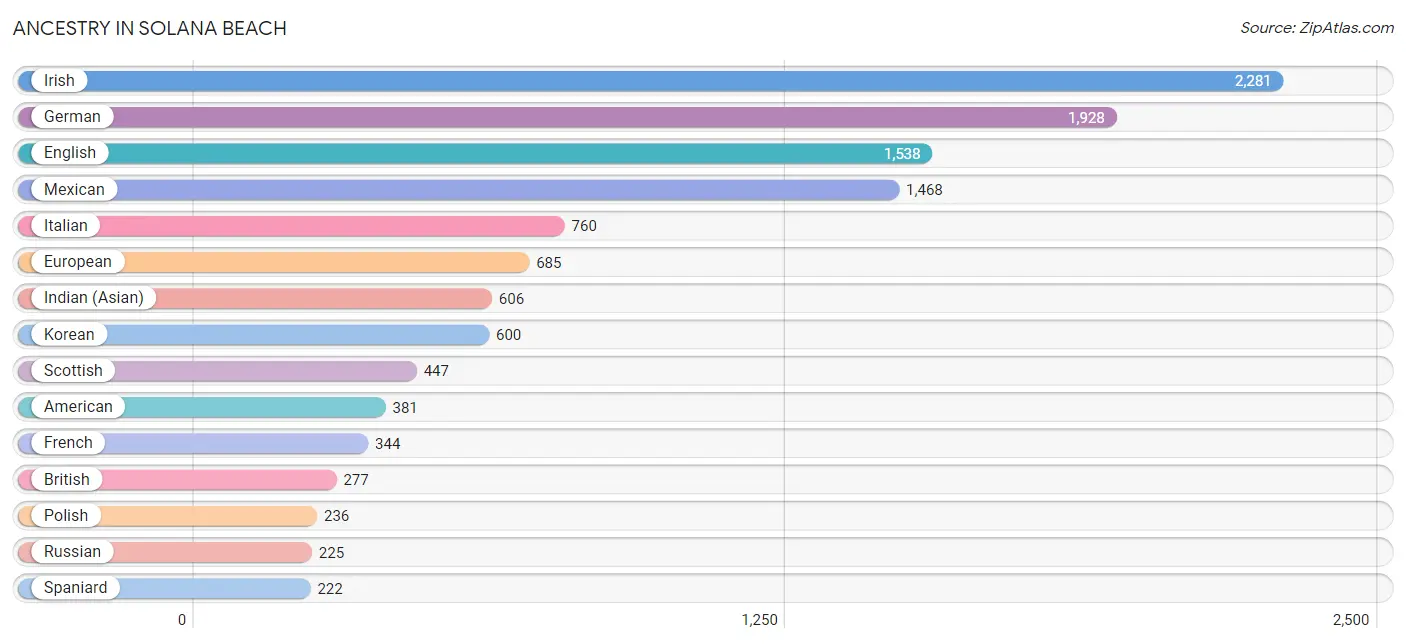
Ancestry in Solana Beach
The most populous ancestries reported in Solana Beach are Irish (2,281 | 17.6%), German (1,928 | 14.9%), English (1,538 | 11.9%), Mexican (1,468 | 11.3%), and Italian (760 | 5.9%), together accounting for 61.6% of all Solana Beach residents.
| Ancestry | # Population | % Population |
| African | 9 | 0.1% |
| American | 381 | 2.9% |
| Arab | 81 | 0.6% |
| Arapaho | 6 | 0.1% |
| Armenian | 57 | 0.4% |
| Australian | 9 | 0.1% |
| Austrian | 76 | 0.6% |
| Basque | 118 | 0.9% |
| Belgian | 39 | 0.3% |
| Bhutanese | 66 | 0.5% |
| Brazilian | 37 | 0.3% |
| British | 277 | 2.1% |
| British West Indian | 12 | 0.1% |
| Burmese | 75 | 0.6% |
| Canadian | 52 | 0.4% |
| Central American | 97 | 0.7% |
| Cherokee | 91 | 0.7% |
| Croatian | 8 | 0.1% |
| Cuban | 63 | 0.5% |
| Czech | 44 | 0.3% |
| Danish | 38 | 0.3% |
| Dominican | 19 | 0.2% |
| Dutch | 217 | 1.7% |
| Eastern European | 69 | 0.5% |
| Egyptian | 38 | 0.3% |
| English | 1,538 | 11.9% |
| European | 685 | 5.3% |
| Filipino | 35 | 0.3% |
| Finnish | 66 | 0.5% |
| French | 344 | 2.7% |
| French Canadian | 35 | 0.3% |
| German | 1,928 | 14.9% |
| Ghanaian | 12 | 0.1% |
| Greek | 62 | 0.5% |
| Guatemalan | 16 | 0.1% |
| Honduran | 13 | 0.1% |
| Hungarian | 35 | 0.3% |
| Icelander | 7 | 0.1% |
| Indian (Asian) | 606 | 4.7% |
| Iranian | 187 | 1.4% |
| Irish | 2,281 | 17.6% |
| Israeli | 15 | 0.1% |
| Italian | 760 | 5.9% |
| Korean | 600 | 4.6% |
| Laotian | 77 | 0.6% |
| Latvian | 9 | 0.1% |
| Lebanese | 11 | 0.1% |
| Lithuanian | 23 | 0.2% |
| Luxembourger | 8 | 0.1% |
| Malaysian | 175 | 1.3% |
| Maltese | 16 | 0.1% |
| Mexican | 1,468 | 11.3% |
| Native Hawaiian | 36 | 0.3% |
| Nigerian | 5 | 0.0% |
| Northern European | 119 | 0.9% |
| Norwegian | 202 | 1.6% |
| Pakistani | 42 | 0.3% |
| Panamanian | 30 | 0.2% |
| Polish | 236 | 1.8% |
| Portuguese | 44 | 0.3% |
| Puerto Rican | 8 | 0.1% |
| Romanian | 24 | 0.2% |
| Russian | 225 | 1.7% |
| Salvadoran | 38 | 0.3% |
| Scandinavian | 59 | 0.5% |
| Scotch-Irish | 44 | 0.3% |
| Scottish | 447 | 3.5% |
| Serbian | 17 | 0.1% |
| Slavic | 12 | 0.1% |
| Slovak | 17 | 0.1% |
| Slovene | 10 | 0.1% |
| Spaniard | 222 | 1.7% |
| Spanish | 7 | 0.1% |
| Sri Lankan | 51 | 0.4% |
| Subsaharan African | 26 | 0.2% |
| Swedish | 180 | 1.4% |
| Swiss | 29 | 0.2% |
| Syrian | 11 | 0.1% |
| Thai | 62 | 0.5% |
| Ukrainian | 79 | 0.6% |
| Welsh | 50 | 0.4% |
| Yugoslavian | 9 | 0.1% |
| Yuman | 7 | 0.1% | View All 83 Rows |
Immigrants in Solana Beach
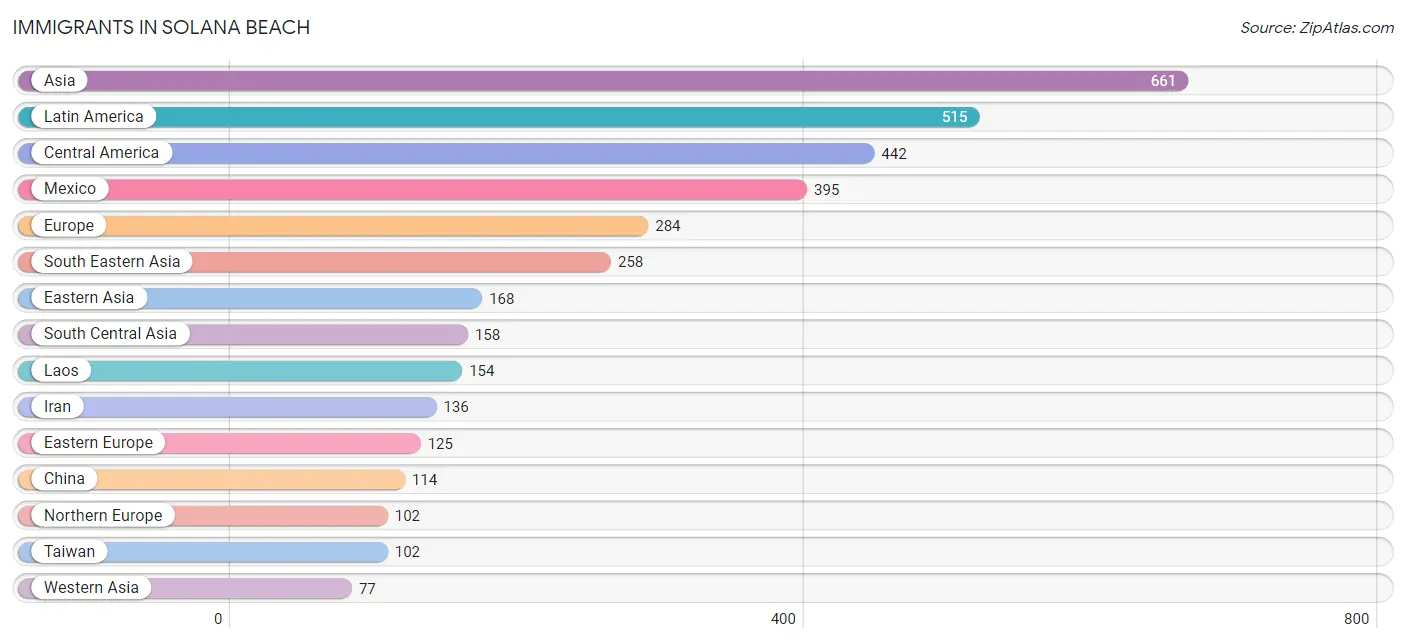
The most numerous immigrant groups reported in Solana Beach came from Asia (661 | 5.1%), Latin America (515 | 4.0%), Central America (442 | 3.4%), Mexico (395 | 3.0%), and Europe (284 | 2.2%), together accounting for 17.7% of all Solana Beach residents.
| Immigration Origin | # Population | % Population |
| Africa | 52 | 0.4% |
| Armenia | 27 | 0.2% |
| Asia | 661 | 5.1% |
| Australia | 25 | 0.2% |
| Bosnia and Herzegovina | 9 | 0.1% |
| Brazil | 11 | 0.1% |
| Canada | 62 | 0.5% |
| Caribbean | 62 | 0.5% |
| Central America | 442 | 3.4% |
| China | 114 | 0.9% |
| Cuba | 31 | 0.2% |
| Dominican Republic | 19 | 0.2% |
| Eastern Africa | 9 | 0.1% |
| Eastern Asia | 168 | 1.3% |
| Eastern Europe | 125 | 1.0% |
| Egypt | 13 | 0.1% |
| England | 29 | 0.2% |
| Europe | 284 | 2.2% |
| France | 16 | 0.1% |
| Germany | 30 | 0.2% |
| Ghana | 12 | 0.1% |
| Guatemala | 16 | 0.1% |
| Honduras | 13 | 0.1% |
| Hungary | 21 | 0.2% |
| India | 10 | 0.1% |
| Indonesia | 42 | 0.3% |
| Iran | 136 | 1.1% |
| Iraq | 11 | 0.1% |
| Israel | 27 | 0.2% |
| Italy | 11 | 0.1% |
| Japan | 21 | 0.2% |
| Korea | 33 | 0.3% |
| Laos | 154 | 1.2% |
| Latin America | 515 | 4.0% |
| Mexico | 395 | 3.0% |
| Northern Africa | 13 | 0.1% |
| Northern Europe | 102 | 0.8% |
| Norway | 9 | 0.1% |
| Oceania | 36 | 0.3% |
| Panama | 18 | 0.1% |
| Philippines | 24 | 0.2% |
| Romania | 13 | 0.1% |
| Russia | 65 | 0.5% |
| South Africa | 18 | 0.1% |
| South America | 11 | 0.1% |
| South Central Asia | 158 | 1.2% |
| South Eastern Asia | 258 | 2.0% |
| Southern Europe | 11 | 0.1% |
| Syria | 5 | 0.0% |
| Taiwan | 102 | 0.8% |
| Turkey | 7 | 0.1% |
| Ukraine | 17 | 0.1% |
| Vietnam | 38 | 0.3% |
| Western Africa | 12 | 0.1% |
| Western Asia | 77 | 0.6% |
| Western Europe | 46 | 0.4% | View All 56 Rows |
Sex and Age in Solana Beach
Sex and Age in Solana Beach
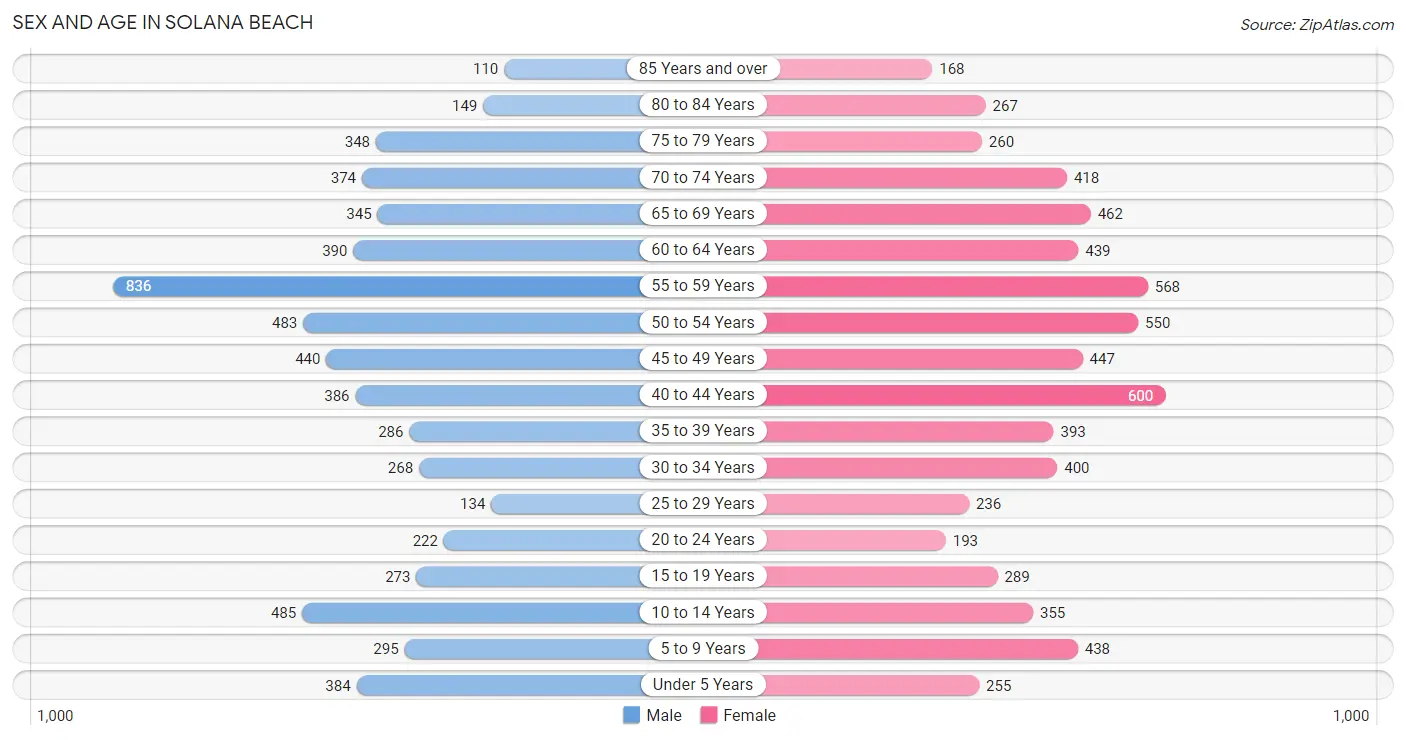
The most populous age groups in Solana Beach are 55 to 59 Years (836 | 13.5%) for men and 40 to 44 Years (600 | 8.9%) for women.
| Age Bracket | Male | Female |
| Under 5 Years | 384 (6.2%) | 255 (3.8%) |
| 5 to 9 Years | 295 (4.8%) | 438 (6.5%) |
| 10 to 14 Years | 485 (7.8%) | 355 (5.3%) |
| 15 to 19 Years | 273 (4.4%) | 289 (4.3%) |
| 20 to 24 Years | 222 (3.6%) | 193 (2.9%) |
| 25 to 29 Years | 134 (2.2%) | 236 (3.5%) |
| 30 to 34 Years | 268 (4.3%) | 400 (5.9%) |
| 35 to 39 Years | 286 (4.6%) | 393 (5.8%) |
| 40 to 44 Years | 386 (6.2%) | 600 (8.9%) |
| 45 to 49 Years | 440 (7.1%) | 447 (6.6%) |
| 50 to 54 Years | 483 (7.8%) | 550 (8.2%) |
| 55 to 59 Years | 836 (13.5%) | 568 (8.4%) |
| 60 to 64 Years | 390 (6.3%) | 439 (6.5%) |
| 65 to 69 Years | 345 (5.6%) | 462 (6.9%) |
| 70 to 74 Years | 374 (6.0%) | 418 (6.2%) |
| 75 to 79 Years | 348 (5.6%) | 260 (3.9%) |
| 80 to 84 Years | 149 (2.4%) | 267 (4.0%) |
| 85 Years and over | 110 (1.8%) | 168 (2.5%) |
| Total | 6,208 (100.0%) | 6,738 (100.0%) |
Families and Households in Solana Beach
Median Family Size in Solana Beach
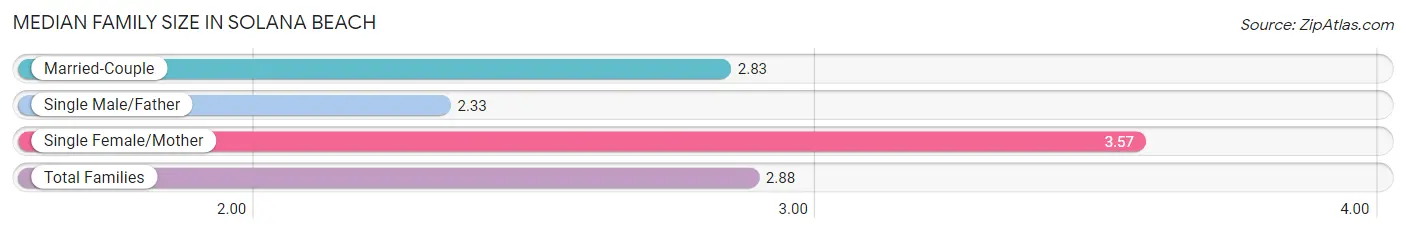
The median family size in Solana Beach is 2.88 persons per family, with single female/mother families (373 | 10.3%) accounting for the largest median family size of 3.57 persons per family. On the other hand, single male/father families (209 | 5.8%) represent the smallest median family size with 2.33 persons per family.
| Family Type | # Families | Family Size |
| Married-Couple | 3,034 (83.9%) | 2.83 |
| Single Male/Father | 209 (5.8%) | 2.33 |
| Single Female/Mother | 373 (10.3%) | 3.57 |
| Total Families | 3,616 (100.0%) | 2.88 |
Median Household Size in Solana Beach
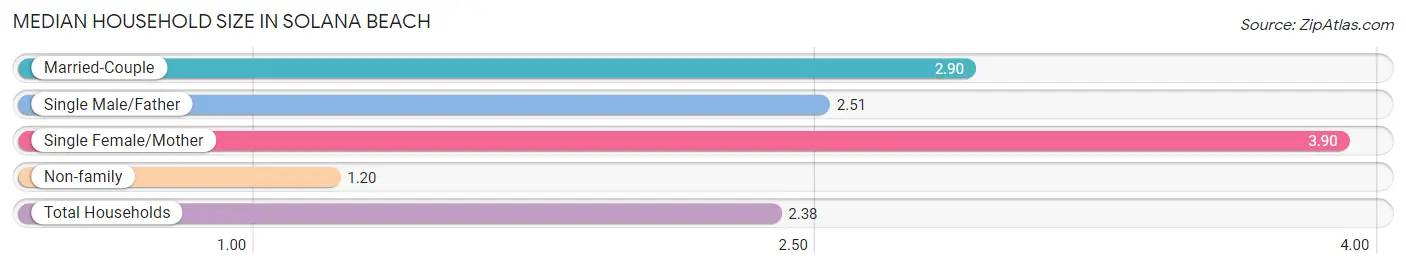
The median household size in Solana Beach is 2.38 persons per household, with single female/mother households (373 | 6.9%) accounting for the largest median household size of 3.9 persons per household. non-family households (1,820 | 33.5%) represent the smallest median household size with 1.20 persons per household.
| Household Type | # Households | Household Size |
| Married-Couple | 3,034 (55.8%) | 2.90 |
| Single Male/Father | 209 (3.8%) | 2.51 |
| Single Female/Mother | 373 (6.9%) | 3.90 |
| Non-family | 1,820 (33.5%) | 1.20 |
| Total Households | 5,436 (100.0%) | 2.38 |
Household Size by Marriage Status in Solana Beach
Out of a total of 5,436 households in Solana Beach, 3,616 (66.5%) are family households, while 1,820 (33.5%) are nonfamily households. The most numerous type of family households are 2-person households, comprising 1,955, and the most common type of nonfamily households are 1-person households, comprising 1,520.
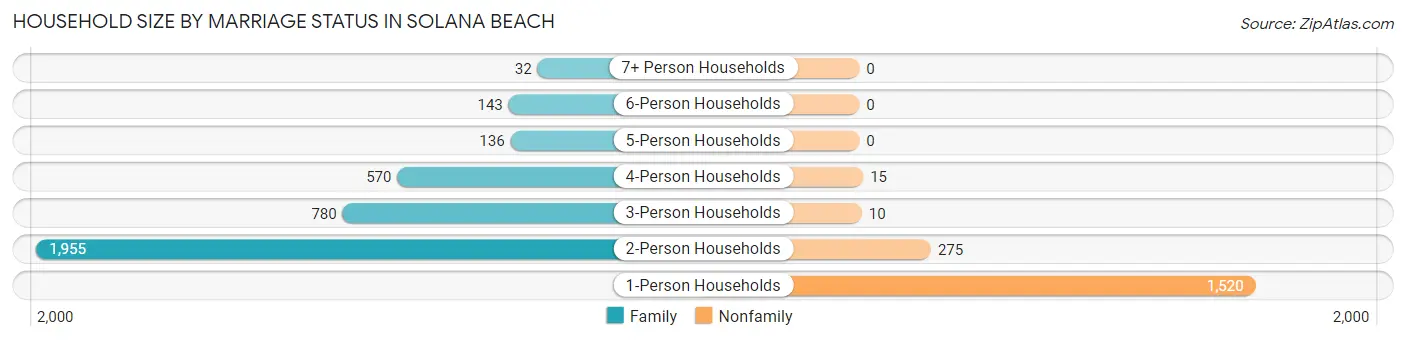
| Household Size | Family Households | Nonfamily Households |
| 1-Person Households | - | 1,520 (28.0%) |
| 2-Person Households | 1,955 (36.0%) | 275 (5.1%) |
| 3-Person Households | 780 (14.3%) | 10 (0.2%) |
| 4-Person Households | 570 (10.5%) | 15 (0.3%) |
| 5-Person Households | 136 (2.5%) | 0 (0.0%) |
| 6-Person Households | 143 (2.6%) | 0 (0.0%) |
| 7+ Person Households | 32 (0.6%) | 0 (0.0%) |
| Total | 3,616 (66.5%) | 1,820 (33.5%) |
Female Fertility in Solana Beach
Fertility by Age in Solana Beach
Average fertility rate in Solana Beach is 77.0 births per 1,000 women. Women in the age bracket of 35 to 50 years have the highest fertility rate with 94.0 births per 1,000 women. Women in the age bracket of 35 to 50 years acount for 69.8% of all women with births.
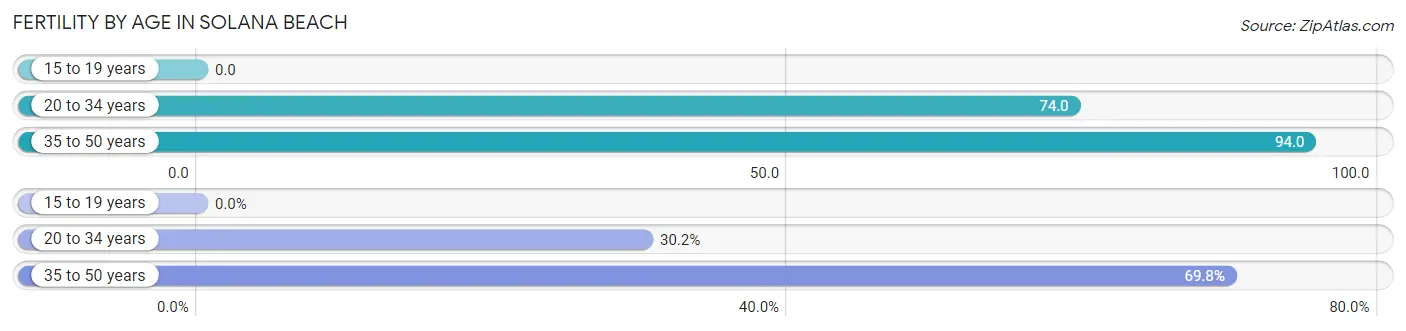
| Age Bracket | Women with Births | Births / 1,000 Women |
| 15 to 19 years | 0 (0.0%) | 0.0 |
| 20 to 34 years | 61 (30.2%) | 74.0 |
| 35 to 50 years | 141 (69.8%) | 94.0 |
| Total | 202 (100.0%) | 77.0 |
Fertility by Age by Marriage Status in Solana Beach
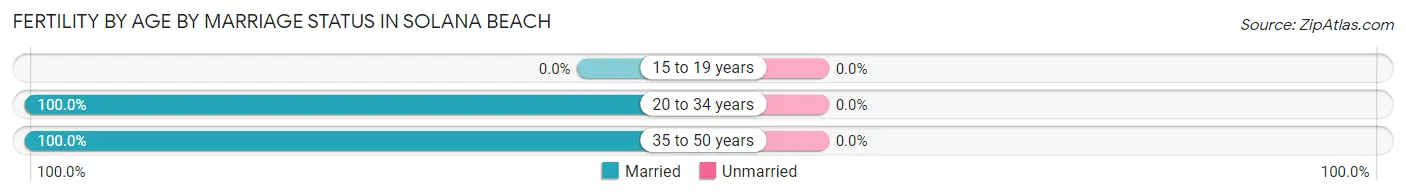
| Age Bracket | Married | Unmarried |
| 15 to 19 years | 0 (0.0%) | 0 (0.0%) |
| 20 to 34 years | 61 (100.0%) | 0 (0.0%) |
| 35 to 50 years | 141 (100.0%) | 0 (0.0%) |
| Total | 202 (100.0%) | 0 (0.0%) |
Fertility by Education in Solana Beach
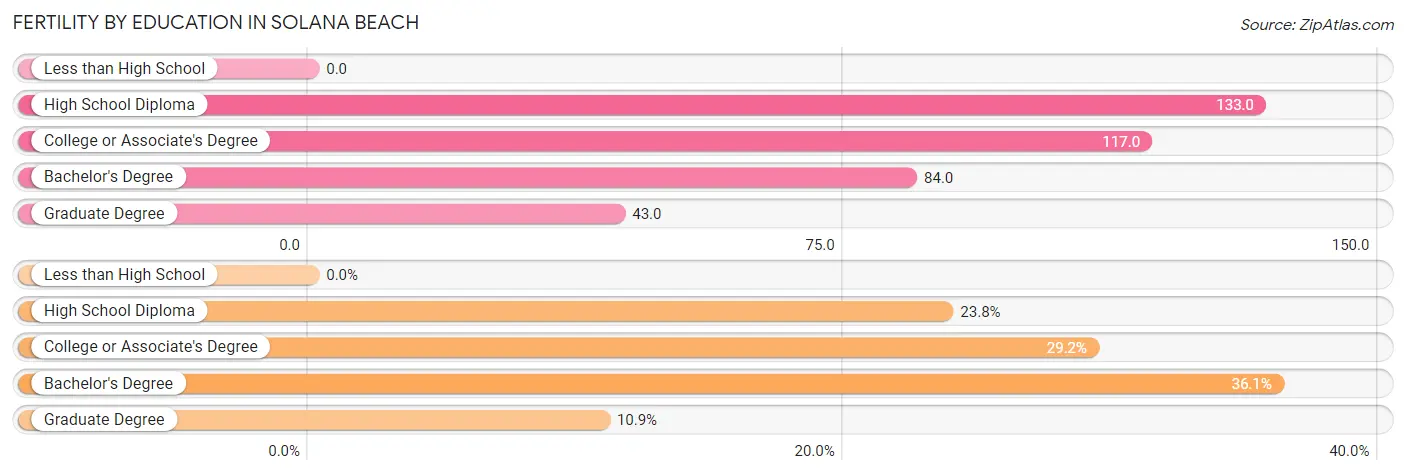
| Educational Attainment | Women with Births | Births / 1,000 Women |
| Less than High School | 0 (0.0%) | 0.0 |
| High School Diploma | 48 (23.8%) | 133.0 |
| College or Associate's Degree | 59 (29.2%) | 117.0 |
| Bachelor's Degree | 73 (36.1%) | 84.0 |
| Graduate Degree | 22 (10.9%) | 43.0 |
| Total | 202 (100.0%) | 77.0 |
Fertility by Education by Marriage Status in Solana Beach
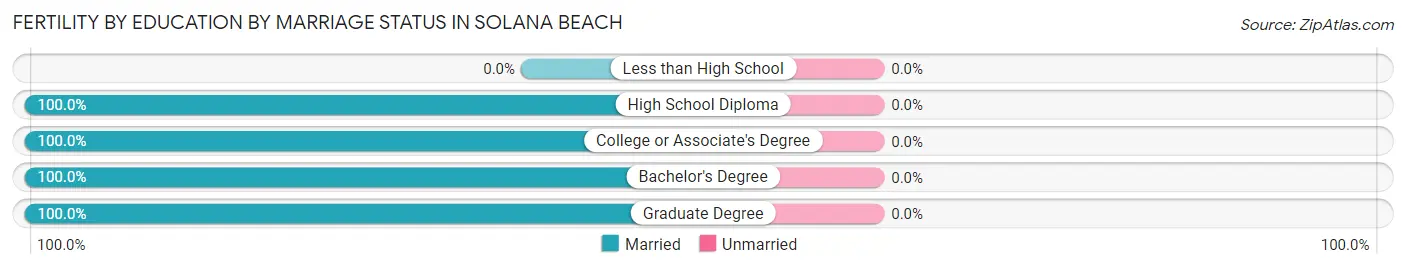
| Educational Attainment | Married | Unmarried |
| Less than High School | 0 (0.0%) | 0 (0.0%) |
| High School Diploma | 48 (100.0%) | 0 (0.0%) |
| College or Associate's Degree | 59 (100.0%) | 0 (0.0%) |
| Bachelor's Degree | 73 (100.0%) | 0 (0.0%) |
| Graduate Degree | 22 (100.0%) | 0 (0.0%) |
| Total | 202 (100.0%) | 0 (0.0%) |
Employment Characteristics in Solana Beach
Employment by Class of Employer in Solana Beach
Among the 5,849 employed individuals in Solana Beach, private company employees (3,505 | 59.9%), self-employed (incorporated) (670 | 11.5%), and not-for-profit organizations (605 | 10.3%) make up the most common classes of employment.
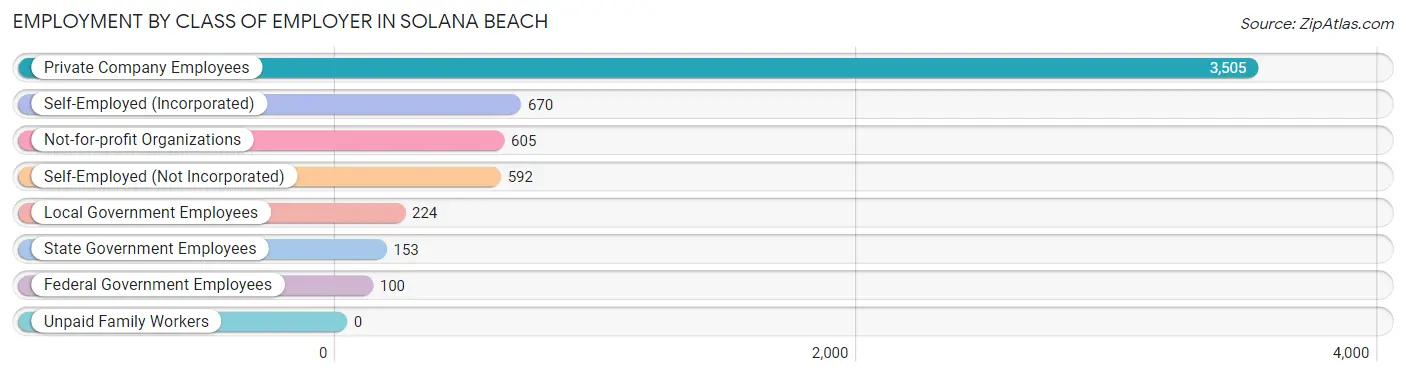
| Employer Class | # Employees | % Employees |
| Private Company Employees | 3,505 | 59.9% |
| Self-Employed (Incorporated) | 670 | 11.5% |
| Self-Employed (Not Incorporated) | 592 | 10.1% |
| Not-for-profit Organizations | 605 | 10.3% |
| Local Government Employees | 224 | 3.8% |
| State Government Employees | 153 | 2.6% |
| Federal Government Employees | 100 | 1.7% |
| Unpaid Family Workers | 0 | 0.0% |
| Total | 5,849 | 100.0% |
Employment Status by Age in Solana Beach
According to the labor force statistics for Solana Beach, out of the total population over 16 years of age (10,592), 59.5% or 6,302 individuals are in the labor force, with 3.5% or 221 of them unemployed. The age group with the highest labor force participation rate is 35 to 44 years, with 92.0% or 1,532 individuals in the labor force. Within the labor force, the 20 to 24 years age range has the highest percentage of unemployed individuals, with 21.3% or 54 of them being unemployed.
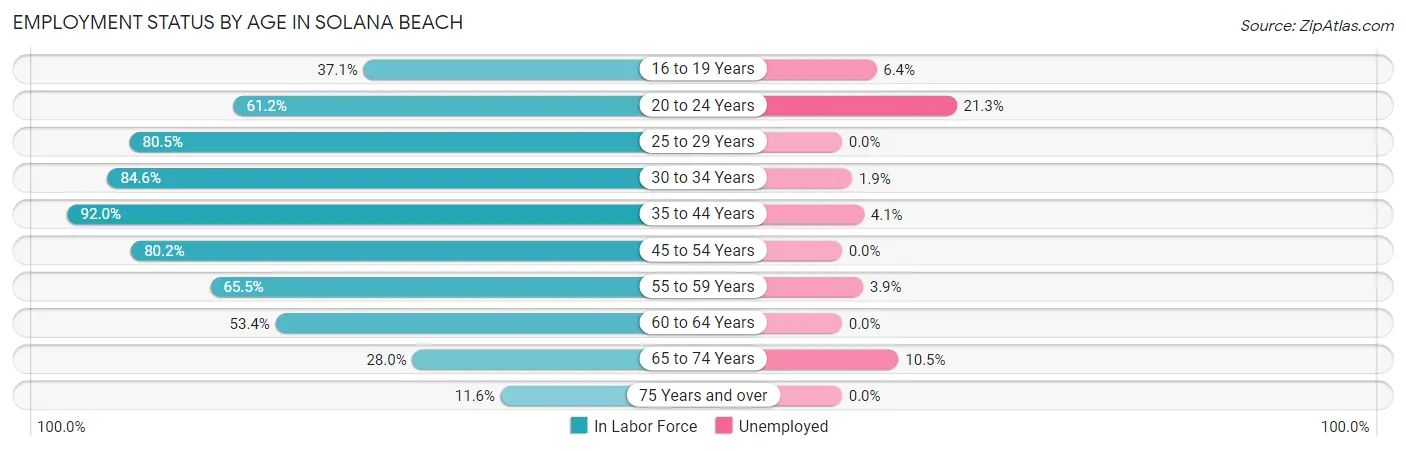
| Age Bracket | In Labor Force | Unemployed |
| 16 to 19 Years | 156 (37.1%) | 10 (6.4%) |
| 20 to 24 Years | 254 (61.2%) | 54 (21.3%) |
| 25 to 29 Years | 298 (80.5%) | 0 (0.0%) |
| 30 to 34 Years | 565 (84.6%) | 11 (1.9%) |
| 35 to 44 Years | 1,532 (92.0%) | 63 (4.1%) |
| 45 to 54 Years | 1,540 (80.2%) | 0 (0.0%) |
| 55 to 59 Years | 920 (65.5%) | 36 (3.9%) |
| 60 to 64 Years | 443 (53.4%) | 0 (0.0%) |
| 65 to 74 Years | 448 (28.0%) | 47 (10.5%) |
| 75 Years and over | 151 (11.6%) | 0 (0.0%) |
| Total | 6,302 (59.5%) | 221 (3.5%) |
Employment Status by Educational Attainment in Solana Beach
According to labor force statistics for Solana Beach, 77.2% of individuals (5,293) out of the total population between 25 and 64 years of age (6,856) are in the labor force, with 2.1% or 111 of them being unemployed. The group with the highest labor force participation rate are those with the educational attainment of bachelor's degree or higher, with 79.7% or 3,758 individuals in the labor force. Within the labor force, individuals with high school diploma education have the highest percentage of unemployment, with 10.5% or 48 of them being unemployed.
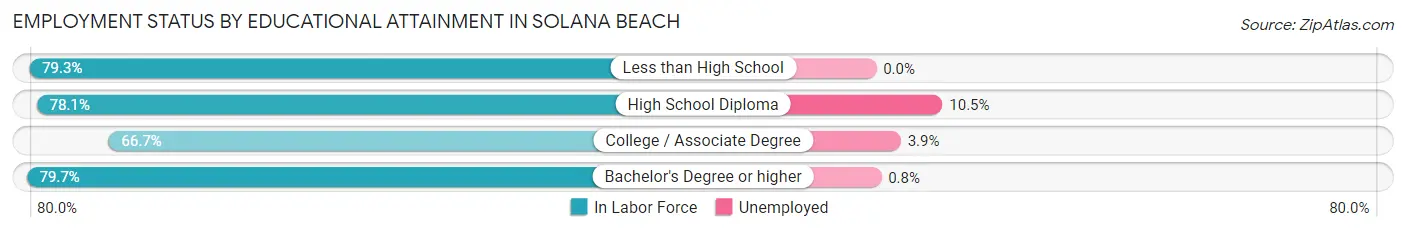
| Educational Attainment | In Labor Force | Unemployed |
| Less than High School | 257 (79.3%) | 0 (0.0%) |
| High School Diploma | 457 (78.1%) | 61 (10.5%) |
| College / Associate Degree | 822 (66.7%) | 48 (3.9%) |
| Bachelor's Degree or higher | 3,758 (79.7%) | 38 (0.8%) |
| Total | 5,293 (77.2%) | 144 (2.1%) |
Employment Occupations by Sex in Solana Beach
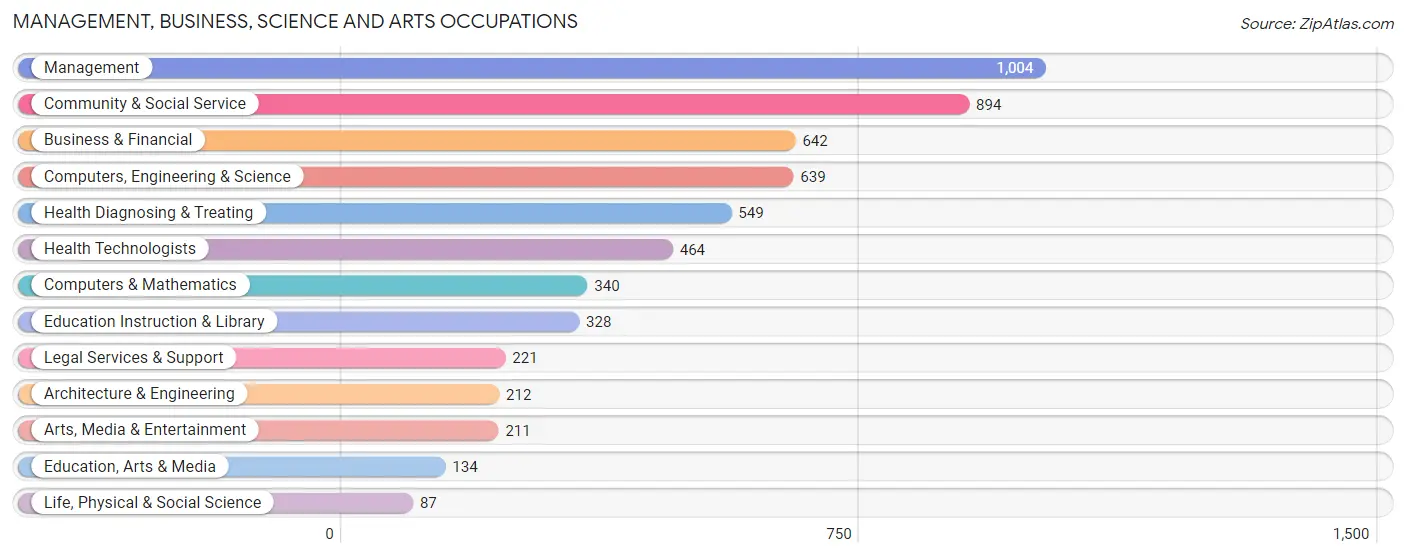
Management, Business, Science and Arts Occupations
The most common Management, Business, Science and Arts occupations in Solana Beach are Management (1,004 | 16.7%), Community & Social Service (894 | 14.8%), Business & Financial (642 | 10.6%), Computers, Engineering & Science (639 | 10.6%), and Health Diagnosing & Treating (549 | 9.1%).
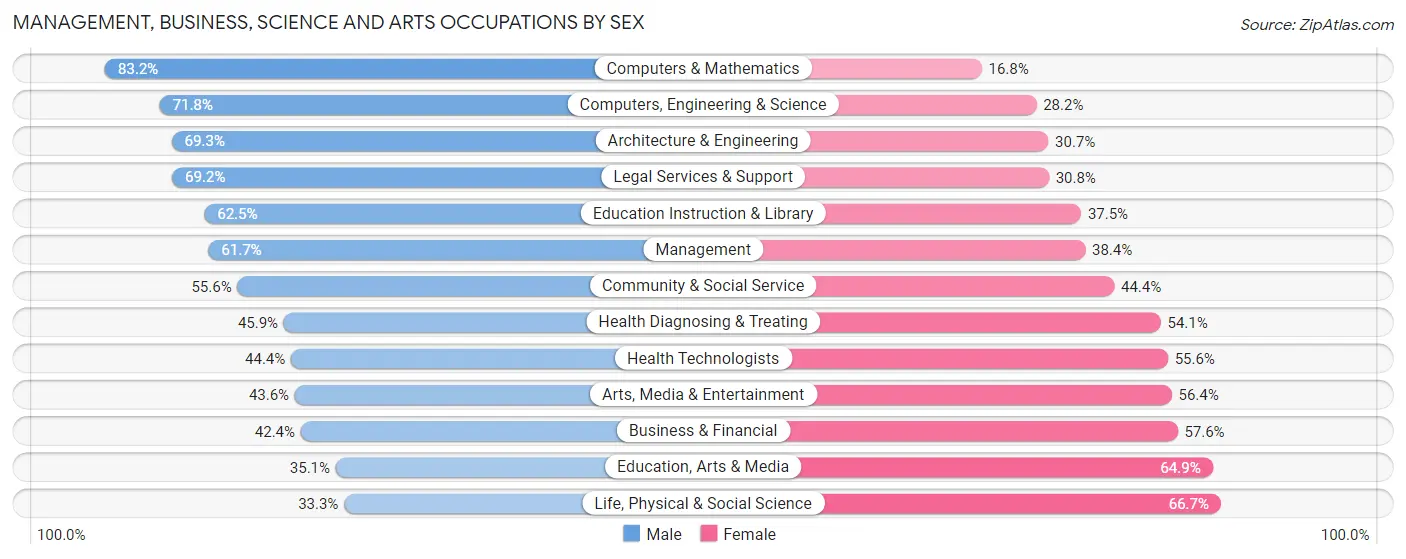
Management, Business, Science and Arts Occupations by Sex
Within the Management, Business, Science and Arts occupations in Solana Beach, the most male-oriented occupations are Computers & Mathematics (83.2%), Computers, Engineering & Science (71.8%), and Architecture & Engineering (69.3%), while the most female-oriented occupations are Life, Physical & Social Science (66.7%), Education, Arts & Media (64.9%), and Business & Financial (57.6%).
| Occupation | Male | Female |
| Management | 619 (61.7%) | 385 (38.4%) |
| Business & Financial | 272 (42.4%) | 370 (57.6%) |
| Computers, Engineering & Science | 459 (71.8%) | 180 (28.2%) |
| Computers & Mathematics | 283 (83.2%) | 57 (16.8%) |
| Architecture & Engineering | 147 (69.3%) | 65 (30.7%) |
| Life, Physical & Social Science | 29 (33.3%) | 58 (66.7%) |
| Community & Social Service | 497 (55.6%) | 397 (44.4%) |
| Education, Arts & Media | 47 (35.1%) | 87 (64.9%) |
| Legal Services & Support | 153 (69.2%) | 68 (30.8%) |
| Education Instruction & Library | 205 (62.5%) | 123 (37.5%) |
| Arts, Media & Entertainment | 92 (43.6%) | 119 (56.4%) |
| Health Diagnosing & Treating | 252 (45.9%) | 297 (54.1%) |
| Health Technologists | 206 (44.4%) | 258 (55.6%) |
| Total (Category) | 2,099 (56.3%) | 1,629 (43.7%) |
| Total (Overall) | 3,035 (50.4%) | 2,991 (49.6%) |
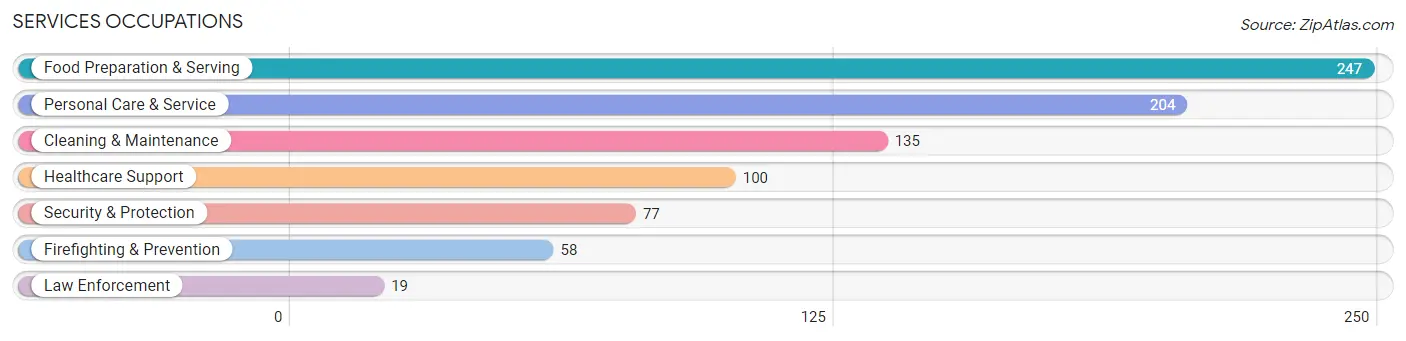
Services Occupations
The most common Services occupations in Solana Beach are Food Preparation & Serving (247 | 4.1%), Personal Care & Service (204 | 3.4%), Cleaning & Maintenance (135 | 2.2%), Healthcare Support (100 | 1.7%), and Security & Protection (77 | 1.3%).
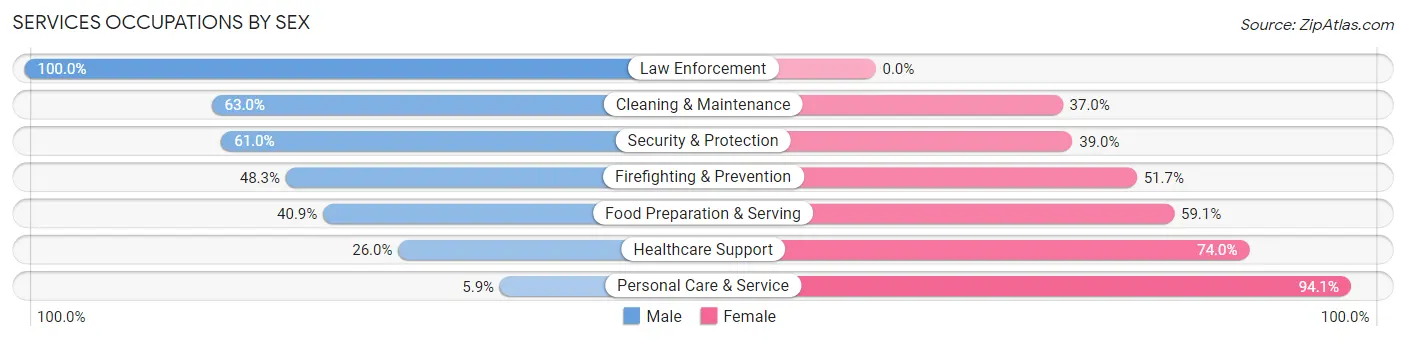
Services Occupations by Sex
Within the Services occupations in Solana Beach, the most male-oriented occupations are Law Enforcement (100.0%), Cleaning & Maintenance (63.0%), and Security & Protection (61.0%), while the most female-oriented occupations are Personal Care & Service (94.1%), Healthcare Support (74.0%), and Food Preparation & Serving (59.1%).
| Occupation | Male | Female |
| Healthcare Support | 26 (26.0%) | 74 (74.0%) |
| Security & Protection | 47 (61.0%) | 30 (39.0%) |
| Firefighting & Prevention | 28 (48.3%) | 30 (51.7%) |
| Law Enforcement | 19 (100.0%) | 0 (0.0%) |
| Food Preparation & Serving | 101 (40.9%) | 146 (59.1%) |
| Cleaning & Maintenance | 85 (63.0%) | 50 (37.0%) |
| Personal Care & Service | 12 (5.9%) | 192 (94.1%) |
| Total (Category) | 271 (35.5%) | 492 (64.5%) |
| Total (Overall) | 3,035 (50.4%) | 2,991 (49.6%) |
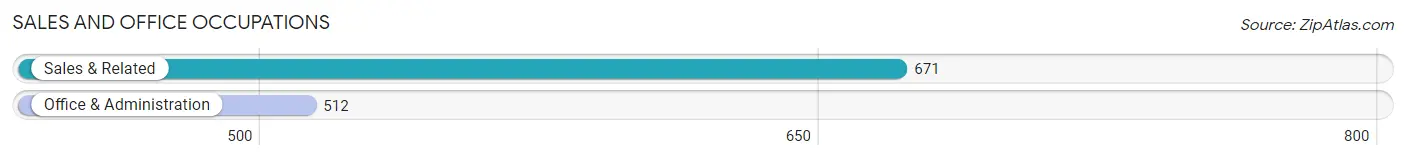
Sales and Office Occupations
The most common Sales and Office occupations in Solana Beach are Sales & Related (671 | 11.1%), and Office & Administration (512 | 8.5%).
Sales and Office Occupations by Sex
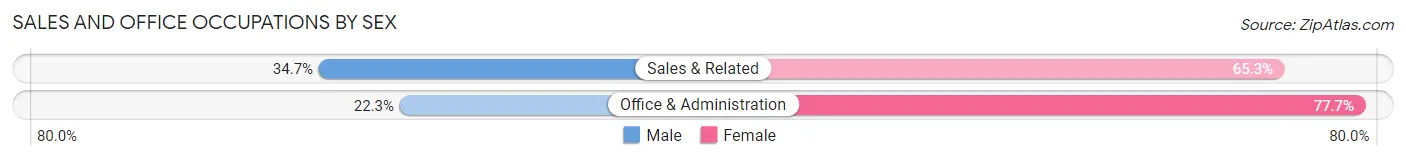
| Occupation | Male | Female |
| Sales & Related | 233 (34.7%) | 438 (65.3%) |
| Office & Administration | 114 (22.3%) | 398 (77.7%) |
| Total (Category) | 347 (29.3%) | 836 (70.7%) |
| Total (Overall) | 3,035 (50.4%) | 2,991 (49.6%) |
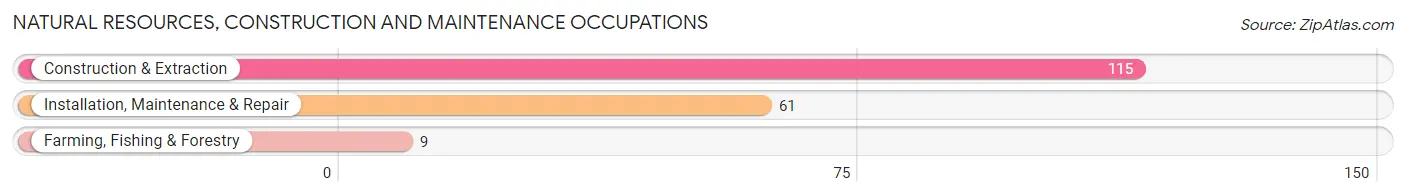
Natural Resources, Construction and Maintenance Occupations
The most common Natural Resources, Construction and Maintenance occupations in Solana Beach are Construction & Extraction (115 | 1.9%), Installation, Maintenance & Repair (61 | 1.0%), and Farming, Fishing & Forestry (9 | 0.2%).
Natural Resources, Construction and Maintenance Occupations by Sex
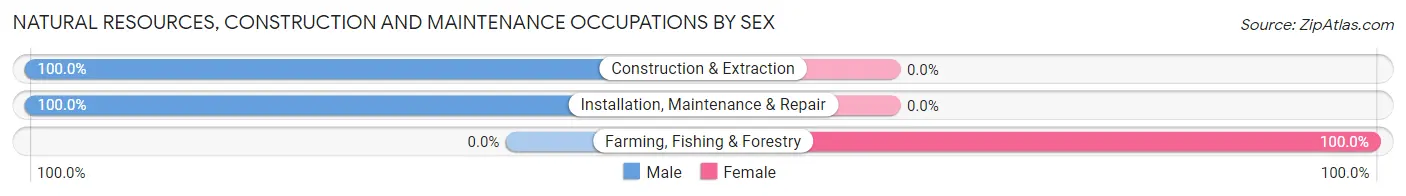
| Occupation | Male | Female |
| Farming, Fishing & Forestry | 0 (0.0%) | 9 (100.0%) |
| Construction & Extraction | 115 (100.0%) | 0 (0.0%) |
| Installation, Maintenance & Repair | 61 (100.0%) | 0 (0.0%) |
| Total (Category) | 176 (95.1%) | 9 (4.9%) |
| Total (Overall) | 3,035 (50.4%) | 2,991 (49.6%) |
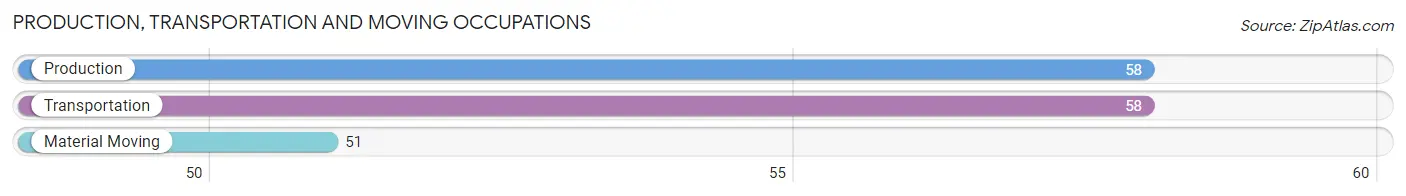
Production, Transportation and Moving Occupations
The most common Production, Transportation and Moving occupations in Solana Beach are Production (58 | 1.0%), Transportation (58 | 1.0%), and Material Moving (51 | 0.9%).
Production, Transportation and Moving Occupations by Sex
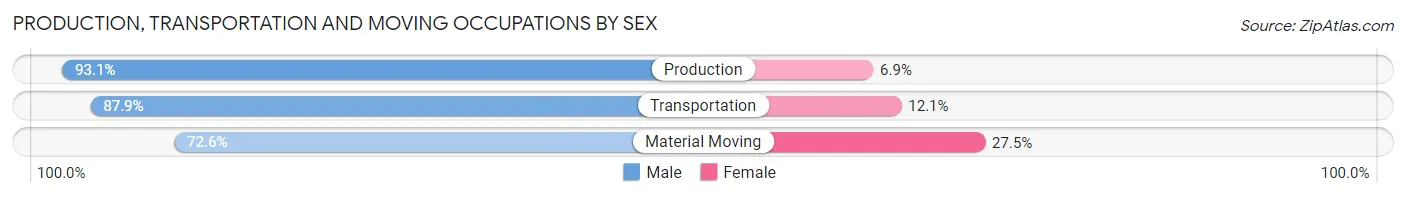
| Occupation | Male | Female |
| Production | 54 (93.1%) | 4 (6.9%) |
| Transportation | 51 (87.9%) | 7 (12.1%) |
| Material Moving | 37 (72.6%) | 14 (27.5%) |
| Total (Category) | 142 (85.0%) | 25 (15.0%) |
| Total (Overall) | 3,035 (50.4%) | 2,991 (49.6%) |
Employment Industries by Sex in Solana Beach
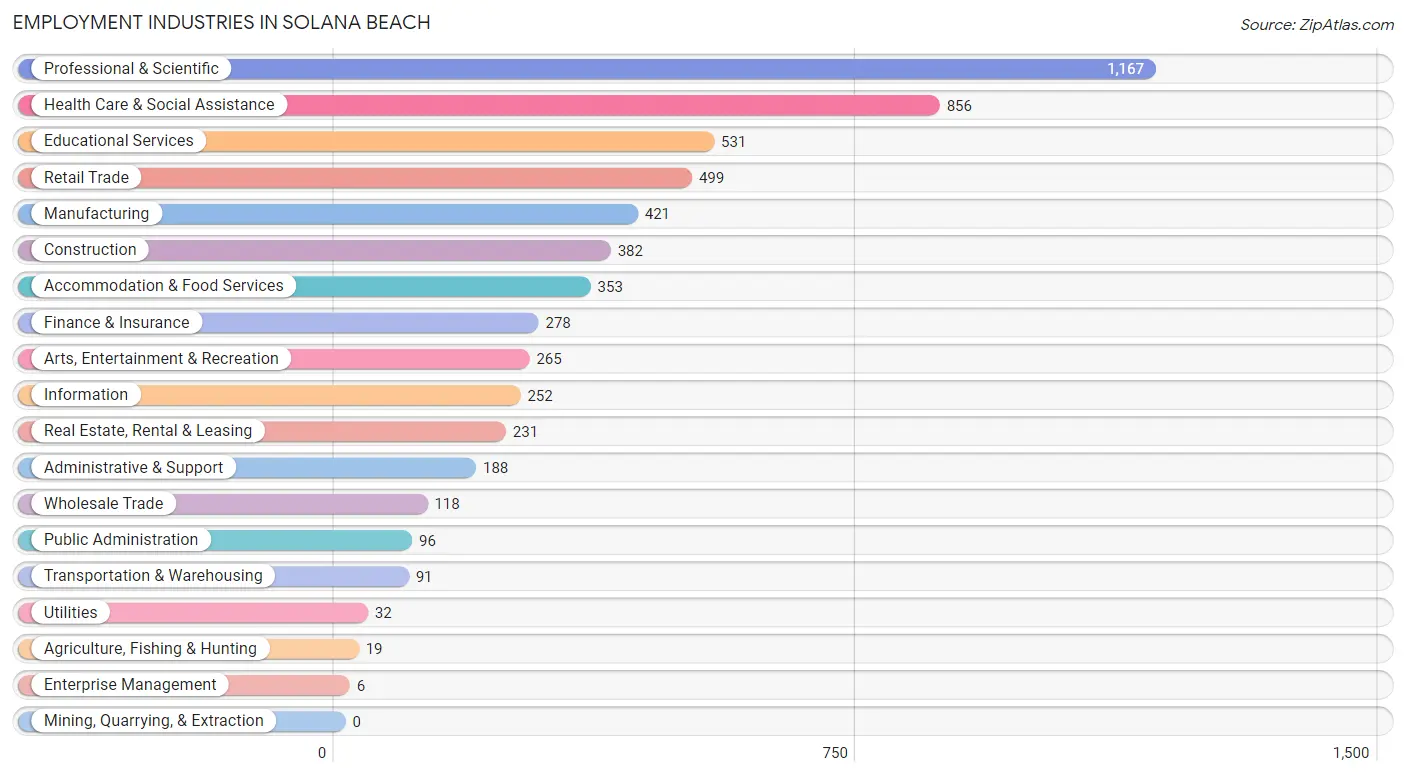
Employment Industries in Solana Beach
The major employment industries in Solana Beach include Professional & Scientific (1,167 | 19.4%), Health Care & Social Assistance (856 | 14.2%), Educational Services (531 | 8.8%), Retail Trade (499 | 8.3%), and Manufacturing (421 | 7.0%).
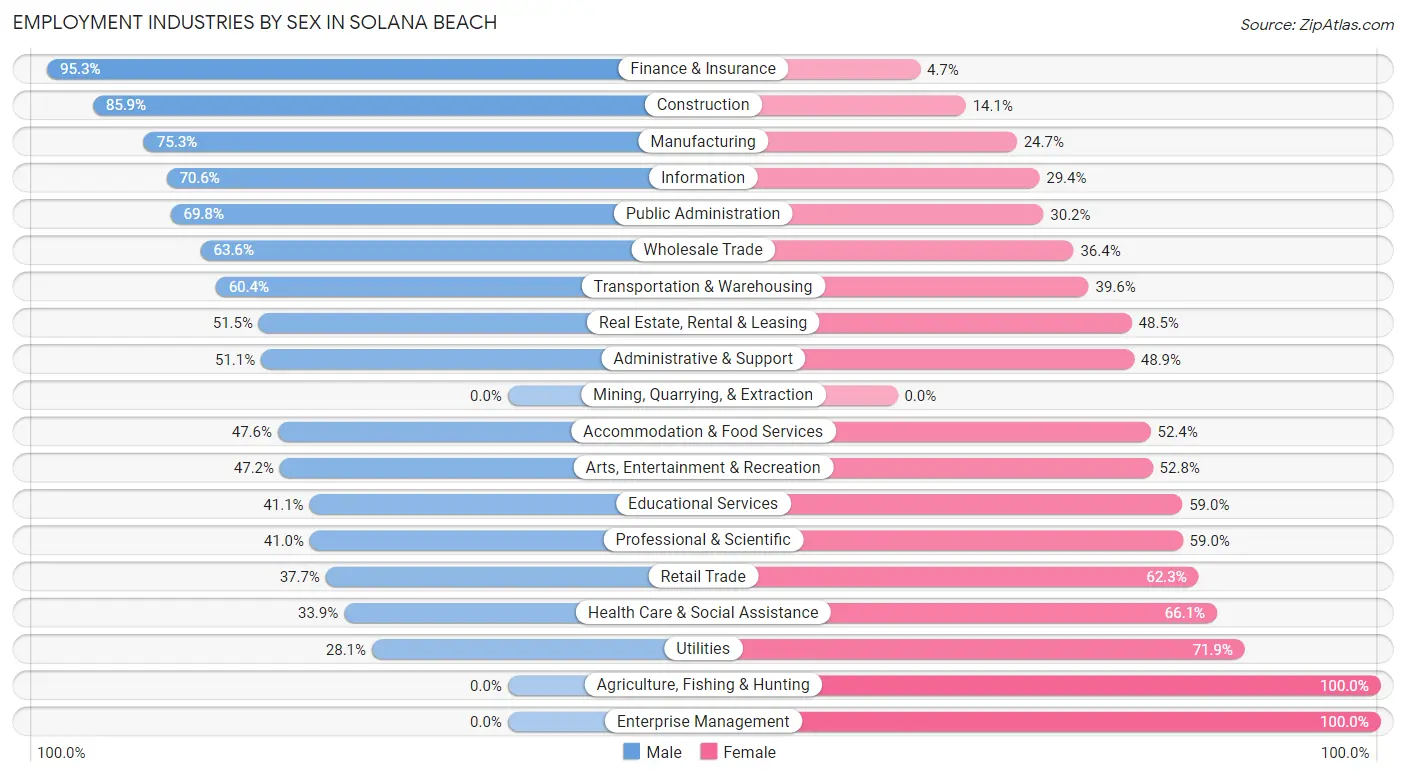
Employment Industries by Sex in Solana Beach
The Solana Beach industries that see more men than women are Finance & Insurance (95.3%), Construction (85.9%), and Manufacturing (75.3%), whereas the industries that tend to have a higher number of women are Agriculture, Fishing & Hunting (100.0%), Enterprise Management (100.0%), and Utilities (71.9%).
| Industry | Male | Female |
| Agriculture, Fishing & Hunting | 0 (0.0%) | 19 (100.0%) |
| Mining, Quarrying, & Extraction | 0 (0.0%) | 0 (0.0%) |
| Construction | 328 (85.9%) | 54 (14.1%) |
| Manufacturing | 317 (75.3%) | 104 (24.7%) |
| Wholesale Trade | 75 (63.6%) | 43 (36.4%) |
| Retail Trade | 188 (37.7%) | 311 (62.3%) |
| Transportation & Warehousing | 55 (60.4%) | 36 (39.6%) |
| Utilities | 9 (28.1%) | 23 (71.9%) |
| Information | 178 (70.6%) | 74 (29.4%) |
| Finance & Insurance | 265 (95.3%) | 13 (4.7%) |
| Real Estate, Rental & Leasing | 119 (51.5%) | 112 (48.5%) |
| Professional & Scientific | 478 (41.0%) | 689 (59.0%) |
| Enterprise Management | 0 (0.0%) | 6 (100.0%) |
| Administrative & Support | 96 (51.1%) | 92 (48.9%) |
| Educational Services | 218 (41.0%) | 313 (59.0%) |
| Health Care & Social Assistance | 290 (33.9%) | 566 (66.1%) |
| Arts, Entertainment & Recreation | 125 (47.2%) | 140 (52.8%) |
| Accommodation & Food Services | 168 (47.6%) | 185 (52.4%) |
| Public Administration | 67 (69.8%) | 29 (30.2%) |
| Total | 3,035 (50.4%) | 2,991 (49.6%) |
Education in Solana Beach
School Enrollment in Solana Beach
The most common levels of schooling among the 2,573 students in Solana Beach are high school (670 | 26.0%), middle school (629 | 24.4%), and elementary school (502 | 19.5%).
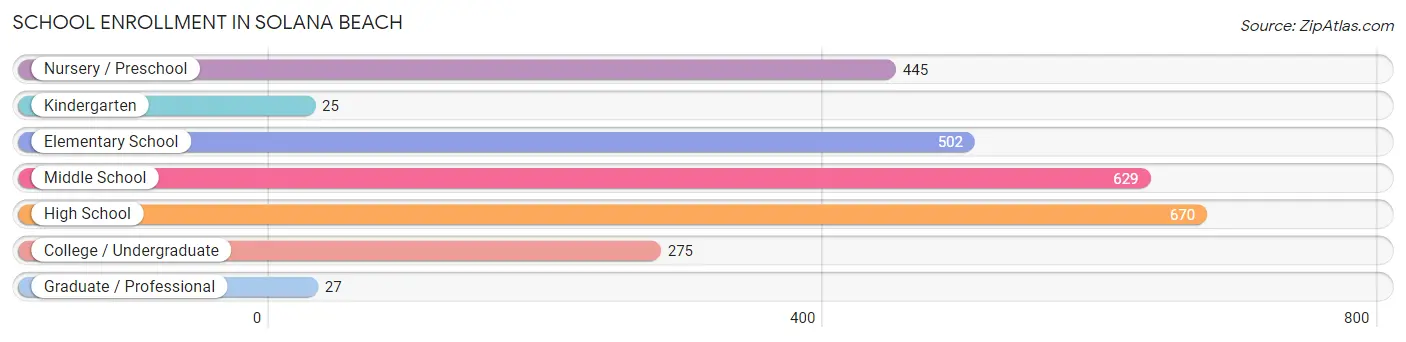
| School Level | # Students | % Students |
| Nursery / Preschool | 445 | 17.3% |
| Kindergarten | 25 | 1.0% |
| Elementary School | 502 | 19.5% |
| Middle School | 629 | 24.4% |
| High School | 670 | 26.0% |
| College / Undergraduate | 275 | 10.7% |
| Graduate / Professional | 27 | 1.1% |
| Total | 2,573 | 100.0% |
School Enrollment by Age by Funding Source in Solana Beach
Out of a total of 2,573 students who are enrolled in schools in Solana Beach, 612 (23.8%) attend a private institution, while the remaining 1,961 (76.2%) are enrolled in public schools. The age group of 3 to 4 year olds has the highest likelihood of being enrolled in private schools, with 169 (72.5% in the age bracket) enrolled. Conversely, the age group of 10 to 14 year olds has the lowest likelihood of being enrolled in a private school, with 683 (91.8% in the age bracket) attending a public institution.
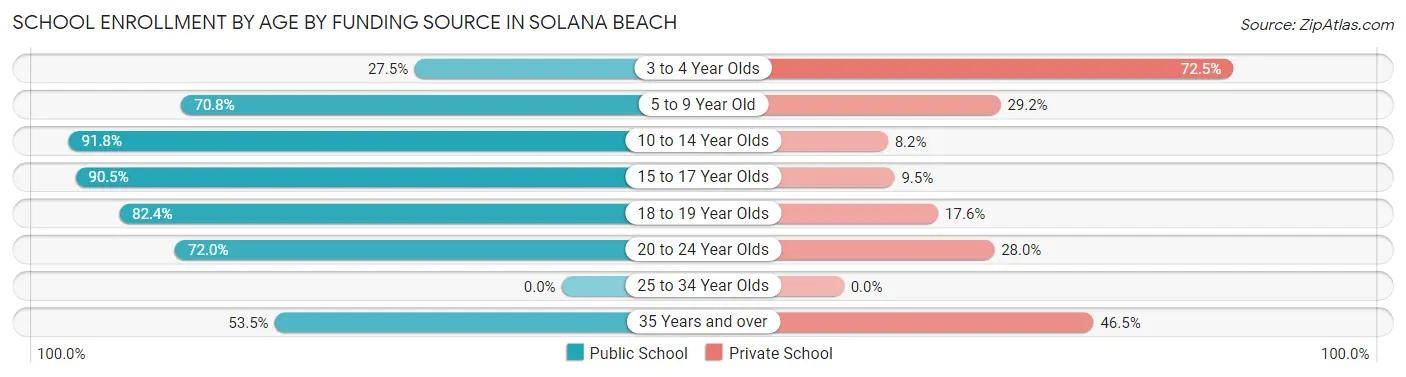
| Age Bracket | Public School | Private School |
| 3 to 4 Year Olds | 64 (27.5%) | 169 (72.5%) |
| 5 to 9 Year Old | 519 (70.8%) | 214 (29.2%) |
| 10 to 14 Year Olds | 683 (91.8%) | 61 (8.2%) |
| 15 to 17 Year Olds | 383 (90.5%) | 40 (9.5%) |
| 18 to 19 Year Olds | 103 (82.4%) | 22 (17.6%) |
| 20 to 24 Year Olds | 154 (72.0%) | 60 (28.0%) |
| 25 to 34 Year Olds | 0 (0.0%) | 0 (0.0%) |
| 35 Years and over | 54 (53.5%) | 47 (46.5%) |
| Total | 1,961 (76.2%) | 612 (23.8%) |
Educational Attainment by Field of Study in Solana Beach
Business (1,228 | 16.6%), bio, nature & agricultural (879 | 11.9%), social sciences (843 | 11.4%), engineering (788 | 10.6%), and psychology (520 | 7.0%) are the most common fields of study among 7,412 individuals in Solana Beach who have obtained a bachelor's degree or higher.
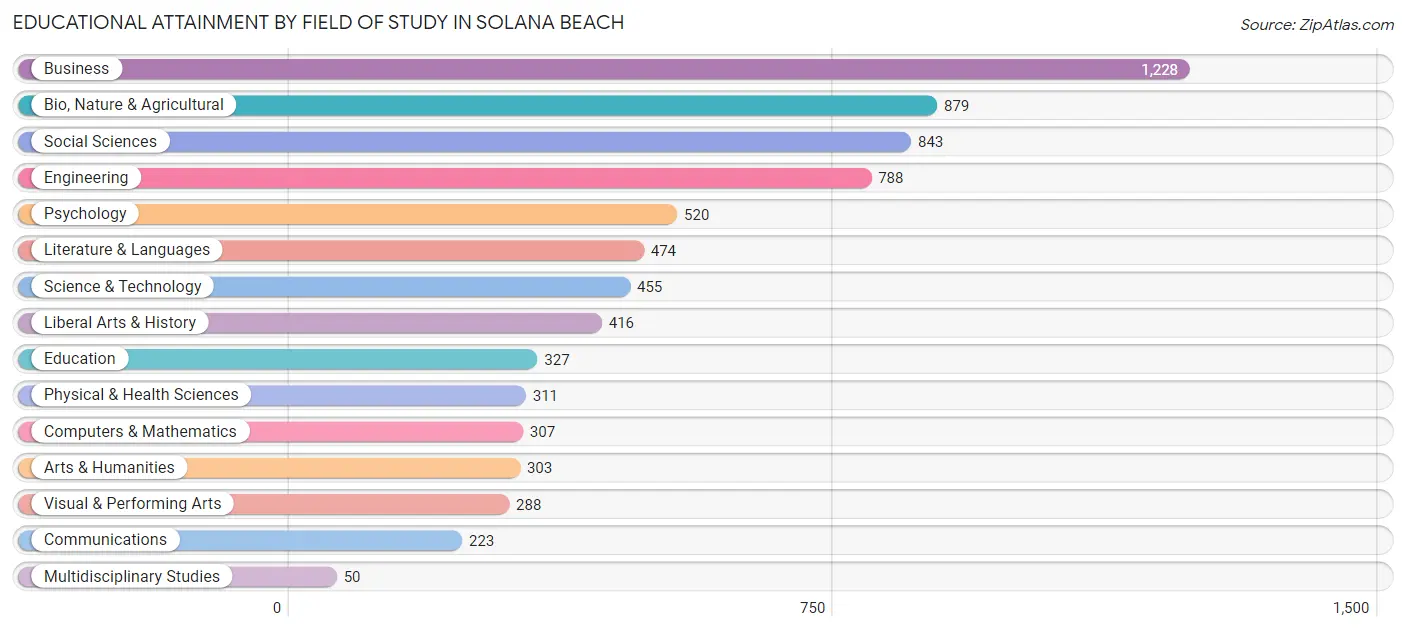
| Field of Study | # Graduates | % Graduates |
| Computers & Mathematics | 307 | 4.1% |
| Bio, Nature & Agricultural | 879 | 11.9% |
| Physical & Health Sciences | 311 | 4.2% |
| Psychology | 520 | 7.0% |
| Social Sciences | 843 | 11.4% |
| Engineering | 788 | 10.6% |
| Multidisciplinary Studies | 50 | 0.7% |
| Science & Technology | 455 | 6.1% |
| Business | 1,228 | 16.6% |
| Education | 327 | 4.4% |
| Literature & Languages | 474 | 6.4% |
| Liberal Arts & History | 416 | 5.6% |
| Visual & Performing Arts | 288 | 3.9% |
| Communications | 223 | 3.0% |
| Arts & Humanities | 303 | 4.1% |
| Total | 7,412 | 100.0% |
Transportation & Commute in Solana Beach
Vehicle Availability by Sex in Solana Beach
The most prevalent vehicle ownership categories in Solana Beach are males with 2 vehicles (1,513, accounting for 50.7%) and females with 2 vehicles (1,092, making up 52.8%).
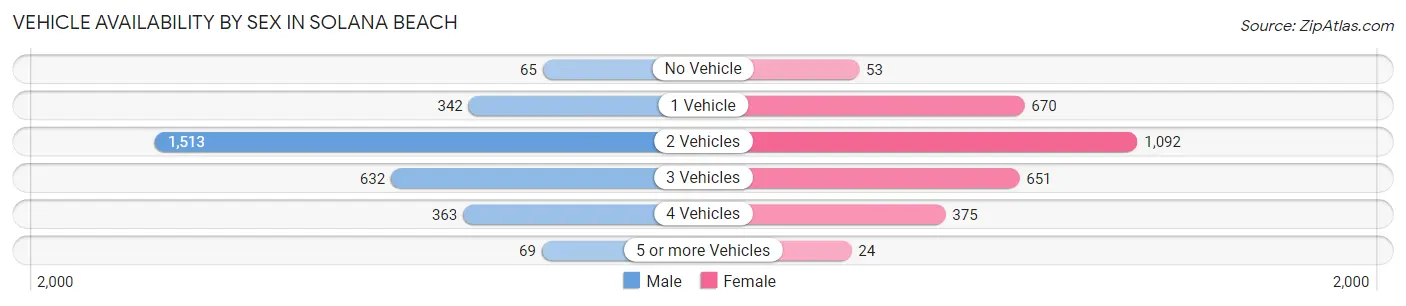
| Vehicles Available | Male | Female |
| No Vehicle | 65 (2.2%) | 53 (1.8%) |
| 1 Vehicle | 342 (11.5%) | 670 (23.4%) |
| 2 Vehicles | 1,513 (50.7%) | 1,092 (38.1%) |
| 3 Vehicles | 632 (21.2%) | 651 (22.7%) |
| 4 Vehicles | 363 (12.2%) | 375 (13.1%) |
| 5 or more Vehicles | 69 (2.3%) | 24 (0.8%) |
| Total | 2,984 (100.0%) | 2,865 (100.0%) |
Commute Time in Solana Beach
The most frequently occuring commute durations in Solana Beach are 20 to 24 minutes (708 commuters, 16.7%), 10 to 14 minutes (639 commuters, 15.1%), and 5 to 9 minutes (635 commuters, 15.0%).
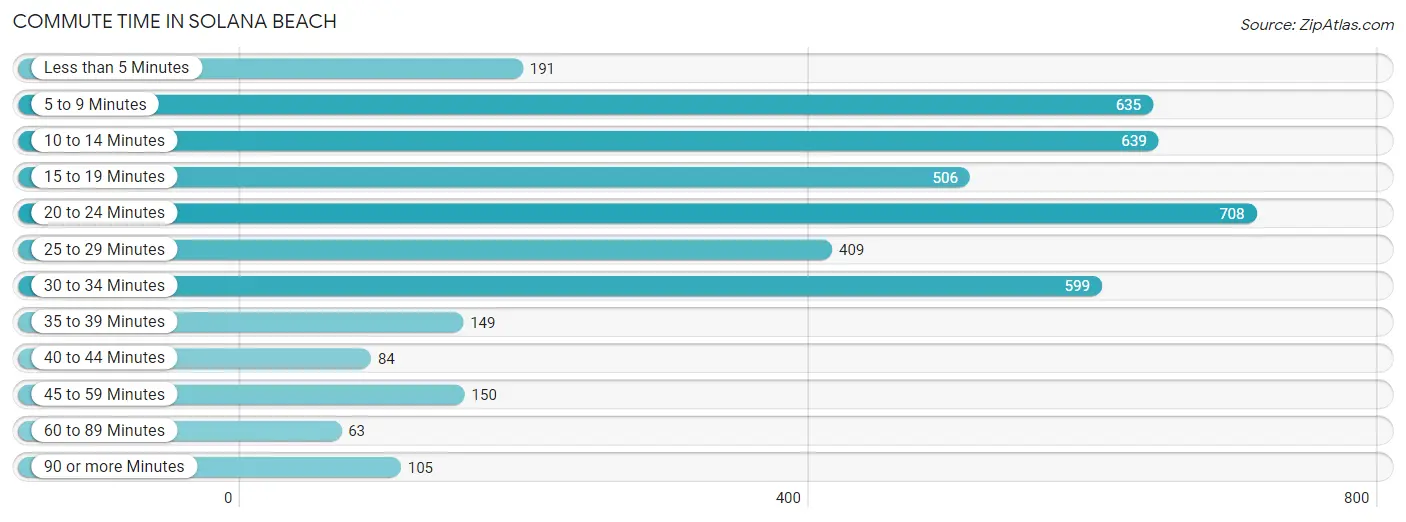
| Commute Time | # Commuters | % Commuters |
| Less than 5 Minutes | 191 | 4.5% |
| 5 to 9 Minutes | 635 | 15.0% |
| 10 to 14 Minutes | 639 | 15.1% |
| 15 to 19 Minutes | 506 | 11.9% |
| 20 to 24 Minutes | 708 | 16.7% |
| 25 to 29 Minutes | 409 | 9.7% |
| 30 to 34 Minutes | 599 | 14.1% |
| 35 to 39 Minutes | 149 | 3.5% |
| 40 to 44 Minutes | 84 | 2.0% |
| 45 to 59 Minutes | 150 | 3.5% |
| 60 to 89 Minutes | 63 | 1.5% |
| 90 or more Minutes | 105 | 2.5% |
Commute Time by Sex in Solana Beach
The most common commute times in Solana Beach are 20 to 24 minutes (404 commuters, 18.5%) for males and 10 to 14 minutes (400 commuters, 19.5%) for females.
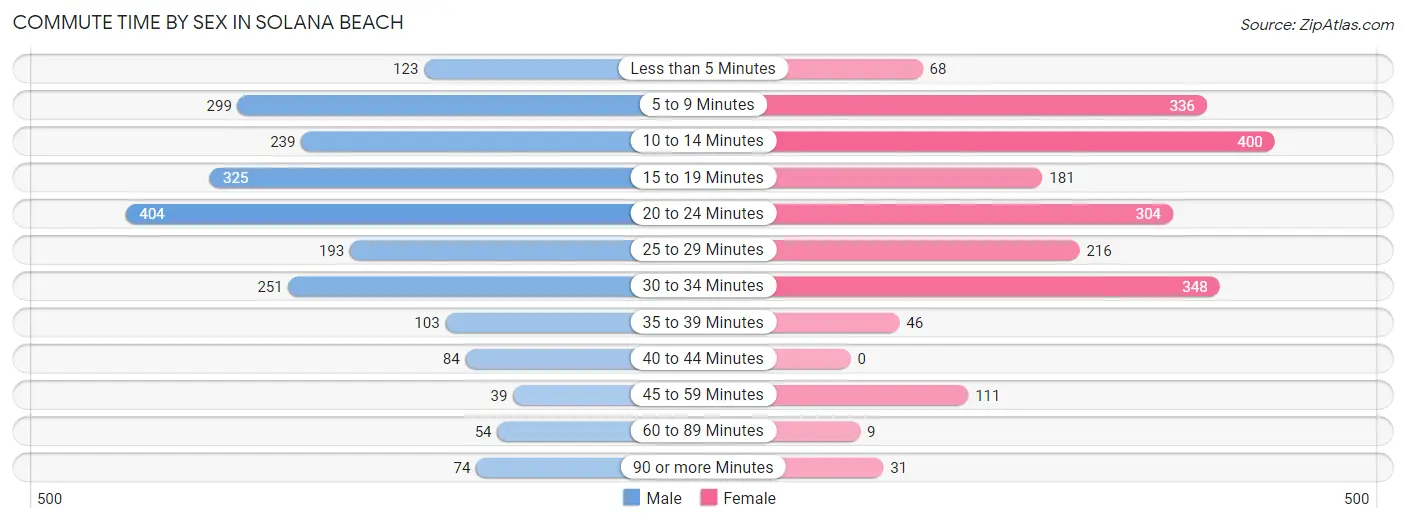
| Commute Time | Male | Female |
| Less than 5 Minutes | 123 (5.6%) | 68 (3.3%) |
| 5 to 9 Minutes | 299 (13.7%) | 336 (16.4%) |
| 10 to 14 Minutes | 239 (10.9%) | 400 (19.5%) |
| 15 to 19 Minutes | 325 (14.8%) | 181 (8.8%) |
| 20 to 24 Minutes | 404 (18.5%) | 304 (14.8%) |
| 25 to 29 Minutes | 193 (8.8%) | 216 (10.5%) |
| 30 to 34 Minutes | 251 (11.5%) | 348 (17.0%) |
| 35 to 39 Minutes | 103 (4.7%) | 46 (2.2%) |
| 40 to 44 Minutes | 84 (3.8%) | 0 (0.0%) |
| 45 to 59 Minutes | 39 (1.8%) | 111 (5.4%) |
| 60 to 89 Minutes | 54 (2.5%) | 9 (0.4%) |
| 90 or more Minutes | 74 (3.4%) | 31 (1.5%) |
Time of Departure to Work by Sex in Solana Beach
The most frequent times of departure to work in Solana Beach are 7:30 AM to 7:59 AM (567, 25.9%) for males and 8:00 AM to 8:29 AM (501, 24.4%) for females.
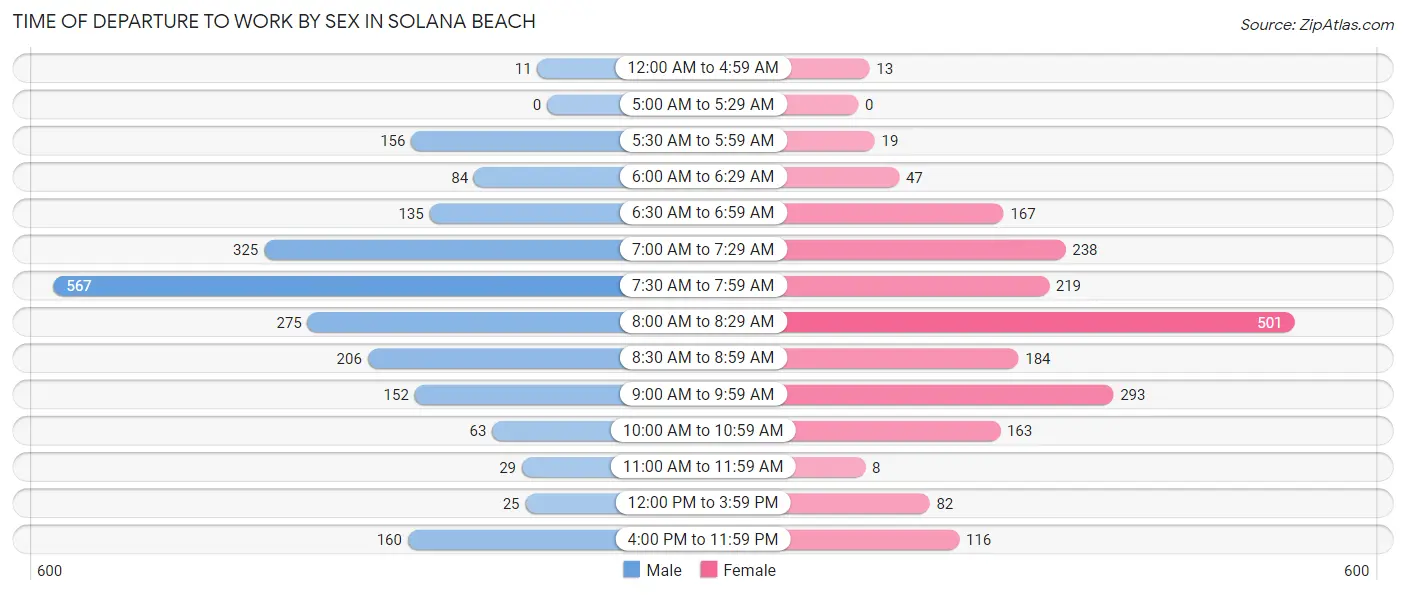
| Time of Departure | Male | Female |
| 12:00 AM to 4:59 AM | 11 (0.5%) | 13 (0.6%) |
| 5:00 AM to 5:29 AM | 0 (0.0%) | 0 (0.0%) |
| 5:30 AM to 5:59 AM | 156 (7.1%) | 19 (0.9%) |
| 6:00 AM to 6:29 AM | 84 (3.8%) | 47 (2.3%) |
| 6:30 AM to 6:59 AM | 135 (6.2%) | 167 (8.2%) |
| 7:00 AM to 7:29 AM | 325 (14.8%) | 238 (11.6%) |
| 7:30 AM to 7:59 AM | 567 (25.9%) | 219 (10.7%) |
| 8:00 AM to 8:29 AM | 275 (12.6%) | 501 (24.4%) |
| 8:30 AM to 8:59 AM | 206 (9.4%) | 184 (9.0%) |
| 9:00 AM to 9:59 AM | 152 (7.0%) | 293 (14.3%) |
| 10:00 AM to 10:59 AM | 63 (2.9%) | 163 (8.0%) |
| 11:00 AM to 11:59 AM | 29 (1.3%) | 8 (0.4%) |
| 12:00 PM to 3:59 PM | 25 (1.1%) | 82 (4.0%) |
| 4:00 PM to 11:59 PM | 160 (7.3%) | 116 (5.7%) |
| Total | 2,188 (100.0%) | 2,050 (100.0%) |
Housing Occupancy in Solana Beach
Occupancy by Ownership in Solana Beach
Of the total 5,436 dwellings in Solana Beach, owner-occupied units account for 3,625 (66.7%), while renter-occupied units make up 1,811 (33.3%).
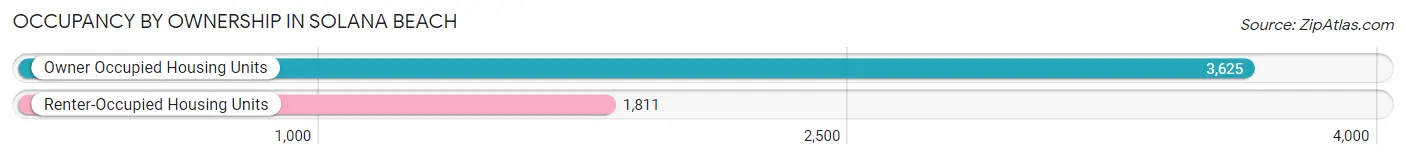
| Occupancy | # Housing Units | % Housing Units |
| Owner Occupied Housing Units | 3,625 | 66.7% |
| Renter-Occupied Housing Units | 1,811 | 33.3% |
| Total Occupied Housing Units | 5,436 | 100.0% |
Occupancy by Household Size in Solana Beach
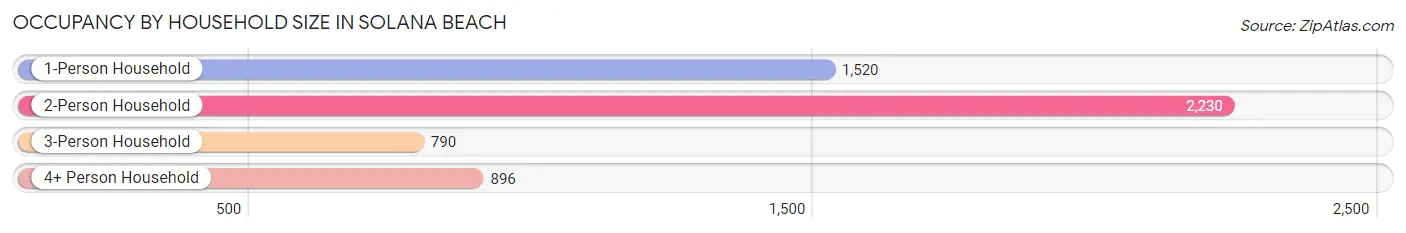
| Household Size | # Housing Units | % Housing Units |
| 1-Person Household | 1,520 | 28.0% |
| 2-Person Household | 2,230 | 41.0% |
| 3-Person Household | 790 | 14.5% |
| 4+ Person Household | 896 | 16.5% |
| Total Housing Units | 5,436 | 100.0% |
Occupancy by Ownership by Household Size in Solana Beach
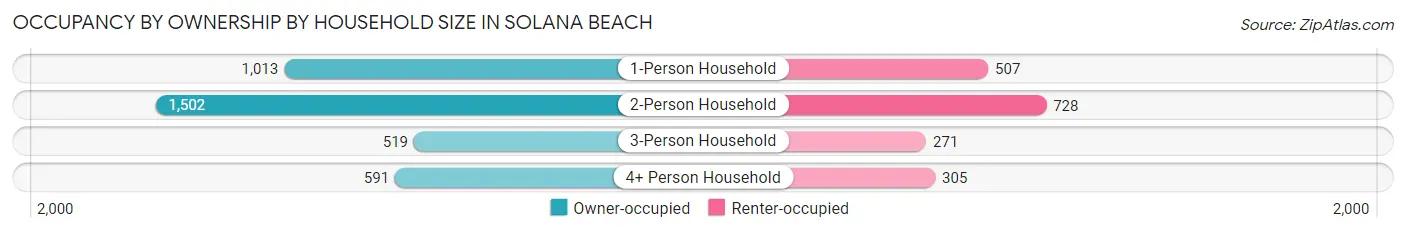
| Household Size | Owner-occupied | Renter-occupied |
| 1-Person Household | 1,013 (66.6%) | 507 (33.4%) |
| 2-Person Household | 1,502 (67.3%) | 728 (32.7%) |
| 3-Person Household | 519 (65.7%) | 271 (34.3%) |
| 4+ Person Household | 591 (66.0%) | 305 (34.0%) |
| Total Housing Units | 3,625 (66.7%) | 1,811 (33.3%) |
Occupancy by Educational Attainment in Solana Beach
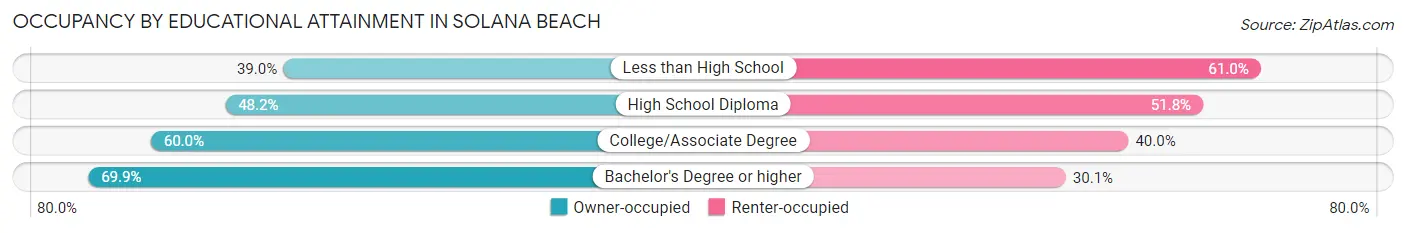
| Household Size | Owner-occupied | Renter-occupied |
| Less than High School | 32 (39.0%) | 50 (61.0%) |
| High School Diploma | 146 (48.2%) | 157 (51.8%) |
| College/Associate Degree | 508 (60.0%) | 339 (40.0%) |
| Bachelor's Degree or higher | 2,939 (69.9%) | 1,265 (30.1%) |
Occupancy by Age of Householder in Solana Beach
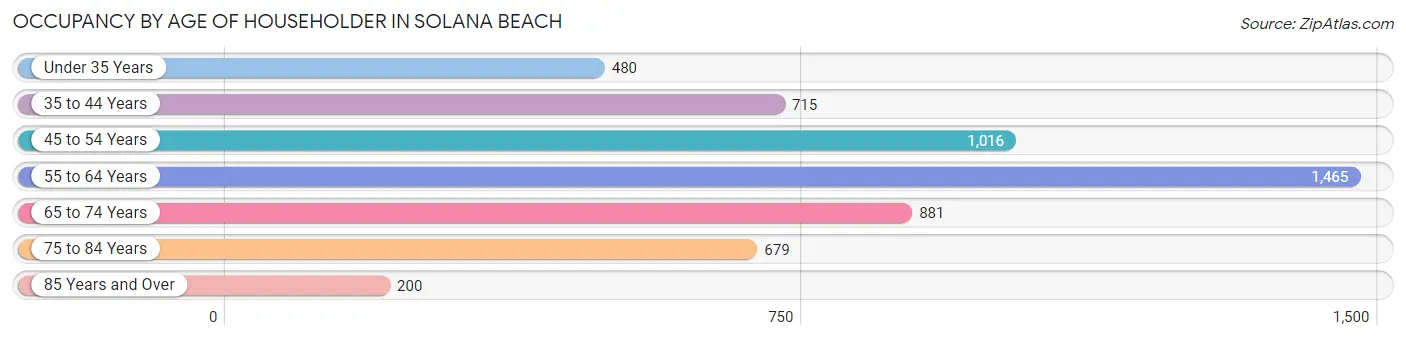
| Age Bracket | # Households | % Households |
| Under 35 Years | 480 | 8.8% |
| 35 to 44 Years | 715 | 13.2% |
| 45 to 54 Years | 1,016 | 18.7% |
| 55 to 64 Years | 1,465 | 27.0% |
| 65 to 74 Years | 881 | 16.2% |
| 75 to 84 Years | 679 | 12.5% |
| 85 Years and Over | 200 | 3.7% |
| Total | 5,436 | 100.0% |
Housing Finances in Solana Beach
Median Income by Occupancy in Solana Beach
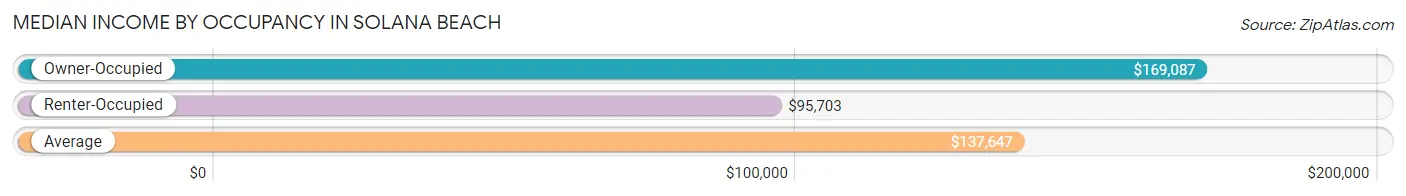
| Occupancy Type | # Households | Median Income |
| Owner-Occupied | 3,625 (66.7%) | $169,087 |
| Renter-Occupied | 1,811 (33.3%) | $95,703 |
| Average | 5,436 (100.0%) | $137,647 |
Occupancy by Householder Income Bracket in Solana Beach
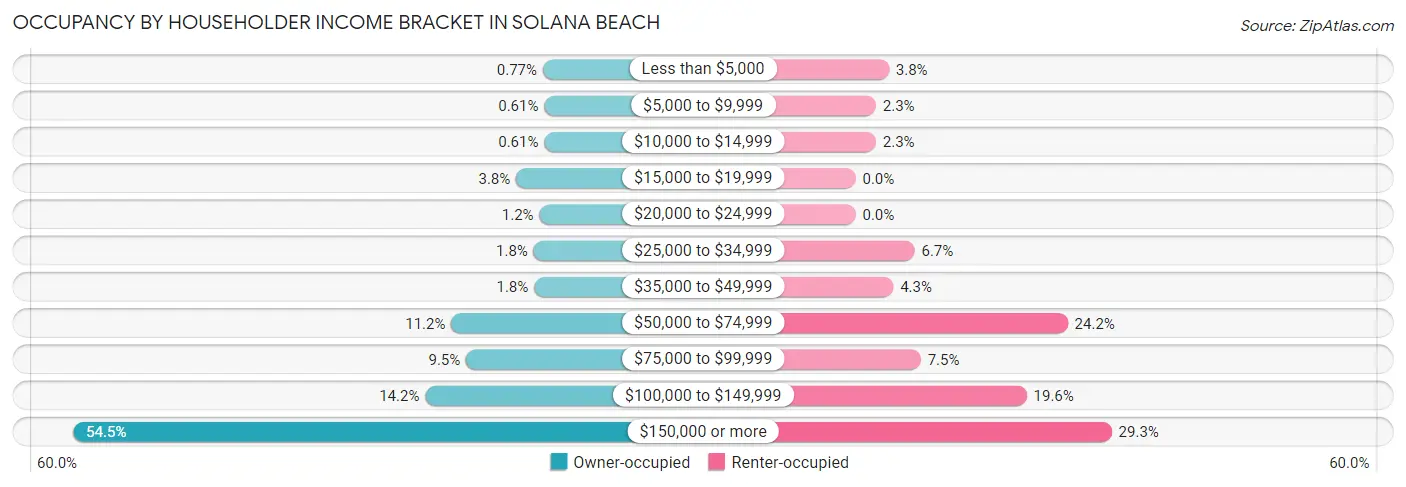
| Income Bracket | Owner-occupied | Renter-occupied |
| Less than $5,000 | 28 (0.8%) | 69 (3.8%) |
| $5,000 to $9,999 | 22 (0.6%) | 42 (2.3%) |
| $10,000 to $14,999 | 22 (0.6%) | 42 (2.3%) |
| $15,000 to $19,999 | 139 (3.8%) | 0 (0.0%) |
| $20,000 to $24,999 | 42 (1.2%) | 0 (0.0%) |
| $25,000 to $34,999 | 66 (1.8%) | 122 (6.7%) |
| $35,000 to $49,999 | 64 (1.8%) | 78 (4.3%) |
| $50,000 to $74,999 | 407 (11.2%) | 439 (24.2%) |
| $75,000 to $99,999 | 346 (9.5%) | 135 (7.4%) |
| $100,000 to $149,999 | 515 (14.2%) | 354 (19.6%) |
| $150,000 or more | 1,974 (54.5%) | 530 (29.3%) |
| Total | 3,625 (100.0%) | 1,811 (100.0%) |
Monthly Housing Cost Tiers in Solana Beach
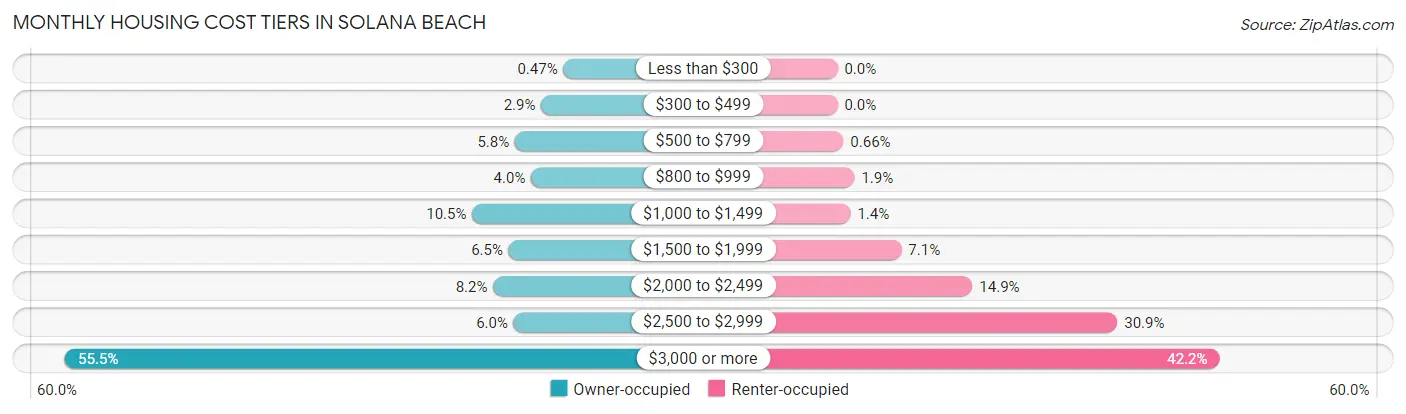
| Monthly Cost | Owner-occupied | Renter-occupied |
| Less than $300 | 17 (0.5%) | 0 (0.0%) |
| $300 to $499 | 106 (2.9%) | 0 (0.0%) |
| $500 to $799 | 211 (5.8%) | 12 (0.7%) |
| $800 to $999 | 146 (4.0%) | 34 (1.9%) |
| $1,000 to $1,499 | 382 (10.5%) | 26 (1.4%) |
| $1,500 to $1,999 | 236 (6.5%) | 128 (7.1%) |
| $2,000 to $2,499 | 298 (8.2%) | 270 (14.9%) |
| $2,500 to $2,999 | 216 (6.0%) | 560 (30.9%) |
| $3,000 or more | 2,013 (55.5%) | 764 (42.2%) |
| Total | 3,625 (100.0%) | 1,811 (100.0%) |
Physical Housing Characteristics in Solana Beach
Housing Structures in Solana Beach
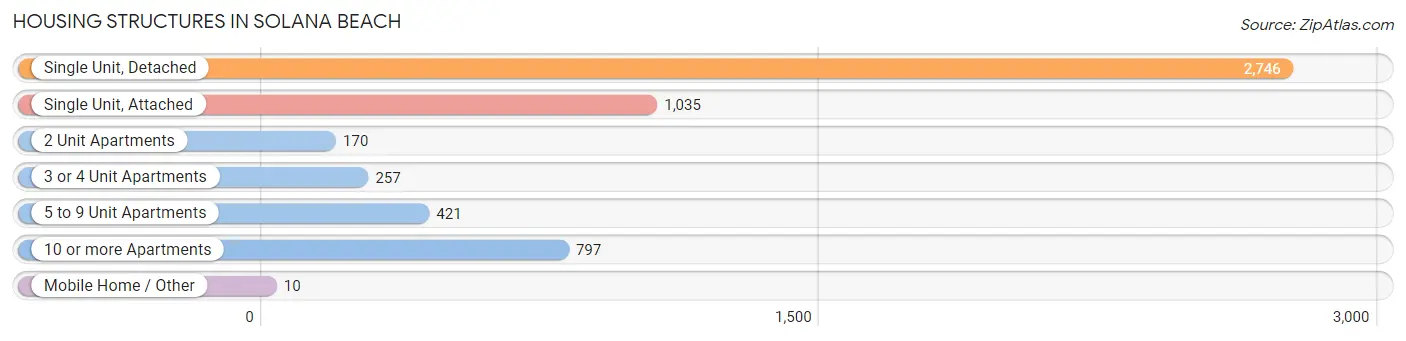
| Structure Type | # Housing Units | % Housing Units |
| Single Unit, Detached | 2,746 | 50.5% |
| Single Unit, Attached | 1,035 | 19.0% |
| 2 Unit Apartments | 170 | 3.1% |
| 3 or 4 Unit Apartments | 257 | 4.7% |
| 5 to 9 Unit Apartments | 421 | 7.7% |
| 10 or more Apartments | 797 | 14.7% |
| Mobile Home / Other | 10 | 0.2% |
| Total | 5,436 | 100.0% |
Housing Structures by Occupancy in Solana Beach
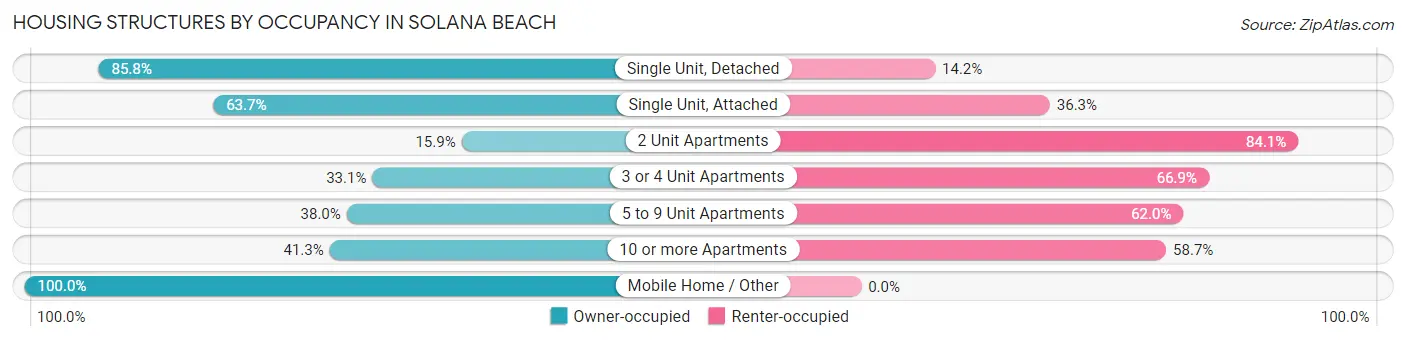
| Structure Type | Owner-occupied | Renter-occupied |
| Single Unit, Detached | 2,355 (85.8%) | 391 (14.2%) |
| Single Unit, Attached | 659 (63.7%) | 376 (36.3%) |
| 2 Unit Apartments | 27 (15.9%) | 143 (84.1%) |
| 3 or 4 Unit Apartments | 85 (33.1%) | 172 (66.9%) |
| 5 to 9 Unit Apartments | 160 (38.0%) | 261 (62.0%) |
| 10 or more Apartments | 329 (41.3%) | 468 (58.7%) |
| Mobile Home / Other | 10 (100.0%) | 0 (0.0%) |
| Total | 3,625 (66.7%) | 1,811 (33.3%) |
Housing Structures by Number of Rooms in Solana Beach
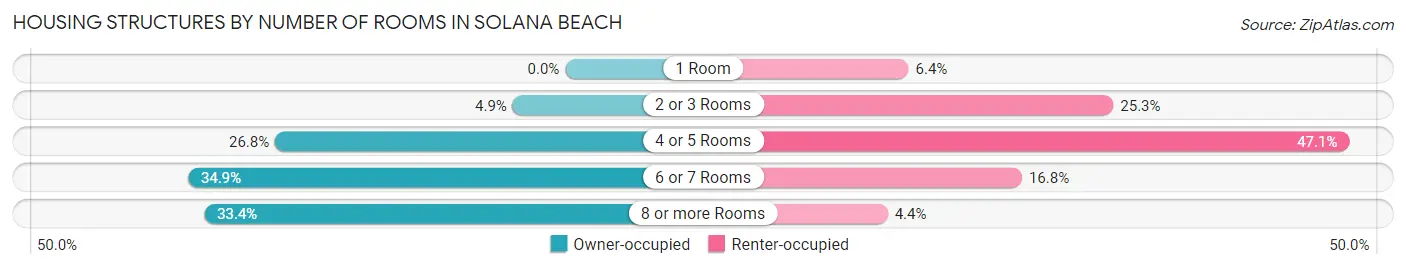
| Number of Rooms | Owner-occupied | Renter-occupied |
| 1 Room | 0 (0.0%) | 115 (6.4%) |
| 2 or 3 Rooms | 176 (4.9%) | 458 (25.3%) |
| 4 or 5 Rooms | 973 (26.8%) | 853 (47.1%) |
| 6 or 7 Rooms | 1,265 (34.9%) | 305 (16.8%) |
| 8 or more Rooms | 1,211 (33.4%) | 80 (4.4%) |
| Total | 3,625 (100.0%) | 1,811 (100.0%) |
Housing Structure by Heating Type in Solana Beach
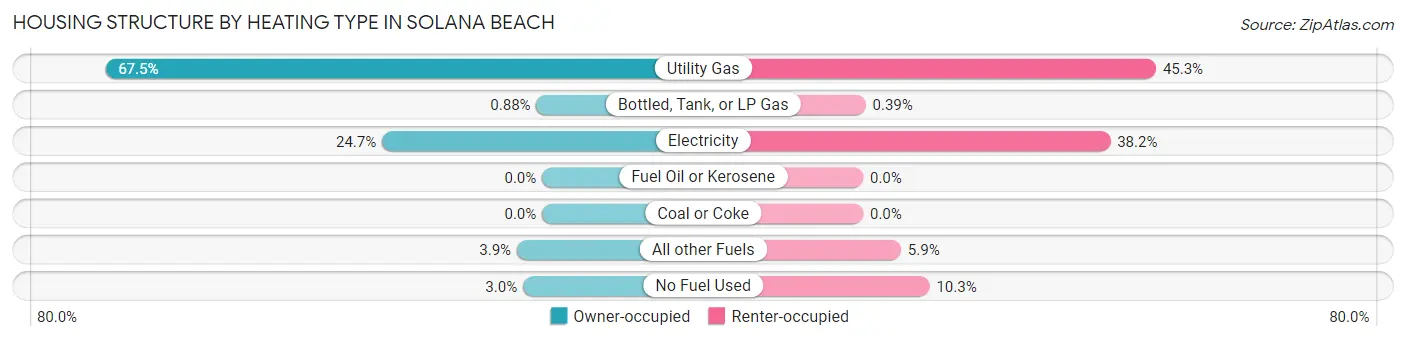
| Heating Type | Owner-occupied | Renter-occupied |
| Utility Gas | 2,448 (67.5%) | 820 (45.3%) |
| Bottled, Tank, or LP Gas | 32 (0.9%) | 7 (0.4%) |
| Electricity | 897 (24.7%) | 692 (38.2%) |
| Fuel Oil or Kerosene | 0 (0.0%) | 0 (0.0%) |
| Coal or Coke | 0 (0.0%) | 0 (0.0%) |
| All other Fuels | 141 (3.9%) | 106 (5.9%) |
| No Fuel Used | 107 (2.9%) | 186 (10.3%) |
| Total | 3,625 (100.0%) | 1,811 (100.0%) |
Household Vehicle Usage in Solana Beach
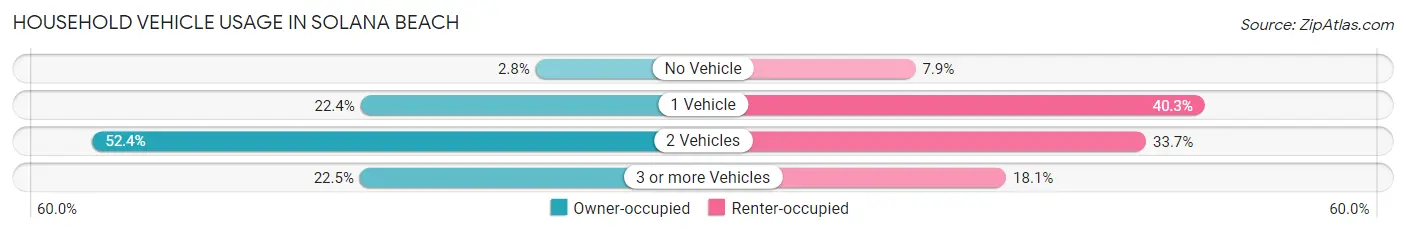
| Vehicles per Household | Owner-occupied | Renter-occupied |
| No Vehicle | 100 (2.8%) | 143 (7.9%) |
| 1 Vehicle | 811 (22.4%) | 730 (40.3%) |
| 2 Vehicles | 1,900 (52.4%) | 611 (33.7%) |
| 3 or more Vehicles | 814 (22.5%) | 327 (18.1%) |
| Total | 3,625 (100.0%) | 1,811 (100.0%) |
Real Estate & Mortgages in Solana Beach
Real Estate and Mortgage Overview in Solana Beach
| Characteristic | Without Mortgage | With Mortgage |
| Housing Units | 1,379 | 2,246 |
| Median Property Value | $1,556,600 | $1,657,500 |
| Median Household Income | $104,844 | $1,531 |
| Monthly Housing Costs | $1,303 | $1,825 |
| Real Estate Taxes | $8,938 | $0 |
Property Value by Mortgage Status in Solana Beach
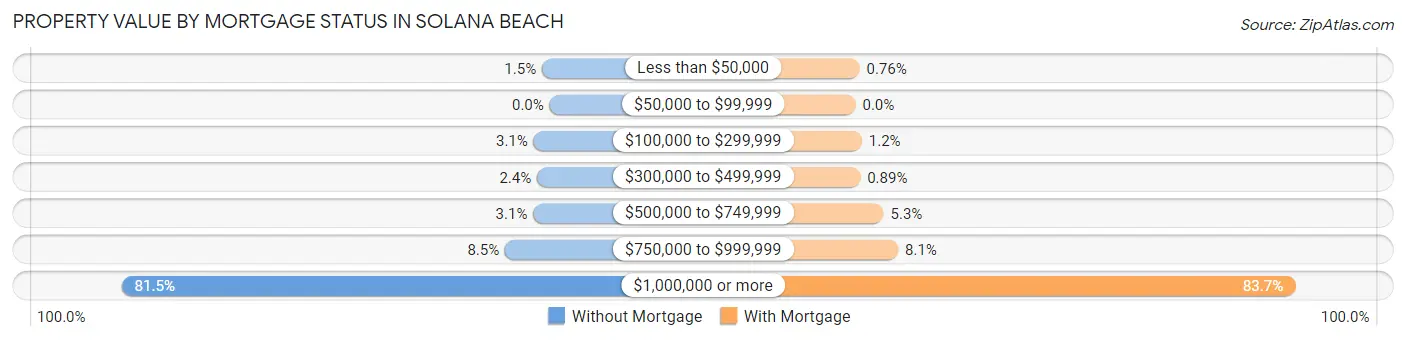
| Property Value | Without Mortgage | With Mortgage |
| Less than $50,000 | 20 (1.5%) | 17 (0.8%) |
| $50,000 to $99,999 | 0 (0.0%) | 0 (0.0%) |
| $100,000 to $299,999 | 42 (3.0%) | 27 (1.2%) |
| $300,000 to $499,999 | 33 (2.4%) | 20 (0.9%) |
| $500,000 to $749,999 | 43 (3.1%) | 120 (5.3%) |
| $750,000 to $999,999 | 117 (8.5%) | 182 (8.1%) |
| $1,000,000 or more | 1,124 (81.5%) | 1,880 (83.7%) |
| Total | 1,379 (100.0%) | 2,246 (100.0%) |
Household Income by Mortgage Status in Solana Beach
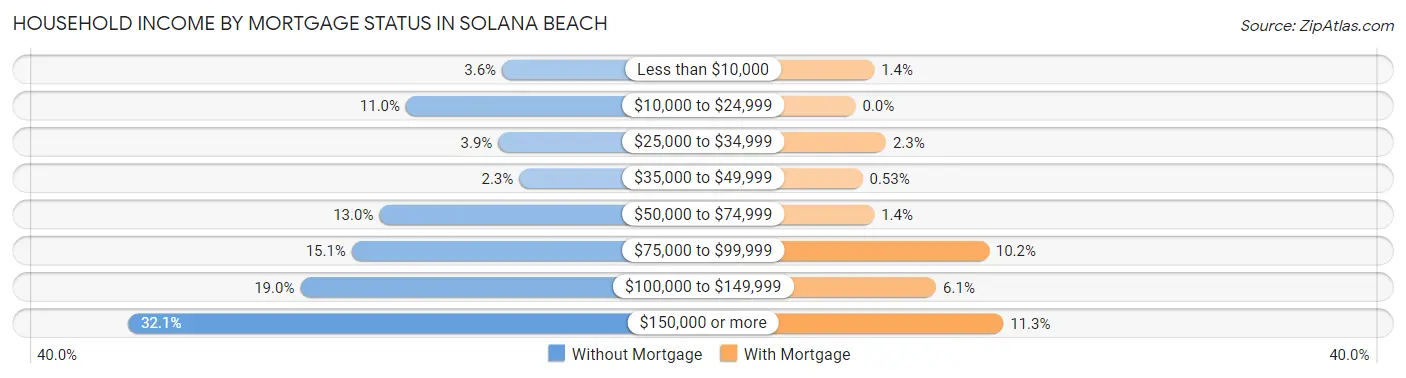
| Household Income | Without Mortgage | With Mortgage |
| Less than $10,000 | 50 (3.6%) | 32 (1.4%) |
| $10,000 to $24,999 | 151 (11.0%) | 0 (0.0%) |
| $25,000 to $34,999 | 54 (3.9%) | 52 (2.3%) |
| $35,000 to $49,999 | 32 (2.3%) | 12 (0.5%) |
| $50,000 to $74,999 | 179 (13.0%) | 32 (1.4%) |
| $75,000 to $99,999 | 208 (15.1%) | 228 (10.2%) |
| $100,000 to $149,999 | 262 (19.0%) | 138 (6.1%) |
| $150,000 or more | 443 (32.1%) | 253 (11.3%) |
| Total | 1,379 (100.0%) | 2,246 (100.0%) |
Property Value to Household Income Ratio in Solana Beach
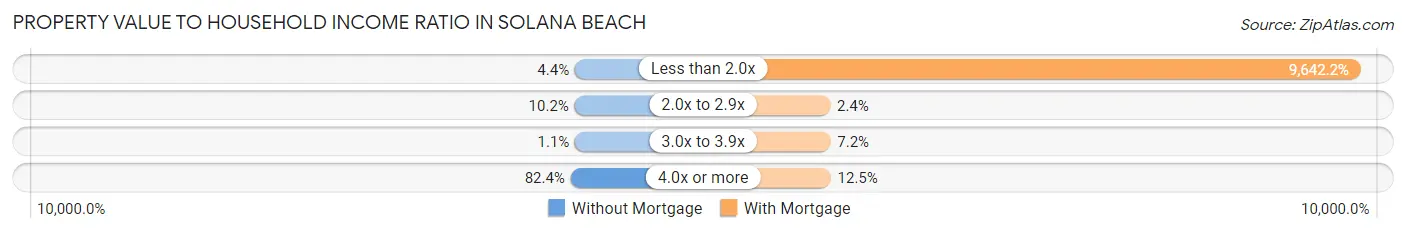
| Value-to-Income Ratio | Without Mortgage | With Mortgage |
| Less than 2.0x | 60 (4.3%) | 216,563 (9,642.2%) |
| 2.0x to 2.9x | 140 (10.2%) | 53 (2.4%) |
| 3.0x to 3.9x | 15 (1.1%) | 161 (7.2%) |
| 4.0x or more | 1,136 (82.4%) | 280 (12.5%) |
| Total | 1,379 (100.0%) | 2,246 (100.0%) |
Real Estate Taxes by Mortgage Status in Solana Beach
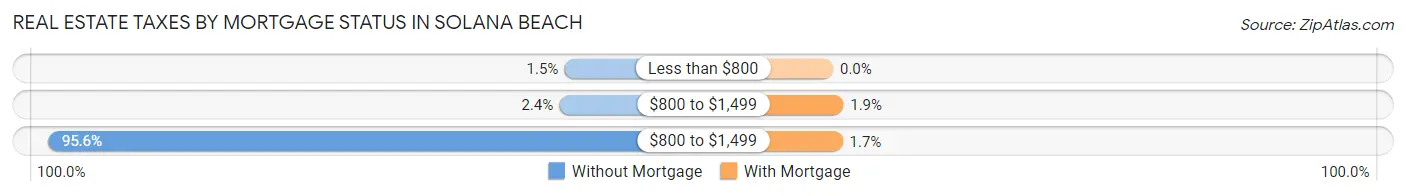
| Property Taxes | Without Mortgage | With Mortgage |
| Less than $800 | 20 (1.5%) | 0 (0.0%) |
| $800 to $1,499 | 33 (2.4%) | 42 (1.9%) |
| $800 to $1,499 | 1,318 (95.6%) | 39 (1.7%) |
| Total | 1,379 (100.0%) | 2,246 (100.0%) |
Health & Disability in Solana Beach
Health Insurance Coverage by Age in Solana Beach
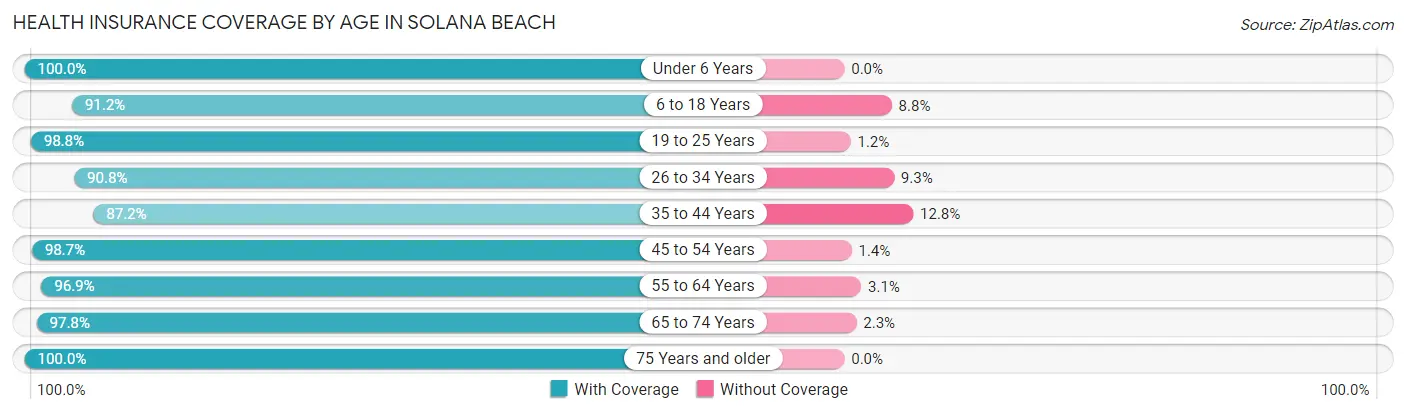
| Age Bracket | With Coverage | Without Coverage |
| Under 6 Years | 857 (100.0%) | 0 (0.0%) |
| 6 to 18 Years | 1,713 (91.2%) | 166 (8.8%) |
| 19 to 25 Years | 512 (98.8%) | 6 (1.2%) |
| 26 to 34 Years | 883 (90.7%) | 90 (9.2%) |
| 35 to 44 Years | 1,400 (87.2%) | 206 (12.8%) |
| 45 to 54 Years | 1,894 (98.7%) | 26 (1.3%) |
| 55 to 64 Years | 2,163 (96.9%) | 70 (3.1%) |
| 65 to 74 Years | 1,563 (97.8%) | 36 (2.2%) |
| 75 Years and older | 1,302 (100.0%) | 0 (0.0%) |
| Total | 12,287 (95.3%) | 600 (4.7%) |
Health Insurance Coverage by Citizenship Status in Solana Beach
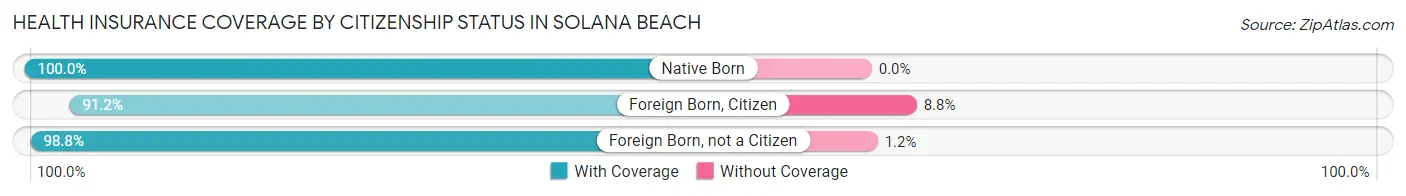
| Citizenship Status | With Coverage | Without Coverage |
| Native Born | 857 (100.0%) | 0 (0.0%) |
| Foreign Born, Citizen | 1,713 (91.2%) | 166 (8.8%) |
| Foreign Born, not a Citizen | 512 (98.8%) | 6 (1.2%) |
Health Insurance Coverage by Household Income in Solana Beach
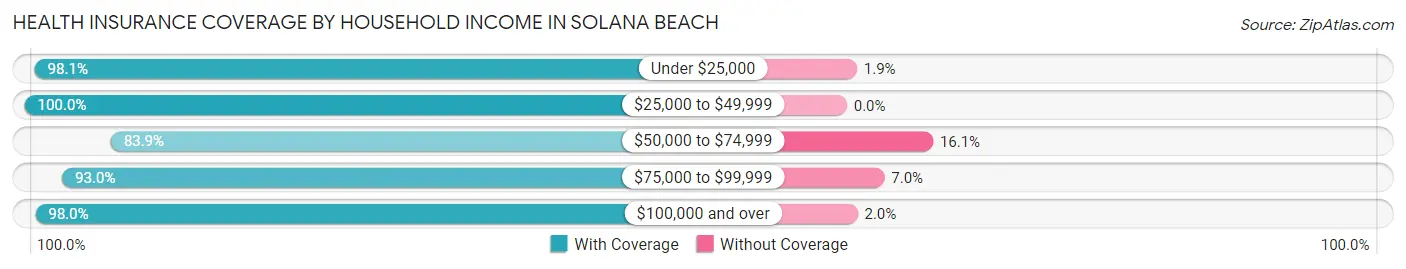
| Household Income | With Coverage | Without Coverage |
| Under $25,000 | 622 (98.1%) | 12 (1.9%) |
| $25,000 to $49,999 | 554 (100.0%) | 0 (0.0%) |
| $50,000 to $74,999 | 1,792 (83.9%) | 345 (16.1%) |
| $75,000 to $99,999 | 937 (93.0%) | 71 (7.0%) |
| $100,000 and over | 8,382 (98.0%) | 172 (2.0%) |
Public vs Private Health Insurance Coverage by Age in Solana Beach
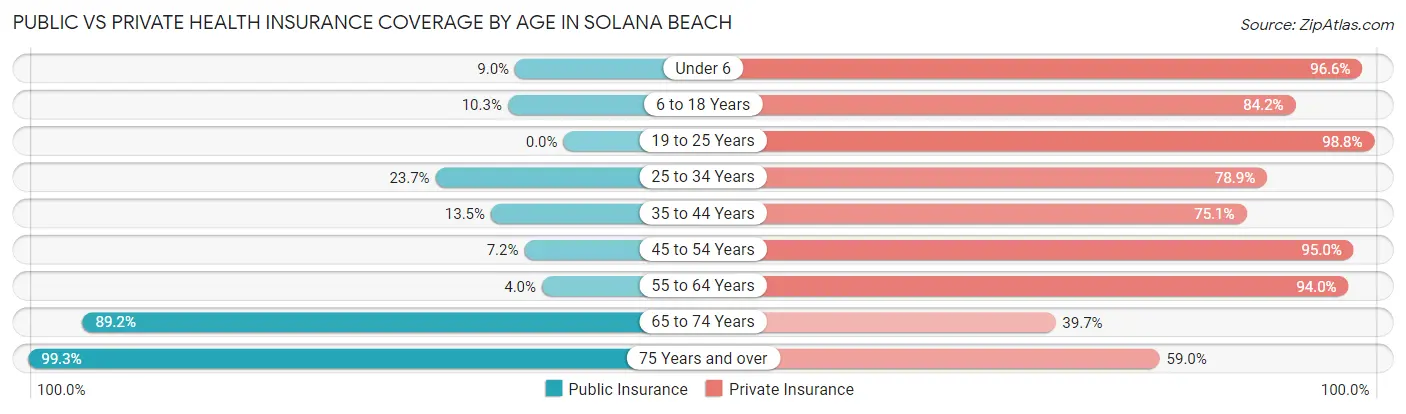
| Age Bracket | Public Insurance | Private Insurance |
| Under 6 | 77 (9.0%) | 828 (96.6%) |
| 6 to 18 Years | 194 (10.3%) | 1,582 (84.2%) |
| 19 to 25 Years | 0 (0.0%) | 512 (98.8%) |
| 25 to 34 Years | 231 (23.7%) | 768 (78.9%) |
| 35 to 44 Years | 216 (13.5%) | 1,206 (75.1%) |
| 45 to 54 Years | 139 (7.2%) | 1,824 (95.0%) |
| 55 to 64 Years | 89 (4.0%) | 2,100 (94.0%) |
| 65 to 74 Years | 1,427 (89.2%) | 634 (39.7%) |
| 75 Years and over | 1,293 (99.3%) | 768 (59.0%) |
| Total | 3,666 (28.4%) | 10,222 (79.3%) |
Disability Status by Sex by Age in Solana Beach
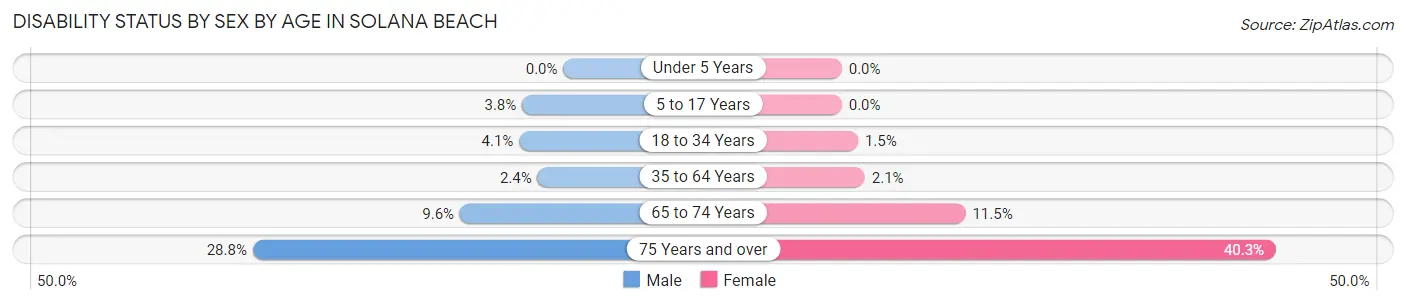
| Age Bracket | Male | Female |
| Under 5 Years | 0 (0.0%) | 0 (0.0%) |
| 5 to 17 Years | 39 (3.8%) | 0 (0.0%) |
| 18 to 34 Years | 27 (4.1%) | 14 (1.5%) |
| 35 to 64 Years | 66 (2.4%) | 64 (2.1%) |
| 65 to 74 Years | 69 (9.6%) | 101 (11.5%) |
| 75 Years and over | 175 (28.8%) | 280 (40.3%) |
Disability Class by Sex by Age in Solana Beach
Disability Class: Hearing Difficulty
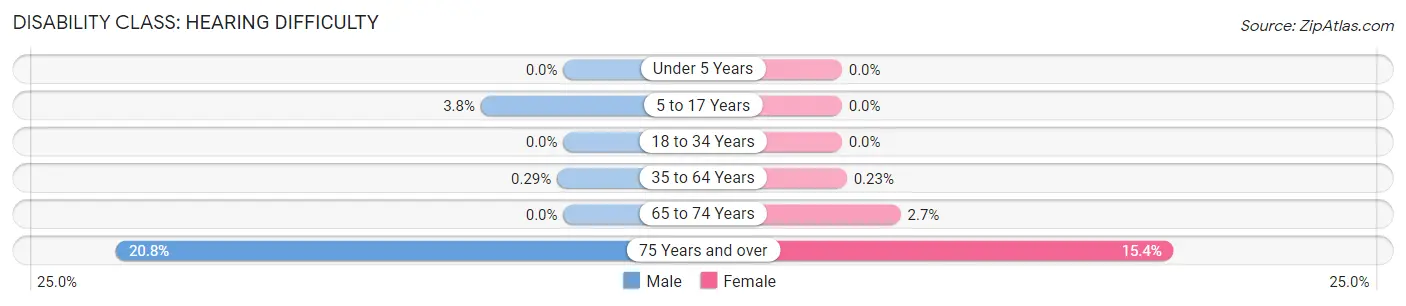
| Age Bracket | Male | Female |
| Under 5 Years | 0 (0.0%) | 0 (0.0%) |
| 5 to 17 Years | 39 (3.8%) | 0 (0.0%) |
| 18 to 34 Years | 0 (0.0%) | 0 (0.0%) |
| 35 to 64 Years | 8 (0.3%) | 7 (0.2%) |
| 65 to 74 Years | 0 (0.0%) | 24 (2.7%) |
| 75 Years and over | 126 (20.8%) | 107 (15.4%) |
Disability Class: Vision Difficulty
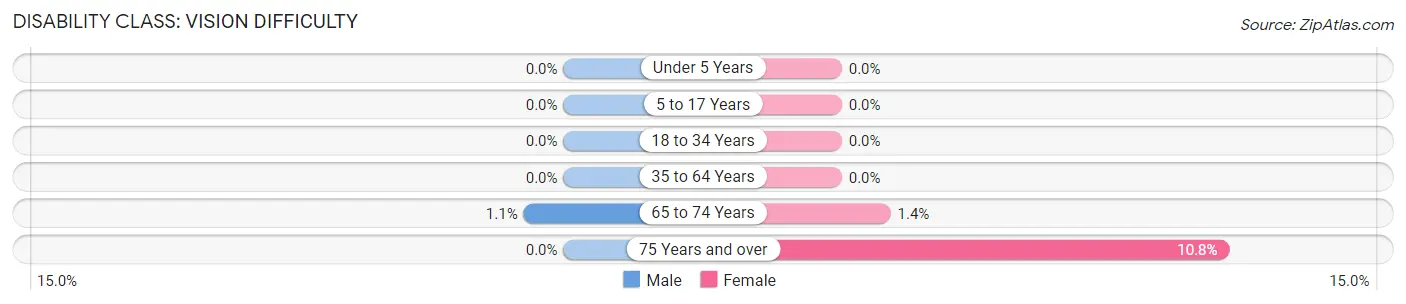
| Age Bracket | Male | Female |
| Under 5 Years | 0 (0.0%) | 0 (0.0%) |
| 5 to 17 Years | 0 (0.0%) | 0 (0.0%) |
| 18 to 34 Years | 0 (0.0%) | 0 (0.0%) |
| 35 to 64 Years | 0 (0.0%) | 0 (0.0%) |
| 65 to 74 Years | 8 (1.1%) | 12 (1.4%) |
| 75 Years and over | 0 (0.0%) | 75 (10.8%) |
Disability Class: Cognitive Difficulty
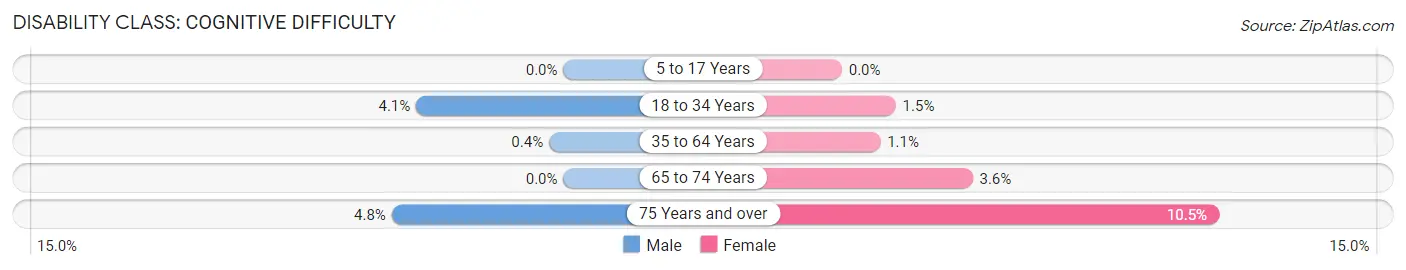
| Age Bracket | Male | Female |
| 5 to 17 Years | 0 (0.0%) | 0 (0.0%) |
| 18 to 34 Years | 27 (4.1%) | 14 (1.5%) |
| 35 to 64 Years | 11 (0.4%) | 32 (1.1%) |
| 65 to 74 Years | 0 (0.0%) | 32 (3.6%) |
| 75 Years and over | 29 (4.8%) | 73 (10.5%) |
Disability Class: Ambulatory Difficulty
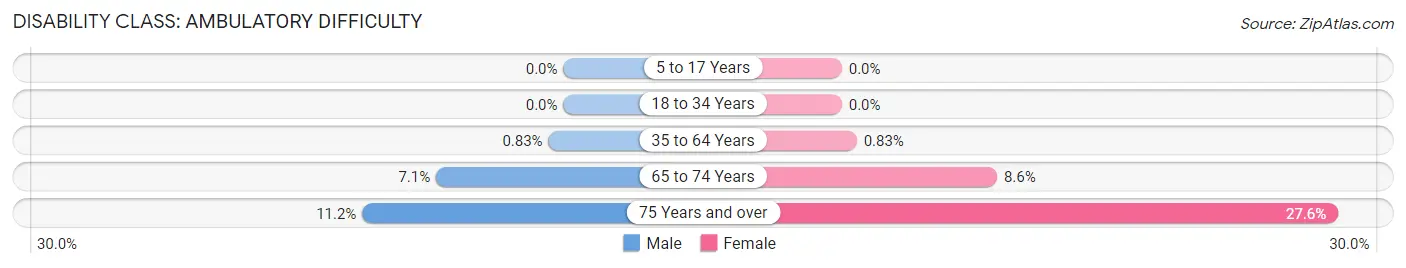
| Age Bracket | Male | Female |
| 5 to 17 Years | 0 (0.0%) | 0 (0.0%) |
| 18 to 34 Years | 0 (0.0%) | 0 (0.0%) |
| 35 to 64 Years | 23 (0.8%) | 25 (0.8%) |
| 65 to 74 Years | 51 (7.1%) | 76 (8.6%) |
| 75 Years and over | 68 (11.2%) | 192 (27.6%) |
Disability Class: Self-Care Difficulty
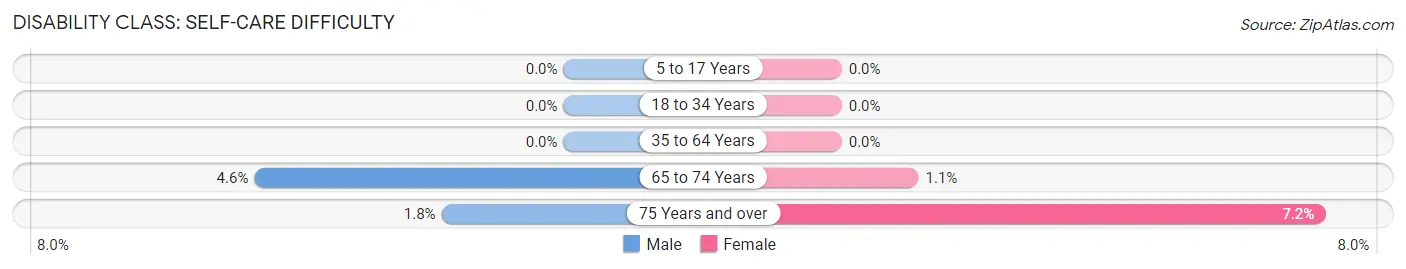
| Age Bracket | Male | Female |
| 5 to 17 Years | 0 (0.0%) | 0 (0.0%) |
| 18 to 34 Years | 0 (0.0%) | 0 (0.0%) |
| 35 to 64 Years | 0 (0.0%) | 0 (0.0%) |
| 65 to 74 Years | 33 (4.6%) | 10 (1.1%) |
| 75 Years and over | 11 (1.8%) | 50 (7.2%) |
Technology Access in Solana Beach
Computing Device Access in Solana Beach
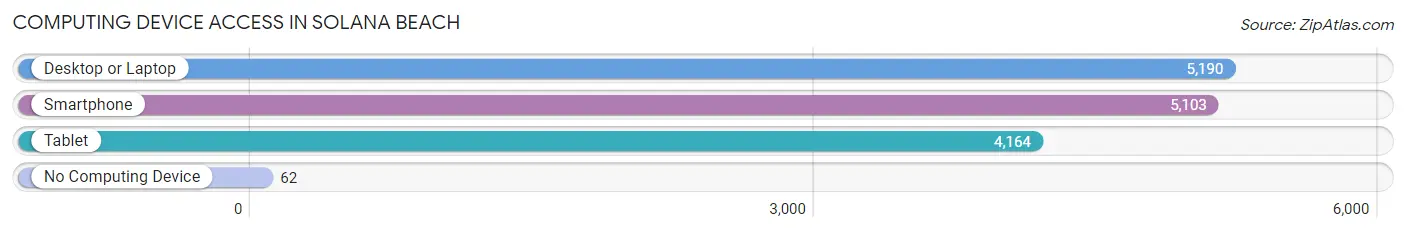
| Device Type | # Households | % Households |
| Desktop or Laptop | 5,190 | 95.5% |
| Smartphone | 5,103 | 93.9% |
| Tablet | 4,164 | 76.6% |
| No Computing Device | 62 | 1.1% |
| Total | 5,436 | 100.0% |
Internet Access in Solana Beach
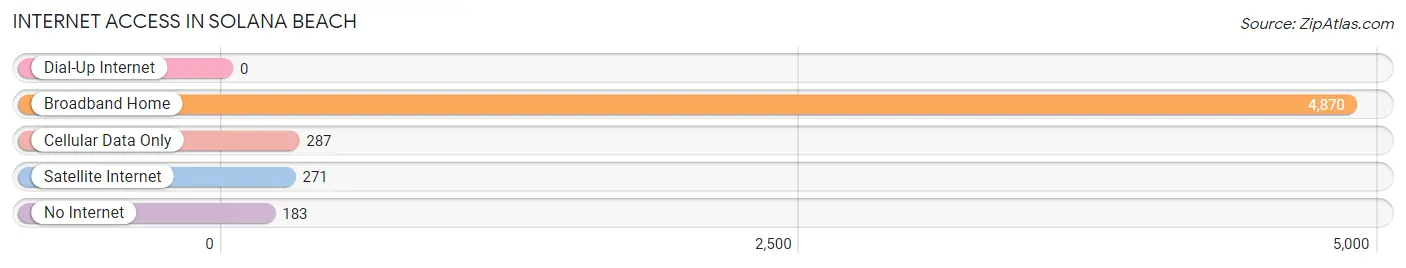
| Internet Type | # Households | % Households |
| Dial-Up Internet | 0 | 0.0% |
| Broadband Home | 4,870 | 89.6% |
| Cellular Data Only | 287 | 5.3% |
| Satellite Internet | 271 | 5.0% |
| No Internet | 183 | 3.4% |
| Total | 5,436 | 100.0% |
Solana Beach Summary
Solana Beach is a coastal city located in San Diego County, California. It is situated along the Pacific Ocean, just north of Del Mar and south of Encinitas. The city is known for its beautiful beaches, vibrant culture, and unique history.
History
Solana Beach was originally inhabited by the Kumeyaay people, who were the first inhabitants of the area. The Kumeyaay were hunter-gatherers who lived off the land and the ocean. They were known for their basket weaving and pottery making. In the late 1800s, the area was settled by Spanish settlers, who named the area Solana Beach, which translates to “sunny beach” in Spanish.
In the early 1900s, the area was developed as a resort town, with the first hotel being built in 1912. The area was popular with tourists, and the population began to grow. In the 1950s, the city was incorporated and the population continued to grow.
Geography
Solana Beach is located in San Diego County, California. It is situated along the Pacific Ocean, just north of Del Mar and south of Encinitas. The city is bordered by the San Elijo Lagoon to the east and the San Dieguito River to the south. The city covers an area of 5.3 square miles and has a population of 13,000.
The city is known for its beautiful beaches, which are popular with surfers and beachgoers. The beaches are also home to a variety of wildlife, including sea lions, dolphins, and whales. The city is also home to a variety of parks, including Fletcher Cove Park, La Colonia Park, and Seascape Park.
Economy
Solana Beach is a popular tourist destination, and the city’s economy is largely driven by tourism. The city is home to a variety of restaurants, shops, and hotels, which cater to tourists and locals alike. The city is also home to a variety of businesses, including technology companies, financial services firms, and medical offices.
The city is also home to a variety of cultural attractions, including the Cedros Design District, which is home to a variety of art galleries, boutiques, and restaurants. The city is also home to the Del Mar Racetrack, which hosts the annual Del Mar Thoroughbred Club horse racing season.
Demographics
As of the 2010 census, the population of Solana Beach was 13,000. The population is largely white (83.3%), with smaller percentages of Hispanic (7.3%), Asian (3.7%), and African American (2.2%) residents. The median household income is $90,000, and the median age is 44.
Solana Beach is a vibrant and diverse city, with a unique history and culture. The city is known for its beautiful beaches, vibrant culture, and unique history. The city is home to a variety of businesses, restaurants, and cultural attractions, making it a popular destination for tourists and locals alike.
Common Questions
What is Per Capita Income in Solana Beach?
Per Capita income in Solana Beach is $86,222.
What is the Median Family Income in Solana Beach?
Median Family Income in Solana Beach is $162,500.
What is the Median Household income in Solana Beach?
Median Household Income in Solana Beach is $137,647.
What is Income or Wage Gap in Solana Beach?
Income or Wage Gap in Solana Beach is 30.5%.
Women in Solana Beach earn 69.5 cents for every dollar earned by a man.
What is Inequality or Gini Index in Solana Beach?
Inequality or Gini Index in Solana Beach is 0.49.
What is the Total Population of Solana Beach?
Total Population of Solana Beach is 12,946.
What is the Total Male Population of Solana Beach?
Total Male Population of Solana Beach is 6,208.
What is the Total Female Population of Solana Beach?
Total Female Population of Solana Beach is 6,738.
What is the Ratio of Males per 100 Females in Solana Beach?
There are 92.13 Males per 100 Females in Solana Beach.
What is the Ratio of Females per 100 Males in Solana Beach?
There are 108.54 Females per 100 Males in Solana Beach.
What is the Median Population Age in Solana Beach?
Median Population Age in Solana Beach is 47.8 Years.
What is the Average Family Size in Solana Beach
Average Family Size in Solana Beach is 2.9 People.
What is the Average Household Size in Solana Beach
Average Household Size in Solana Beach is 2.4 People.
How Large is the Labor Force in Solana Beach?
There are 6,302 People in the Labor Forcein in Solana Beach.
What is the Percentage of People in the Labor Force in Solana Beach?
59.5% of People are in the Labor Force in Solana Beach.
What is the Unemployment Rate in Solana Beach?
Unemployment Rate in Solana Beach is 3.5%.