Cities with the Lowest Poverty Level Among Married Couples in Massachusetts
RELATED REPORTS & OPTIONS
Lowest Poverty | Married Couple
Massachusetts
Compare Cities
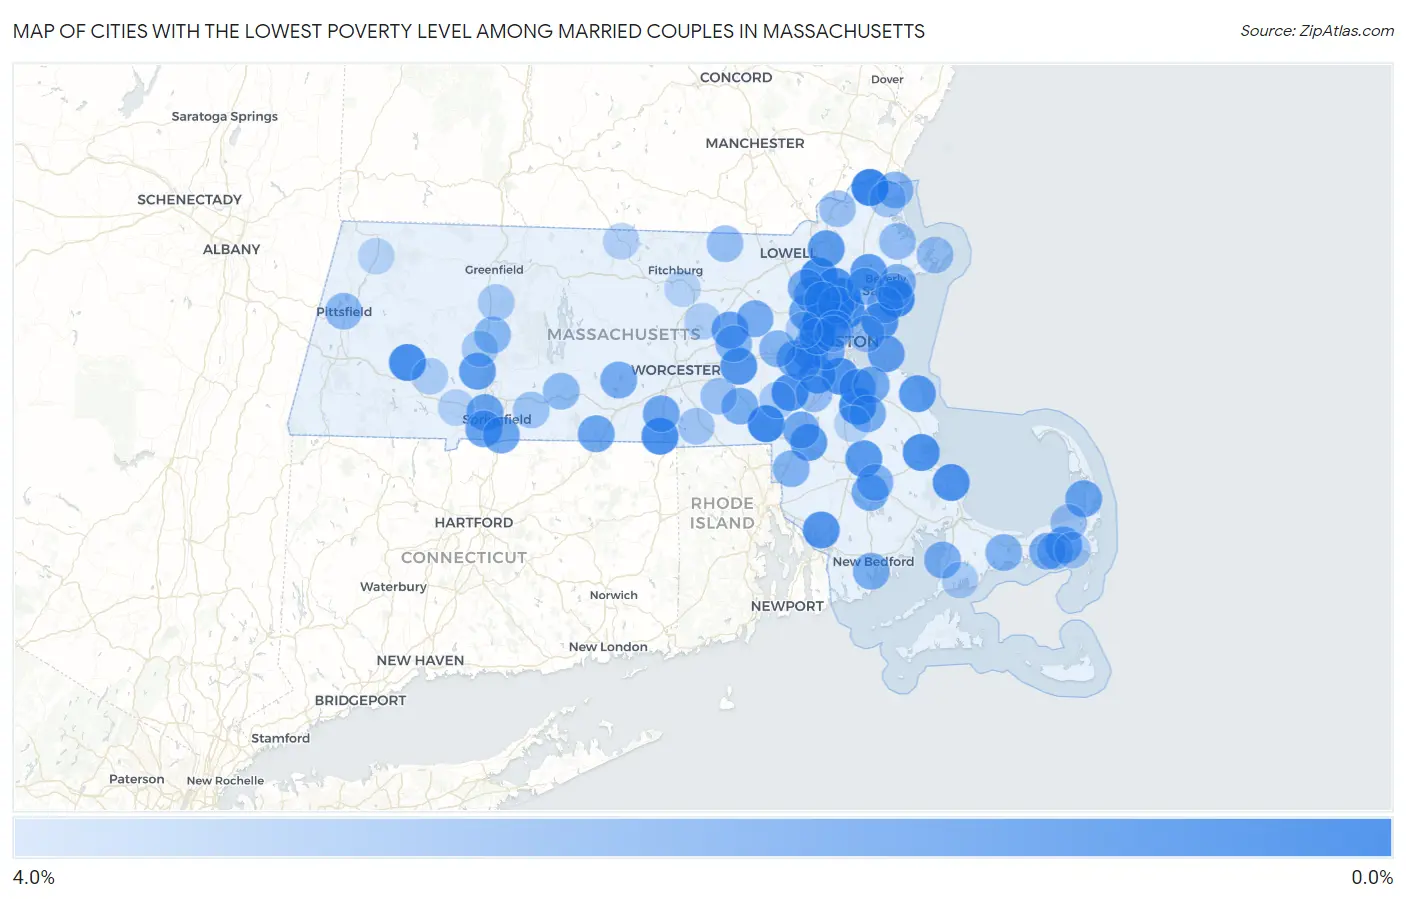
Map of Cities with the Lowest Poverty Level Among Married Couples in Massachusetts
4.0%
0.0%
Cities with the Lowest Poverty Level Among Married Couples in Massachusetts
| City | Married Couples Poverty | vs State | vs National | |
| 1. | Amesbury Town | 0.15% | 3.0%(-2.81)#1 | 4.5%(-4.31)#19 |
| 2. | Marblehead | 0.41% | 3.0%(-2.56)#2 | 4.5%(-4.05)#150 |
| 3. | Franklin Town | 0.41% | 3.0%(-2.56)#3 | 4.5%(-4.05)#151 |
| 4. | Wilmington | 0.48% | 3.0%(-2.49)#4 | 4.5%(-3.98)#220 |
| 5. | Melrose | 0.50% | 3.0%(-2.46)#5 | 4.5%(-3.96)#247 |
| 6. | Holbrook | 0.52% | 3.0%(-2.45)#6 | 4.5%(-3.94)#268 |
| 7. | Webster | 0.69% | 3.0%(-2.28)#7 | 4.5%(-3.77)#511 |
| 8. | Chester | 0.71% | 3.0%(-2.26)#8 | 4.5%(-3.75)#543 |
| 9. | Medfield | 0.75% | 3.0%(-2.22)#9 | 4.5%(-3.71)#612 |
| 10. | Milton | 0.75% | 3.0%(-2.22)#10 | 4.5%(-3.71)#619 |
| 11. | Wakefield | 0.79% | 3.0%(-2.18)#11 | 4.5%(-3.67)#718 |
| 12. | Kingston | 0.84% | 3.0%(-2.12)#12 | 4.5%(-3.62)#856 |
| 13. | The Pinehills | 0.86% | 3.0%(-2.11)#13 | 4.5%(-3.61)#878 |
| 14. | Reading | 0.89% | 3.0%(-2.08)#14 | 4.5%(-3.58)#926 |
| 15. | Winchester | 0.98% | 3.0%(-1.99)#15 | 4.5%(-3.49)#1,150 |
| 16. | Dedham | 1.0% | 3.0%(-1.94)#16 | 4.5%(-3.44)#1,272 |
| 17. | Somerset | 1.0% | 3.0%(-1.93)#17 | 4.5%(-3.43)#1,291 |
| 18. | Nahant | 1.1% | 3.0%(-1.91)#18 | 4.5%(-3.41)#1,331 |
| 19. | Cordaville | 1.1% | 3.0%(-1.90)#19 | 4.5%(-3.40)#1,349 |
| 20. | Scituate | 1.1% | 3.0%(-1.83)#20 | 4.5%(-3.33)#1,512 |
| 21. | Bridgewater Town | 1.2% | 3.0%(-1.80)#21 | 4.5%(-3.30)#1,604 |
| 22. | Danvers | 1.2% | 3.0%(-1.77)#22 | 4.5%(-3.26)#1,679 |
| 23. | Mansfield Center | 1.3% | 3.0%(-1.69)#23 | 4.5%(-3.19)#1,872 |
| 24. | Andover | 1.3% | 3.0%(-1.68)#24 | 4.5%(-3.17)#1,901 |
| 25. | Belmont | 1.3% | 3.0%(-1.66)#25 | 4.5%(-3.15)#1,964 |
| 26. | Easthampton Town | 1.4% | 3.0%(-1.57)#26 | 4.5%(-3.06)#2,202 |
| 27. | North Attleborough | 1.4% | 3.0%(-1.55)#27 | 4.5%(-3.04)#2,254 |
| 28. | Hull | 1.4% | 3.0%(-1.53)#28 | 4.5%(-3.02)#2,307 |
| 29. | Hudson | 1.5% | 3.0%(-1.50)#29 | 4.5%(-2.99)#2,409 |
| 30. | Lexington | 1.6% | 3.0%(-1.42)#30 | 4.5%(-2.91)#2,613 |
| 31. | Newton | 1.6% | 3.0%(-1.39)#31 | 4.5%(-2.89)#2,671 |
| 32. | West Springfield Town | 1.6% | 3.0%(-1.35)#32 | 4.5%(-2.84)#2,807 |
| 33. | Agawam Town | 1.6% | 3.0%(-1.32)#33 | 4.5%(-2.82)#2,876 |
| 34. | Brookline | 1.6% | 3.0%(-1.32)#34 | 4.5%(-2.81)#2,887 |
| 35. | Braintree Town | 1.7% | 3.0%(-1.30)#35 | 4.5%(-2.80)#2,930 |
| 36. | Northwest Harwich | 1.7% | 3.0%(-1.29)#36 | 4.5%(-2.79)#2,951 |
| 37. | Longmeadow | 1.7% | 3.0%(-1.27)#37 | 4.5%(-2.77)#3,006 |
| 38. | Holland | 1.7% | 3.0%(-1.26)#38 | 4.5%(-2.75)#3,040 |
| 39. | North Eastham | 1.7% | 3.0%(-1.24)#39 | 4.5%(-2.73)#3,089 |
| 40. | Medford | 1.8% | 3.0%(-1.21)#40 | 4.5%(-2.71)#3,144 |
| 41. | Oxford | 1.8% | 3.0%(-1.19)#41 | 4.5%(-2.68)#3,222 |
| 42. | Wellesley | 1.8% | 3.0%(-1.18)#42 | 4.5%(-2.67)#3,251 |
| 43. | Needham | 1.8% | 3.0%(-1.15)#43 | 4.5%(-2.64)#3,341 |
| 44. | North Lakeville | 1.9% | 3.0%(-1.08)#44 | 4.5%(-2.57)#3,508 |
| 45. | Foxborough | 1.9% | 3.0%(-1.02)#45 | 4.5%(-2.52)#3,608 |
| 46. | West Dennis | 2.0% | 3.0%(-1.01)#46 | 4.5%(-2.51)#3,631 |
| 47. | Weymouth Town | 2.0% | 3.0%(-0.995)#47 | 4.5%(-2.49)#3,691 |
| 48. | Maynard | 2.0% | 3.0%(-0.958)#48 | 4.5%(-2.45)#3,785 |
| 49. | Burlington | 2.0% | 3.0%(-0.949)#49 | 4.5%(-2.44)#3,808 |
| 50. | Pinehurst | 2.0% | 3.0%(-0.944)#50 | 4.5%(-2.44)#3,817 |
| 51. | East Brookfield | 2.0% | 3.0%(-0.934)#51 | 4.5%(-2.43)#3,839 |
| 52. | Abington | 2.1% | 3.0%(-0.888)#52 | 4.5%(-2.38)#3,964 |
| 53. | Bliss Corner | 2.1% | 3.0%(-0.824)#53 | 4.5%(-2.32)#4,146 |
| 54. | Milford | 2.2% | 3.0%(-0.817)#54 | 4.5%(-2.31)#4,177 |
| 55. | North Falmouth | 2.2% | 3.0%(-0.808)#55 | 4.5%(-2.30)#4,196 |
| 56. | Arlington | 2.3% | 3.0%(-0.682)#56 | 4.5%(-2.18)#4,518 |
| 57. | Watertown Town | 2.3% | 3.0%(-0.673)#57 | 4.5%(-2.17)#4,539 |
| 58. | Beverly | 2.3% | 3.0%(-0.661)#58 | 4.5%(-2.16)#4,563 |
| 59. | Barnstable Town | 2.4% | 3.0%(-0.599)#59 | 4.5%(-2.09)#4,726 |
| 60. | Salisbury | 2.4% | 3.0%(-0.581)#60 | 4.5%(-2.07)#4,787 |
| 61. | Middleborough Center | 2.4% | 3.0%(-0.572)#61 | 4.5%(-2.07)#4,808 |
| 62. | Attleboro | 2.4% | 3.0%(-0.567)#62 | 4.5%(-2.06)#4,819 |
| 63. | Stoneham | 2.4% | 3.0%(-0.541)#63 | 4.5%(-2.04)#4,879 |
| 64. | Marlborough | 2.4% | 3.0%(-0.539)#64 | 4.5%(-2.03)#4,886 |
| 65. | Woburn | 2.4% | 3.0%(-0.525)#65 | 4.5%(-2.02)#4,941 |
| 66. | Cochituate | 2.4% | 3.0%(-0.524)#66 | 4.5%(-2.02)#4,945 |
| 67. | Amherst | 2.5% | 3.0%(-0.501)#67 | 4.5%(-1.99)#4,995 |
| 68. | Peabody | 2.5% | 3.0%(-0.490)#68 | 4.5%(-1.98)#5,014 |
| 69. | Somerville | 2.5% | 3.0%(-0.436)#69 | 4.5%(-1.93)#5,153 |
| 70. | Hatfield | 2.6% | 3.0%(-0.404)#70 | 4.5%(-1.90)#5,224 |
| 71. | Palmer Town | 2.7% | 3.0%(-0.305)#71 | 4.5%(-1.80)#5,469 |
| 72. | Pittsfield | 2.7% | 3.0%(-0.289)#72 | 4.5%(-1.78)#5,508 |
| 73. | Swampscott | 2.9% | 3.0%(-0.102)#73 | 4.5%(-1.60)#5,955 |
| 74. | Gloucester | 2.9% | 3.0%(-0.100)#74 | 4.5%(-1.59)#5,961 |
| 75. | Ipswich | 2.9% | 3.0%(-0.099)#75 | 4.5%(-1.59)#5,963 |
| 76. | Winthrop Town | 2.9% | 3.0%(-0.091)#76 | 4.5%(-1.59)#5,981 |
| 77. | Norwood | 2.9% | 3.0%(-0.053)#77 | 4.5%(-1.55)#6,064 |
| 78. | Pepperell | 2.9% | 3.0%(-0.040)#78 | 4.5%(-1.53)#6,084 |
| 79. | Upton | 3.0% | 3.0%(+0.041)#79 | 4.5%(-1.45)#6,290 |
| 80. | Haverhill | 3.0% | 3.0%(+0.042)#80 | 4.5%(-1.45)#6,295 |
| 81. | Brewster | 3.0% | 3.0%(+0.057)#81 | 4.5%(-1.44)#6,322 |
| 82. | Dennis Port | 3.0% | 3.0%(+0.063)#82 | 4.5%(-1.43)#6,330 |
| 83. | Wilbraham | 3.1% | 3.0%(+0.171)#83 | 4.5%(-1.32)#6,593 |
| 84. | East Douglas | 3.2% | 3.0%(+0.246)#84 | 4.5%(-1.25)#6,747 |
| 85. | Newburyport | 3.3% | 3.0%(+0.298)#85 | 4.5%(-1.20)#6,870 |
| 86. | Salem | 3.4% | 3.0%(+0.388)#86 | 4.5%(-1.11)#7,074 |
| 87. | South Deerfield | 3.4% | 3.0%(+0.417)#87 | 4.5%(-1.08)#7,140 |
| 88. | Harwich Port | 3.4% | 3.0%(+0.461)#88 | 4.5%(-1.03)#7,220 |
| 89. | Millis Clicquot | 3.4% | 3.0%(+0.462)#89 | 4.5%(-1.03)#7,222 |
| 90. | Northampton | 3.5% | 3.0%(+0.486)#90 | 4.5%(-1.01)#7,311 |
| 91. | Cambridge | 3.5% | 3.0%(+0.534)#91 | 4.5%(-0.960)#7,401 |
| 92. | East Falmouth | 3.5% | 3.0%(+0.540)#92 | 4.5%(-0.954)#7,411 |
| 93. | Waltham | 3.5% | 3.0%(+0.569)#93 | 4.5%(-0.925)#7,473 |
| 94. | Huntington | 3.6% | 3.0%(+0.583)#94 | 4.5%(-0.912)#7,501 |
| 95. | Clinton | 3.7% | 3.0%(+0.684)#95 | 4.5%(-0.810)#7,721 |
| 96. | Westfield | 3.7% | 3.0%(+0.762)#96 | 4.5%(-0.732)#7,879 |
| 97. | Winchendon | 3.8% | 3.0%(+0.792)#97 | 4.5%(-0.703)#7,937 |
| 98. | Brockton | 3.8% | 3.0%(+0.869)#98 | 4.5%(-0.625)#8,083 |
| 99. | Leominster | 3.8% | 3.0%(+0.878)#99 | 4.5%(-0.616)#8,100 |
| 100. | Adams | 3.9% | 3.0%(+0.910)#100 | 4.5%(-0.584)#8,193 |
Common Questions
What are the Top 10 Cities with the Lowest Poverty Level Among Married Couples in Massachusetts?
Top 10 Cities with the Lowest Poverty Level Among Married Couples in Massachusetts are:
#1
0.15%
#2
0.41%
#3
0.41%
#4
0.48%
#5
0.50%
#6
0.52%
#7
0.69%
#8
0.71%
#9
0.75%
#10
0.75%
What city has the Lowest Poverty Level Among Married Couples in Massachusetts?
Amesbury Town has the Lowest Poverty Level Among Married Couples in Massachusetts with 0.15%.
What is the Poverty Level Among Married Couples in the State of Massachusetts?
Poverty Level Among Married Couples in Massachusetts is 3.0%.
What is the Poverty Level Among Married Couples in the United States?
Poverty Level Among Married Couples in the United States is 4.5%.