El Cerrito, CA Map & Demographics
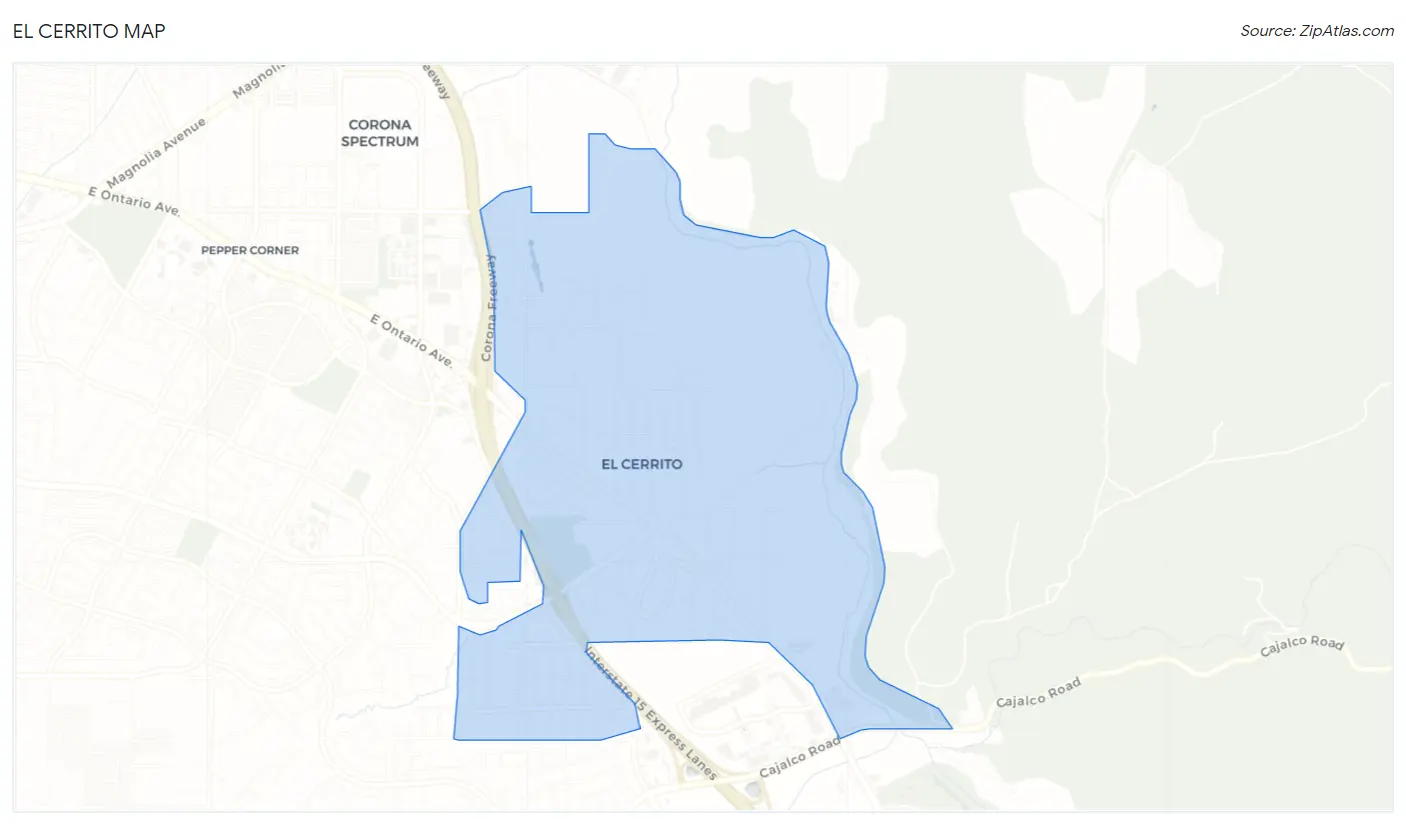
El Cerrito Map
El Cerrito Overview
$37,584
PER CAPITA INCOME
$115,081
AVG FAMILY INCOME
$122,885
AVG HOUSEHOLD INCOME
36.7%
WAGE / INCOME GAP [ % ]
63.3¢/ $1
WAGE / INCOME GAP [ $ ]
0.31
INEQUALITY / GINI INDEX
5,328
TOTAL POPULATION
2,567
MALE POPULATION
2,761
FEMALE POPULATION
92.97
MALES / 100 FEMALES
107.56
FEMALES / 100 MALES
36.5
MEDIAN AGE
3.9
AVG FAMILY SIZE
3.7
AVG HOUSEHOLD SIZE
2,699
LABOR FORCE [ PEOPLE ]
62.3%
PERCENT IN LABOR FORCE
3.1%
UNEMPLOYMENT RATE
El Cerrito Zip Codes
Income in El Cerrito
Income Overview in El Cerrito
Per Capita Income in El Cerrito is $37,584, while median incomes of families and households are $115,081 and $122,885 respectively.
| Characteristic | Number | Measure |
| Per Capita Income | 5,328 | $37,584 |
| Median Family Income | 1,252 | $115,081 |
| Mean Family Income | 1,252 | $130,492 |
| Median Household Income | 1,436 | $122,885 |
| Mean Household Income | 1,436 | $134,011 |
| Income Deficit | 1,252 | $0 |
| Wage / Income Gap (%) | 5,328 | 36.74% |
| Wage / Income Gap ($) | 5,328 | 63.26¢ per $1 |
| Gini / Inequality Index | 5,328 | 0.31 |
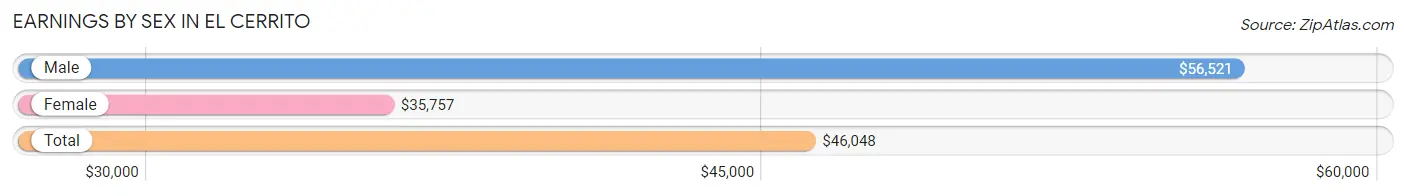
Earnings by Sex in El Cerrito
Average Earnings in El Cerrito are $46,048, $56,521 for men and $35,757 for women, a difference of 36.7%.
| Sex | Number | Average Earnings |
| Male | 1,543 (54.7%) | $56,521 |
| Female | 1,278 (45.3%) | $35,757 |
| Total | 2,821 (100.0%) | $46,048 |
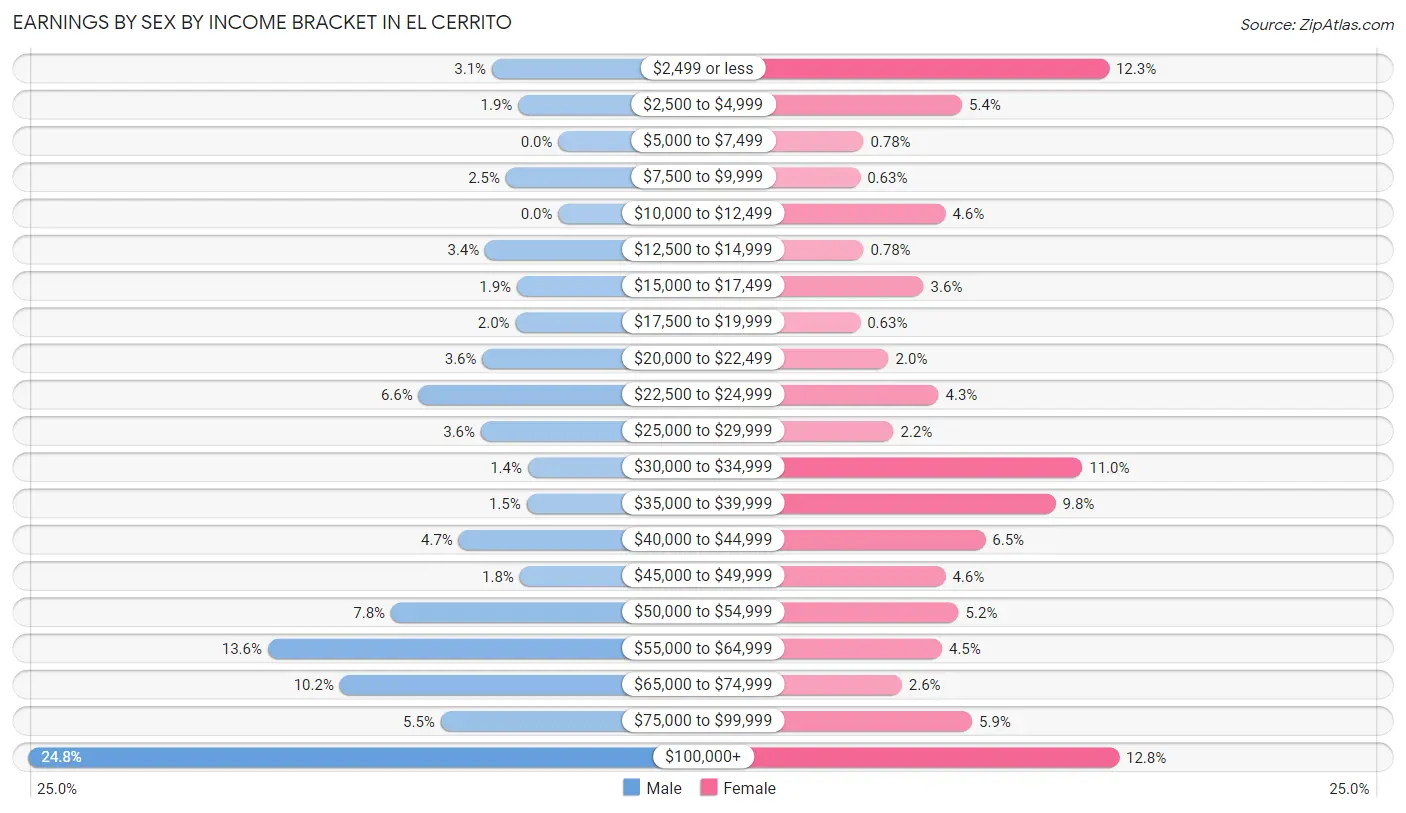
Earnings by Sex by Income Bracket in El Cerrito
The most common earnings brackets in El Cerrito are $100,000+ for men (383 | 24.8%) and $100,000+ for women (163 | 12.8%).
| Income | Male | Female |
| $2,499 or less | 48 (3.1%) | 157 (12.3%) |
| $2,500 to $4,999 | 29 (1.9%) | 69 (5.4%) |
| $5,000 to $7,499 | 0 (0.0%) | 10 (0.8%) |
| $7,500 to $9,999 | 38 (2.5%) | 8 (0.6%) |
| $10,000 to $12,499 | 0 (0.0%) | 59 (4.6%) |
| $12,500 to $14,999 | 53 (3.4%) | 10 (0.8%) |
| $15,000 to $17,499 | 30 (1.9%) | 46 (3.6%) |
| $17,500 to $19,999 | 31 (2.0%) | 8 (0.6%) |
| $20,000 to $22,499 | 55 (3.6%) | 25 (2.0%) |
| $22,500 to $24,999 | 101 (6.6%) | 55 (4.3%) |
| $25,000 to $29,999 | 56 (3.6%) | 28 (2.2%) |
| $30,000 to $34,999 | 22 (1.4%) | 141 (11.0%) |
| $35,000 to $39,999 | 23 (1.5%) | 125 (9.8%) |
| $40,000 to $44,999 | 72 (4.7%) | 83 (6.5%) |
| $45,000 to $49,999 | 28 (1.8%) | 59 (4.6%) |
| $50,000 to $54,999 | 121 (7.8%) | 67 (5.2%) |
| $55,000 to $64,999 | 210 (13.6%) | 57 (4.5%) |
| $65,000 to $74,999 | 158 (10.2%) | 33 (2.6%) |
| $75,000 to $99,999 | 85 (5.5%) | 75 (5.9%) |
| $100,000+ | 383 (24.8%) | 163 (12.8%) |
| Total | 1,543 (100.0%) | 1,278 (100.0%) |
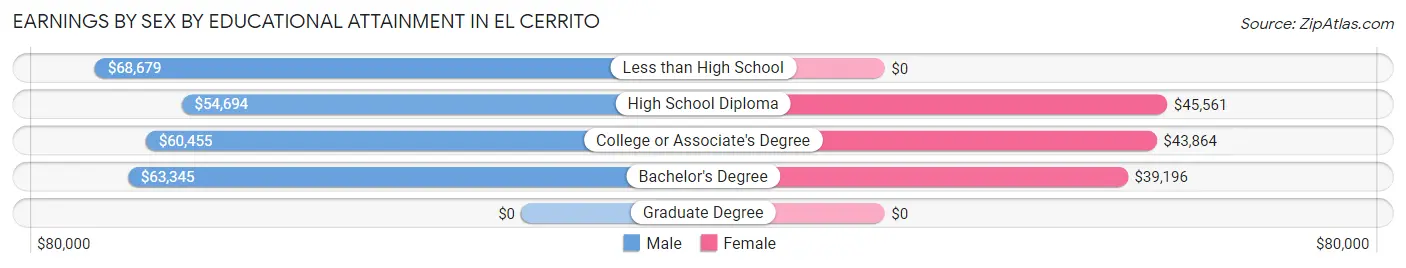
Earnings by Sex by Educational Attainment in El Cerrito
Average earnings in El Cerrito are $64,129 for men and $41,042 for women, a difference of 36.0%. Men with an educational attainment of less than high school enjoy the highest average annual earnings of $68,679, while those with high school diploma education earn the least with $54,694. Women with an educational attainment of high school diploma earn the most with the average annual earnings of $45,561, while those with bachelor's degree education have the smallest earnings of $39,196.
| Educational Attainment | Male Income | Female Income |
| Less than High School | $68,679 | $0 |
| High School Diploma | $54,694 | $45,561 |
| College or Associate's Degree | $60,455 | $43,864 |
| Bachelor's Degree | $63,345 | $39,196 |
| Graduate Degree | - | - |
| Total | $64,129 | $41,042 |
Family Income in El Cerrito
Family Income Brackets in El Cerrito
According to the El Cerrito family income data, there are 477 families falling into the $100,000 to $149,999 income range, which is the most common income bracket and makes up 38.1% of all families. Conversely, the $25,000 to $34,999 income bracket is the least frequent group with only 8 families (0.6%) belonging to this category.
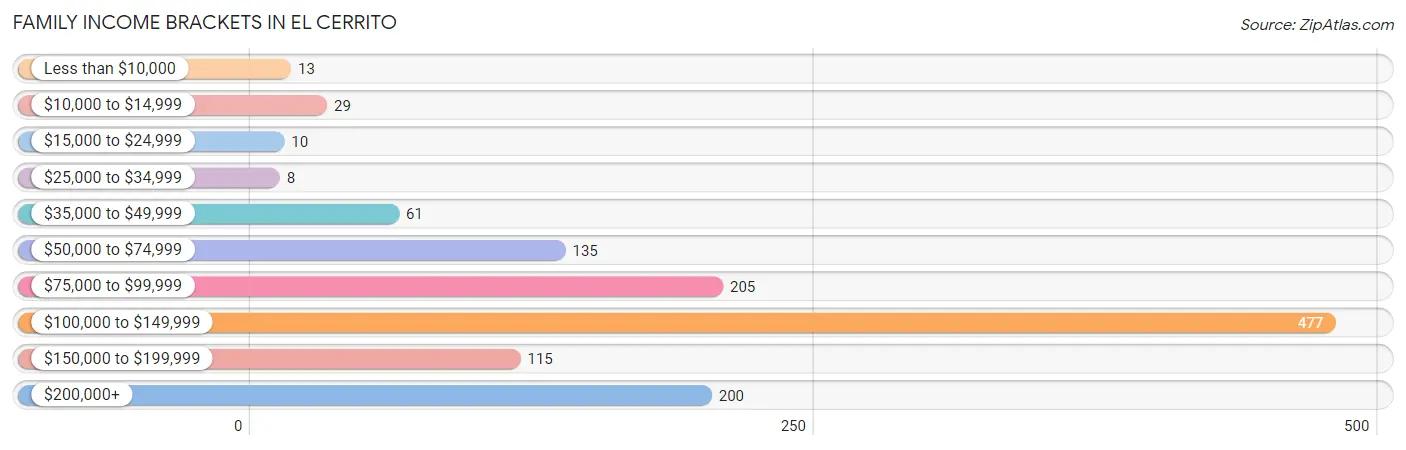
| Income Bracket | # Families | % Families |
| Less than $10,000 | 13 | 1.0% |
| $10,000 to $14,999 | 29 | 2.3% |
| $15,000 to $24,999 | 10 | 0.8% |
| $25,000 to $34,999 | 8 | 0.6% |
| $35,000 to $49,999 | 61 | 4.9% |
| $50,000 to $74,999 | 135 | 10.8% |
| $75,000 to $99,999 | 205 | 16.4% |
| $100,000 to $149,999 | 477 | 38.1% |
| $150,000 to $199,999 | 115 | 9.2% |
| $200,000+ | 200 | 16.0% |
Family Income by Famaliy Size in El Cerrito
2-person families (304 | 24.3%) account for the highest median family income in El Cerrito with $128,182 per family, while 2-person families (304 | 24.3%) have the highest median income of $64,091 per family member.
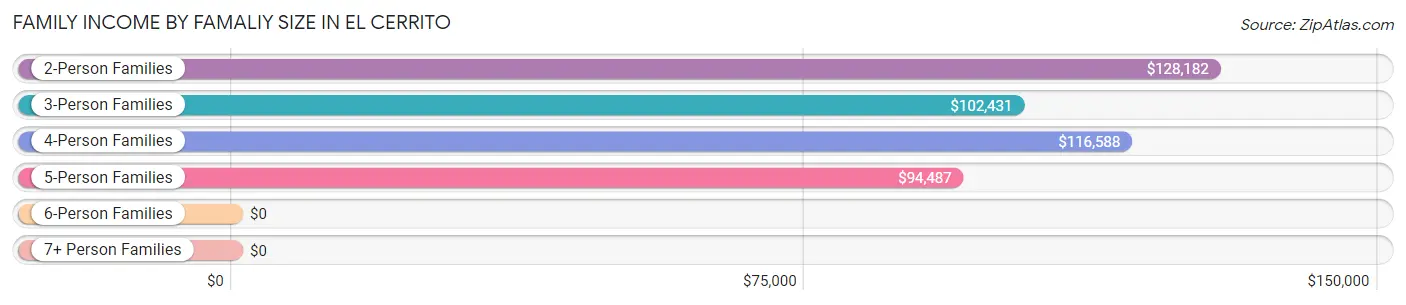
| Income Bracket | # Families | Median Income |
| 2-Person Families | 304 (24.3%) | $128,182 |
| 3-Person Families | 307 (24.5%) | $102,431 |
| 4-Person Families | 391 (31.2%) | $116,588 |
| 5-Person Families | 154 (12.3%) | $94,487 |
| 6-Person Families | 71 (5.7%) | $0 |
| 7+ Person Families | 25 (2.0%) | $0 |
| Total | 1,252 (100.0%) | $115,081 |
Family Income by Number of Earners in El Cerrito
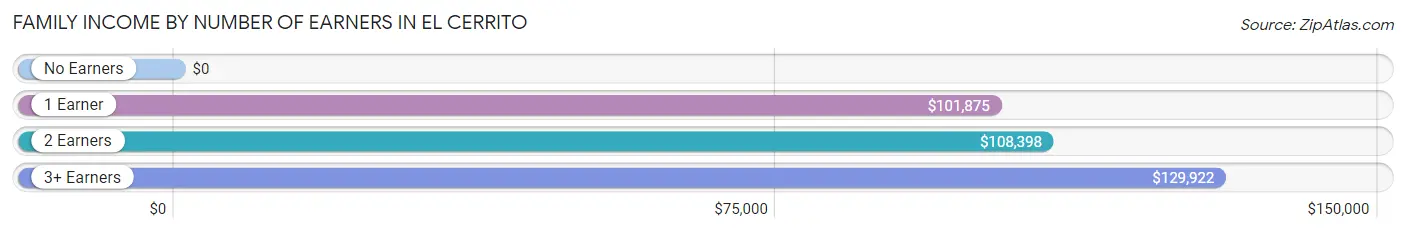
| Number of Earners | # Families | Median Income |
| No Earners | 37 (3.0%) | $0 |
| 1 Earner | 473 (37.8%) | $101,875 |
| 2 Earners | 469 (37.5%) | $108,398 |
| 3+ Earners | 273 (21.8%) | $129,922 |
| Total | 1,252 (100.0%) | $115,081 |
Household Income in El Cerrito
Household Income Brackets in El Cerrito
With 439 households falling in the category, the $100,000 to $149,999 income range is the most frequent in El Cerrito, accounting for 30.6% of all households. In contrast, only 10 households (0.7%) fall into the $15,000 to $24,999 income bracket, making it the least populous group.
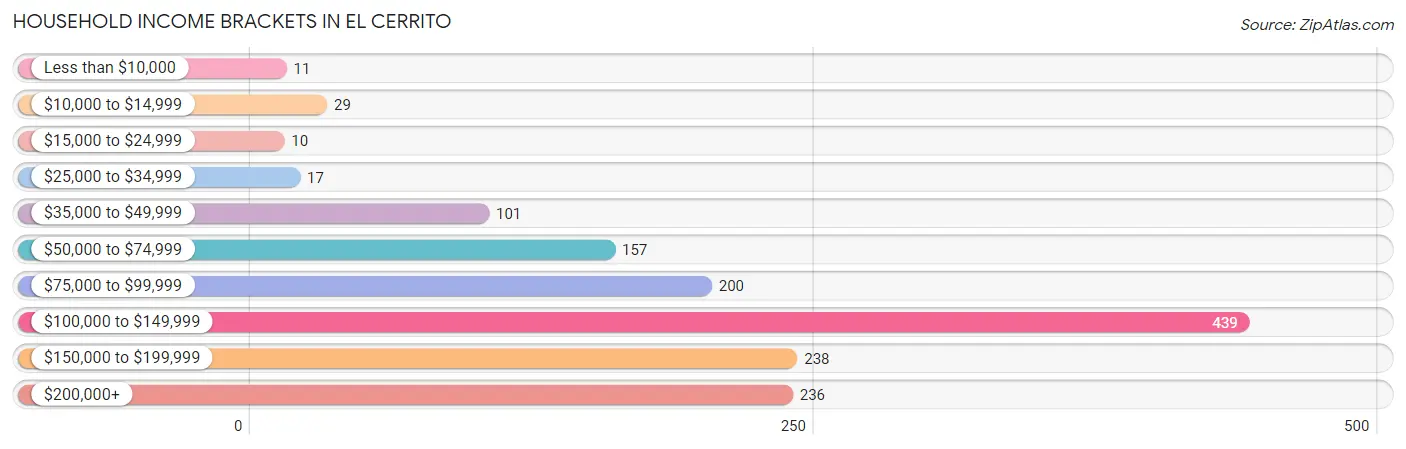
| Income Bracket | # Households | % Households |
| Less than $10,000 | 11 | 0.8% |
| $10,000 to $14,999 | 29 | 2.0% |
| $15,000 to $24,999 | 10 | 0.7% |
| $25,000 to $34,999 | 17 | 1.2% |
| $35,000 to $49,999 | 101 | 7.0% |
| $50,000 to $74,999 | 157 | 10.9% |
| $75,000 to $99,999 | 200 | 13.9% |
| $100,000 to $149,999 | 439 | 30.6% |
| $150,000 to $199,999 | 238 | 16.6% |
| $200,000+ | 236 | 16.4% |
Household Income by Householder Age in El Cerrito
The median household income in El Cerrito is $122,885, with the highest median household income of $123,846 found in the 25 to 44 years age bracket for the primary householder. A total of 264 households (18.4%) fall into this category.
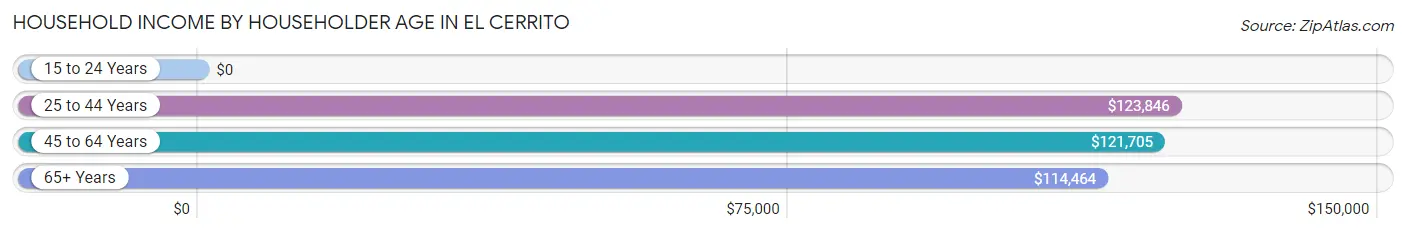
| Income Bracket | # Households | Median Income |
| 15 to 24 Years | 0 (0.0%) | $0 |
| 25 to 44 Years | 264 (18.4%) | $123,846 |
| 45 to 64 Years | 943 (65.7%) | $121,705 |
| 65+ Years | 229 (16.0%) | $114,464 |
| Total | 1,436 (100.0%) | $122,885 |
Poverty in El Cerrito
Income Below Poverty by Sex and Age in El Cerrito
With 9.3% poverty level for males and 8.7% for females among the residents of El Cerrito, 5 year old males and under 5 year old females are the most vulnerable to poverty, with 30 males (100.0%) and 54 females (26.3%) in their respective age groups living below the poverty level.
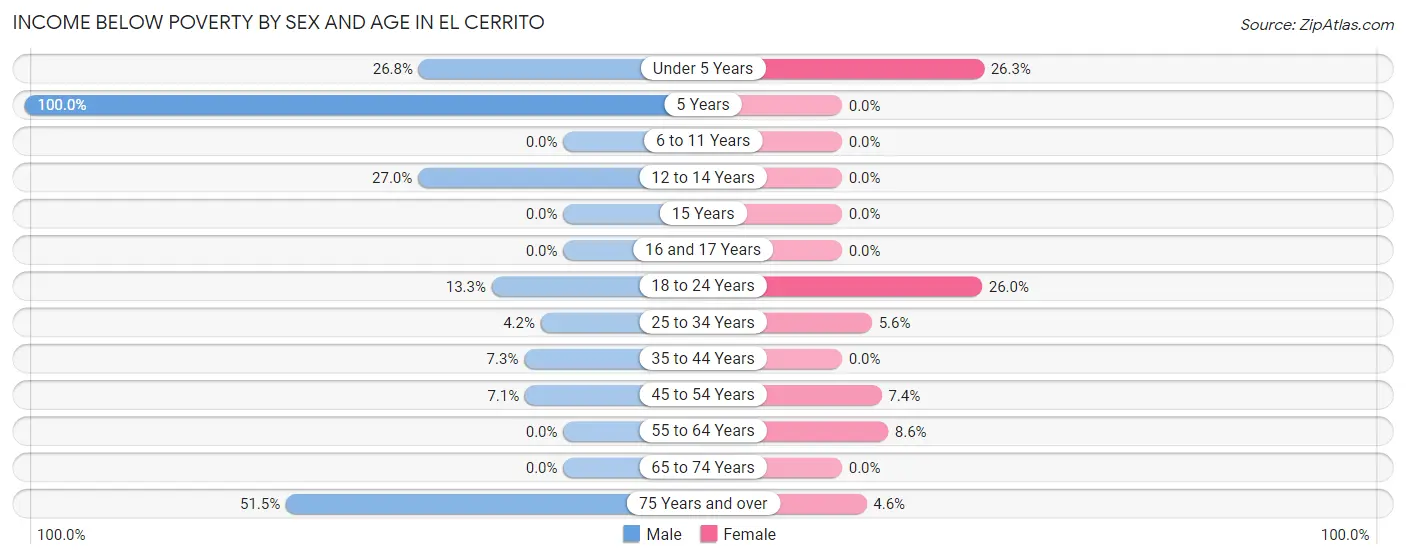
| Age Bracket | Male | Female |
| Under 5 Years | 33 (26.8%) | 54 (26.3%) |
| 5 Years | 30 (100.0%) | 0 (0.0%) |
| 6 to 11 Years | 0 (0.0%) | 0 (0.0%) |
| 12 to 14 Years | 31 (27.0%) | 0 (0.0%) |
| 15 Years | 0 (0.0%) | 0 (0.0%) |
| 16 and 17 Years | 0 (0.0%) | 0 (0.0%) |
| 18 to 24 Years | 34 (13.3%) | 98 (26.0%) |
| 25 to 34 Years | 18 (4.2%) | 13 (5.6%) |
| 35 to 44 Years | 22 (7.3%) | 0 (0.0%) |
| 45 to 54 Years | 35 (7.1%) | 29 (7.4%) |
| 55 to 64 Years | 0 (0.0%) | 40 (8.6%) |
| 65 to 74 Years | 0 (0.0%) | 0 (0.0%) |
| 75 Years and over | 35 (51.5%) | 5 (4.5%) |
| Total | 238 (9.3%) | 239 (8.7%) |
Income Above Poverty by Sex and Age in El Cerrito
According to the poverty statistics in El Cerrito, males aged 6 to 11 years and females aged 6 to 11 years are the age groups that are most secure financially, with 100.0% of males and 100.0% of females in these age groups living above the poverty line.
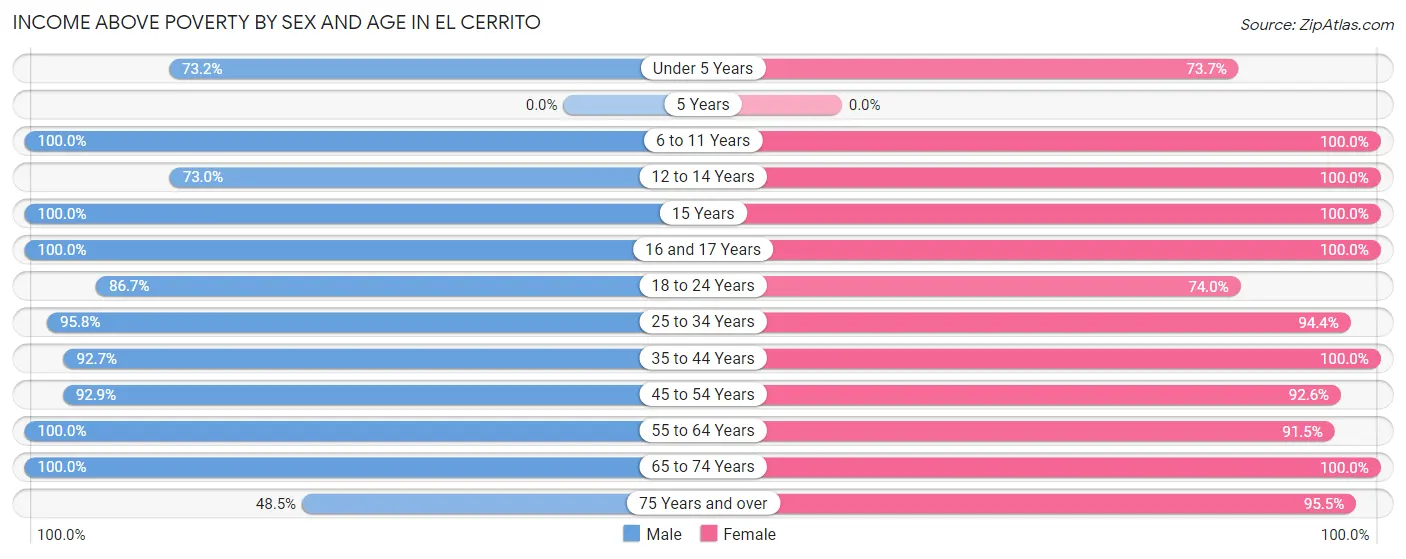
| Age Bracket | Male | Female |
| Under 5 Years | 90 (73.2%) | 151 (73.7%) |
| 5 Years | 0 (0.0%) | 0 (0.0%) |
| 6 to 11 Years | 43 (100.0%) | 213 (100.0%) |
| 12 to 14 Years | 84 (73.0%) | 118 (100.0%) |
| 15 Years | 97 (100.0%) | 35 (100.0%) |
| 16 and 17 Years | 49 (100.0%) | 68 (100.0%) |
| 18 to 24 Years | 222 (86.7%) | 279 (74.0%) |
| 25 to 34 Years | 413 (95.8%) | 221 (94.4%) |
| 35 to 44 Years | 281 (92.7%) | 345 (100.0%) |
| 45 to 54 Years | 457 (92.9%) | 365 (92.6%) |
| 55 to 64 Years | 402 (100.0%) | 428 (91.4%) |
| 65 to 74 Years | 143 (100.0%) | 193 (100.0%) |
| 75 Years and over | 33 (48.5%) | 105 (95.5%) |
| Total | 2,314 (90.7%) | 2,521 (91.3%) |
Income Below Poverty Among Married-Couple Families in El Cerrito
The poverty statistics for married-couple families in El Cerrito show that 1.4% or 12 of the total 877 families live below the poverty line. Families with 1 or 2 children have the highest poverty rate of 4.2%, comprising of 12 families. On the other hand, families with no children have the lowest poverty rate of 0.0%, which includes 0 families.
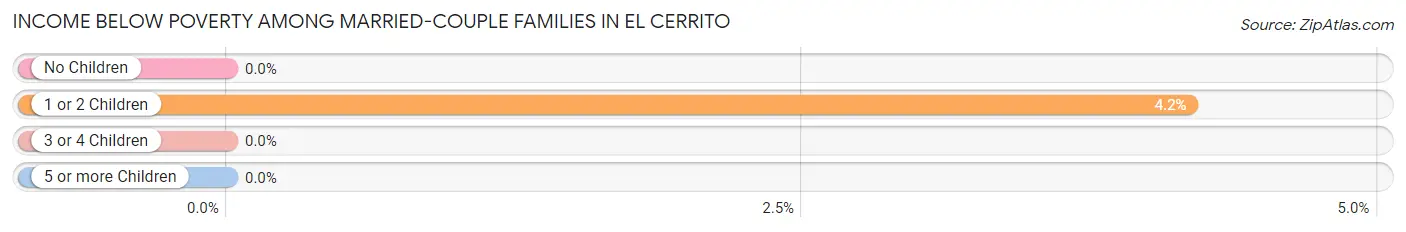
| Children | Above Poverty | Below Poverty |
| No Children | 547 (100.0%) | 0 (0.0%) |
| 1 or 2 Children | 275 (95.8%) | 12 (4.2%) |
| 3 or 4 Children | 43 (100.0%) | 0 (0.0%) |
| 5 or more Children | 0 (0.0%) | 0 (0.0%) |
| Total | 865 (98.6%) | 12 (1.4%) |
Income Below Poverty Among Single-Parent Households in El Cerrito
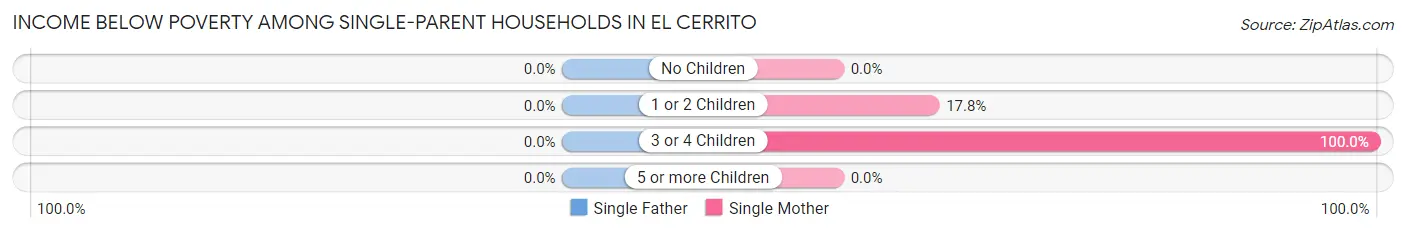
| Children | Single Father | Single Mother |
| No Children | 0 (0.0%) | 0 (0.0%) |
| 1 or 2 Children | 0 (0.0%) | 29 (17.8%) |
| 3 or 4 Children | 0 (0.0%) | 25 (100.0%) |
| 5 or more Children | 0 (0.0%) | 0 (0.0%) |
| Total | 0 (0.0%) | 54 (19.4%) |
Income Below Poverty Among Married-Couple vs Single-Parent Households in El Cerrito
The poverty data for El Cerrito shows that 12 of the married-couple family households (1.4%) and 54 of the single-parent households (14.4%) are living below the poverty level. Within the married-couple family households, those with 1 or 2 children have the highest poverty rate, with 12 households (4.2%) falling below the poverty line. Among the single-parent households, those with 3 or 4 children have the highest poverty rate, with 25 household (100.0%) living below poverty.
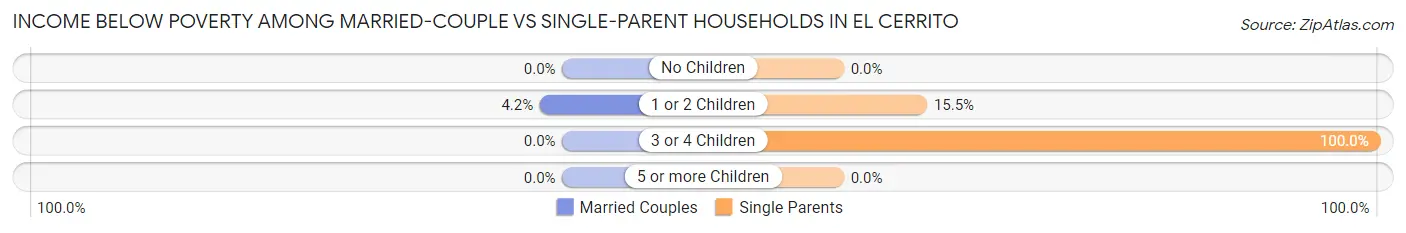
| Children | Married-Couple Families | Single-Parent Households |
| No Children | 0 (0.0%) | 0 (0.0%) |
| 1 or 2 Children | 12 (4.2%) | 29 (15.5%) |
| 3 or 4 Children | 0 (0.0%) | 25 (100.0%) |
| 5 or more Children | 0 (0.0%) | 0 (0.0%) |
| Total | 12 (1.4%) | 54 (14.4%) |
Race in El Cerrito
The most populous races in El Cerrito are White / Caucasian (2,888 | 54.2%), Hispanic or Latino (2,679 | 50.3%), and Some other Race (1,223 | 23.0%).
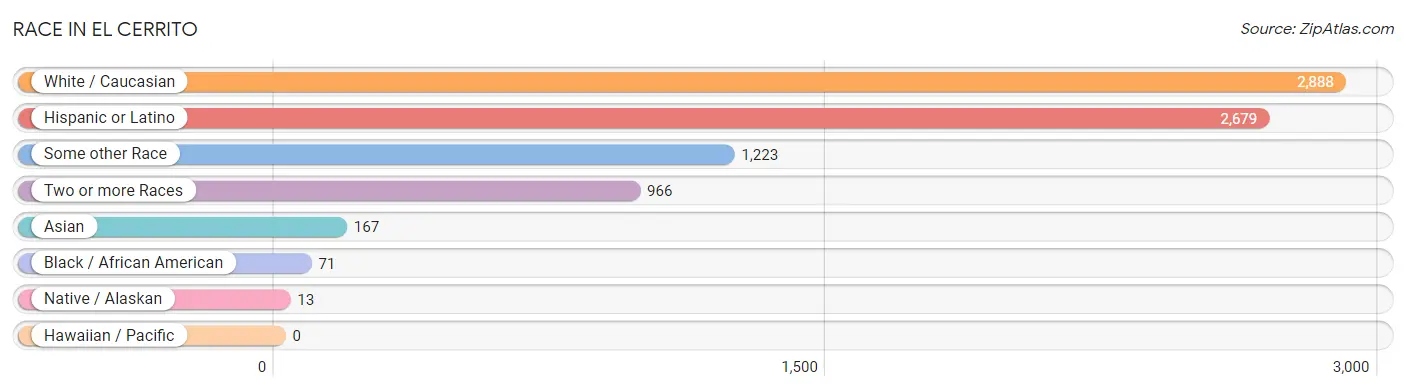
| Race | # Population | % Population |
| Asian | 167 | 3.1% |
| Black / African American | 71 | 1.3% |
| Hawaiian / Pacific | 0 | 0.0% |
| Hispanic or Latino | 2,679 | 50.3% |
| Native / Alaskan | 13 | 0.2% |
| White / Caucasian | 2,888 | 54.2% |
| Two or more Races | 966 | 18.1% |
| Some other Race | 1,223 | 23.0% |
| Total | 5,328 | 100.0% |
Ancestry in El Cerrito
The most populous ancestries reported in El Cerrito are Mexican (2,484 | 46.6%), German (641 | 12.0%), Irish (458 | 8.6%), English (361 | 6.8%), and Korean (330 | 6.2%), together accounting for 80.2% of all El Cerrito residents.
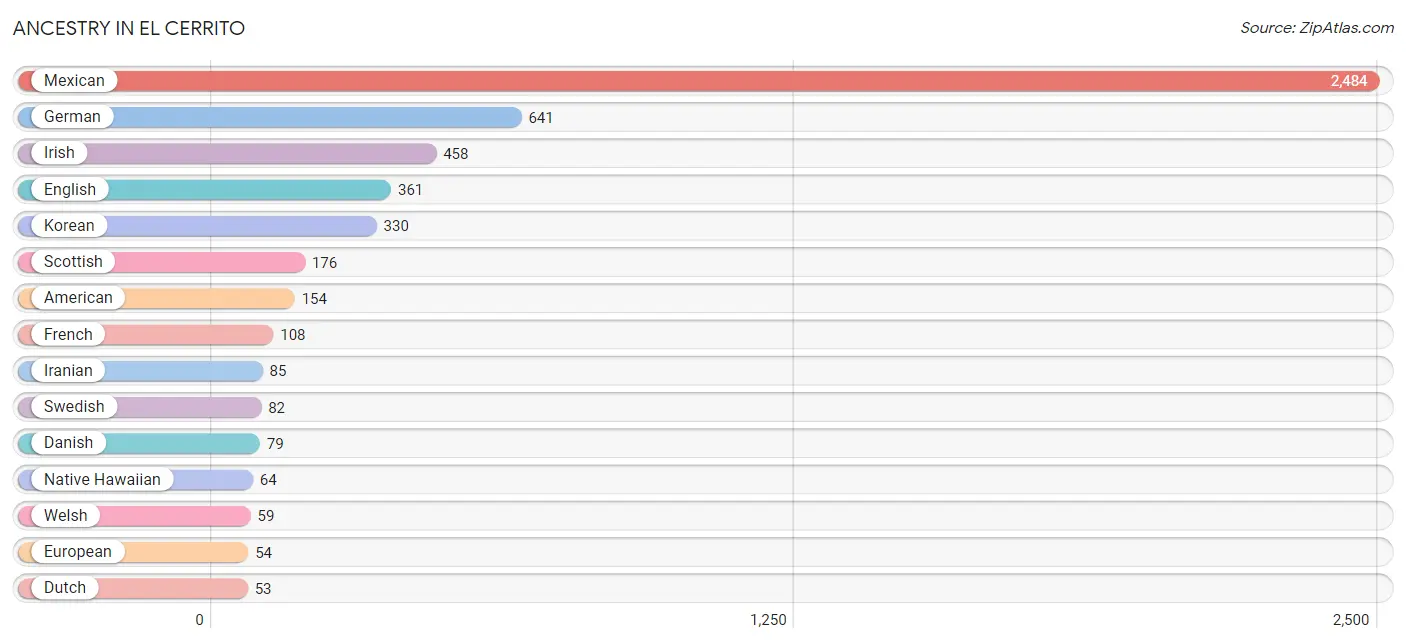
| Ancestry | # Population | % Population |
| American | 154 | 2.9% |
| Australian | 8 | 0.2% |
| Belgian | 18 | 0.3% |
| Bhutanese | 13 | 0.2% |
| Burmese | 11 | 0.2% |
| Canadian | 19 | 0.4% |
| Central American | 32 | 0.6% |
| Cherokee | 44 | 0.8% |
| Danish | 79 | 1.5% |
| Dutch | 53 | 1.0% |
| Ecuadorian | 13 | 0.2% |
| English | 361 | 6.8% |
| European | 54 | 1.0% |
| French | 108 | 2.0% |
| German | 641 | 12.0% |
| Guatemalan | 11 | 0.2% |
| Indian (Asian) | 5 | 0.1% |
| Iranian | 85 | 1.6% |
| Irish | 458 | 8.6% |
| Italian | 38 | 0.7% |
| Korean | 330 | 6.2% |
| Mexican | 2,484 | 46.6% |
| Mexican American Indian | 18 | 0.3% |
| Native Hawaiian | 64 | 1.2% |
| Polish | 8 | 0.2% |
| Pueblo | 13 | 0.2% |
| Puerto Rican | 45 | 0.8% |
| Russian | 37 | 0.7% |
| Salvadoran | 21 | 0.4% |
| Scotch-Irish | 29 | 0.5% |
| Scottish | 176 | 3.3% |
| South American | 13 | 0.2% |
| Spaniard | 9 | 0.2% |
| Swedish | 82 | 1.5% |
| Swiss | 9 | 0.2% |
| Welsh | 59 | 1.1% |
| Yaqui | 8 | 0.2% |
| Yugoslavian | 9 | 0.2% | View All 38 Rows |
Immigrants in El Cerrito
The most numerous immigrant groups reported in El Cerrito came from Latin America (807 | 15.1%), Central America (794 | 14.9%), Mexico (783 | 14.7%), Asia (194 | 3.6%), and Philippines (151 | 2.8%), together accounting for 51.2% of all El Cerrito residents.
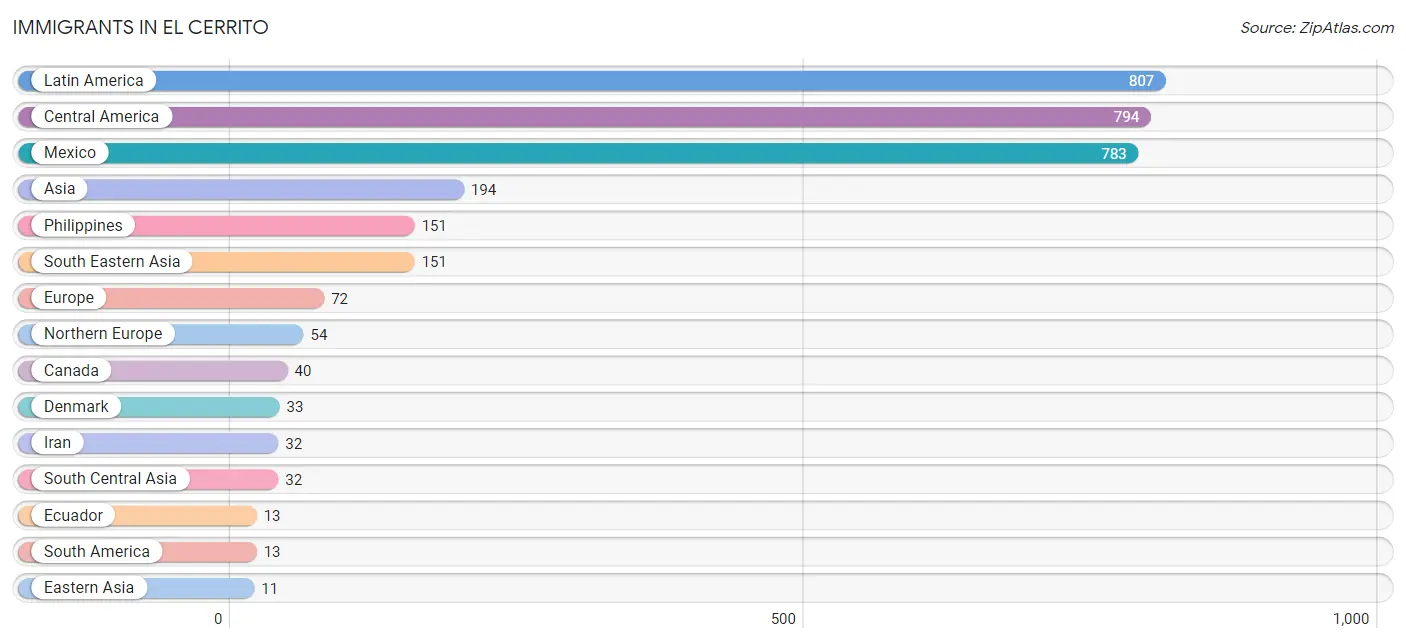
| Immigration Origin | # Population | % Population |
| Asia | 194 | 3.6% |
| Canada | 40 | 0.7% |
| Central America | 794 | 14.9% |
| Denmark | 33 | 0.6% |
| Eastern Asia | 11 | 0.2% |
| Ecuador | 13 | 0.2% |
| El Salvador | 11 | 0.2% |
| England | 10 | 0.2% |
| Europe | 72 | 1.3% |
| Germany | 9 | 0.2% |
| Iran | 32 | 0.6% |
| Korea | 11 | 0.2% |
| Latin America | 807 | 15.1% |
| Mexico | 783 | 14.7% |
| Northern Europe | 54 | 1.0% |
| Philippines | 151 | 2.8% |
| South America | 13 | 0.2% |
| South Central Asia | 32 | 0.6% |
| South Eastern Asia | 151 | 2.8% |
| Southern Europe | 9 | 0.2% |
| Spain | 9 | 0.2% |
| Western Europe | 9 | 0.2% | View All 22 Rows |
Sex and Age in El Cerrito
Sex and Age in El Cerrito
The most populous age groups in El Cerrito are 45 to 49 Years (271 | 10.6%) for men and 55 to 59 Years (336 | 12.2%) for women.
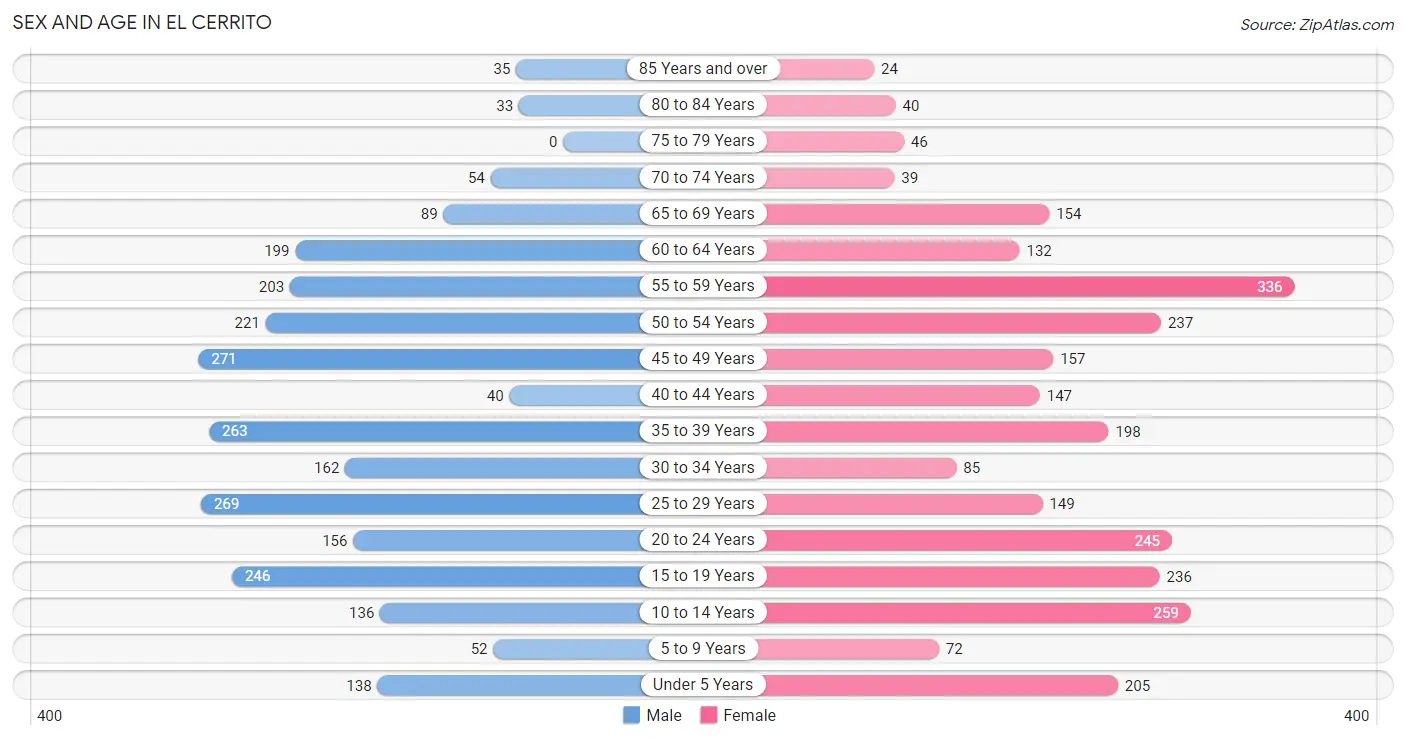
| Age Bracket | Male | Female |
| Under 5 Years | 138 (5.4%) | 205 (7.4%) |
| 5 to 9 Years | 52 (2.0%) | 72 (2.6%) |
| 10 to 14 Years | 136 (5.3%) | 259 (9.4%) |
| 15 to 19 Years | 246 (9.6%) | 236 (8.6%) |
| 20 to 24 Years | 156 (6.1%) | 245 (8.9%) |
| 25 to 29 Years | 269 (10.5%) | 149 (5.4%) |
| 30 to 34 Years | 162 (6.3%) | 85 (3.1%) |
| 35 to 39 Years | 263 (10.2%) | 198 (7.2%) |
| 40 to 44 Years | 40 (1.6%) | 147 (5.3%) |
| 45 to 49 Years | 271 (10.6%) | 157 (5.7%) |
| 50 to 54 Years | 221 (8.6%) | 237 (8.6%) |
| 55 to 59 Years | 203 (7.9%) | 336 (12.2%) |
| 60 to 64 Years | 199 (7.7%) | 132 (4.8%) |
| 65 to 69 Years | 89 (3.5%) | 154 (5.6%) |
| 70 to 74 Years | 54 (2.1%) | 39 (1.4%) |
| 75 to 79 Years | 0 (0.0%) | 46 (1.7%) |
| 80 to 84 Years | 33 (1.3%) | 40 (1.5%) |
| 85 Years and over | 35 (1.4%) | 24 (0.9%) |
| Total | 2,567 (100.0%) | 2,761 (100.0%) |
Families and Households in El Cerrito
Median Family Size in El Cerrito
The median family size in El Cerrito is 3.86 persons per family, with single female/mother families (278 | 22.2%) accounting for the largest median family size of 4.36 persons per family. On the other hand, single male/father families (97 | 7.7%) represent the smallest median family size with 2.20 persons per family.
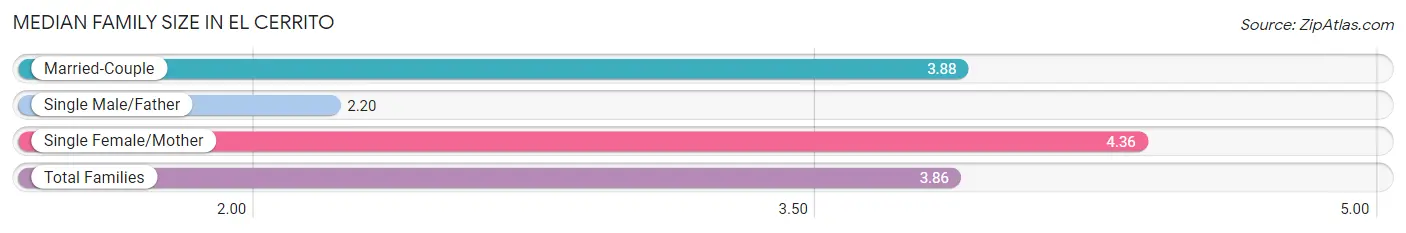
| Family Type | # Families | Family Size |
| Married-Couple | 877 (70.1%) | 3.88 |
| Single Male/Father | 97 (7.7%) | 2.20 |
| Single Female/Mother | 278 (22.2%) | 4.36 |
| Total Families | 1,252 (100.0%) | 3.86 |
Median Household Size in El Cerrito
The median household size in El Cerrito is 3.69 persons per household, with single female/mother households (278 | 19.4%) accounting for the largest median household size of 5.02 persons per household. non-family households (184 | 12.8%) represent the smallest median household size with 1.05 persons per household.
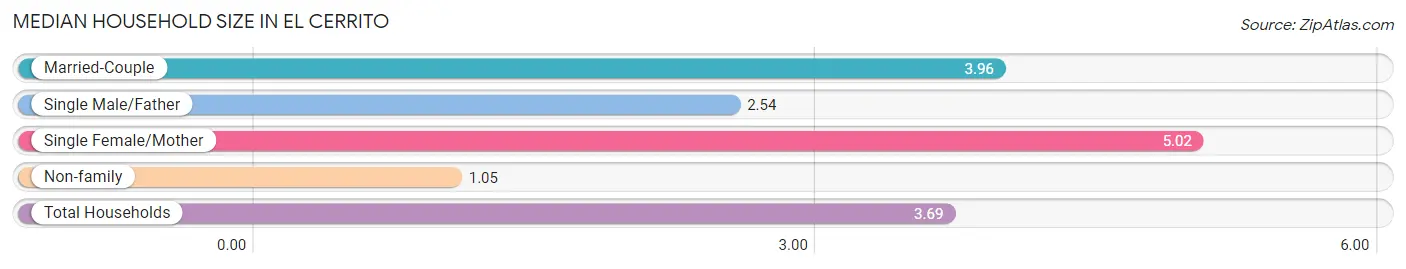
| Household Type | # Households | Household Size |
| Married-Couple | 877 (61.1%) | 3.96 |
| Single Male/Father | 97 (6.8%) | 2.54 |
| Single Female/Mother | 278 (19.4%) | 5.02 |
| Non-family | 184 (12.8%) | 1.05 |
| Total Households | 1,436 (100.0%) | 3.69 |
Household Size by Marriage Status in El Cerrito
Out of a total of 1,436 households in El Cerrito, 1,252 (87.2%) are family households, while 184 (12.8%) are nonfamily households. The most numerous type of family households are 4-person households, comprising 406, and the most common type of nonfamily households are 1-person households, comprising 173.
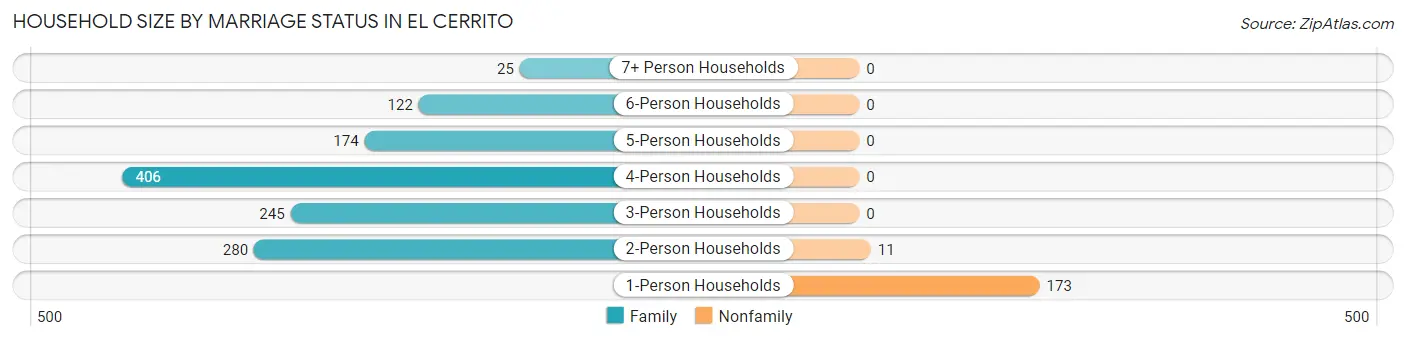
| Household Size | Family Households | Nonfamily Households |
| 1-Person Households | - | 173 (12.0%) |
| 2-Person Households | 280 (19.5%) | 11 (0.8%) |
| 3-Person Households | 245 (17.1%) | 0 (0.0%) |
| 4-Person Households | 406 (28.3%) | 0 (0.0%) |
| 5-Person Households | 174 (12.1%) | 0 (0.0%) |
| 6-Person Households | 122 (8.5%) | 0 (0.0%) |
| 7+ Person Households | 25 (1.7%) | 0 (0.0%) |
| Total | 1,252 (87.2%) | 184 (12.8%) |
Female Fertility in El Cerrito
Fertility by Age in El Cerrito
Average fertility rate in El Cerrito is 15.0 births per 1,000 women. Women in the age bracket of 20 to 34 years have the highest fertility rate with 29.0 births per 1,000 women. Women in the age bracket of 20 to 34 years acount for 77.8% of all women with births.
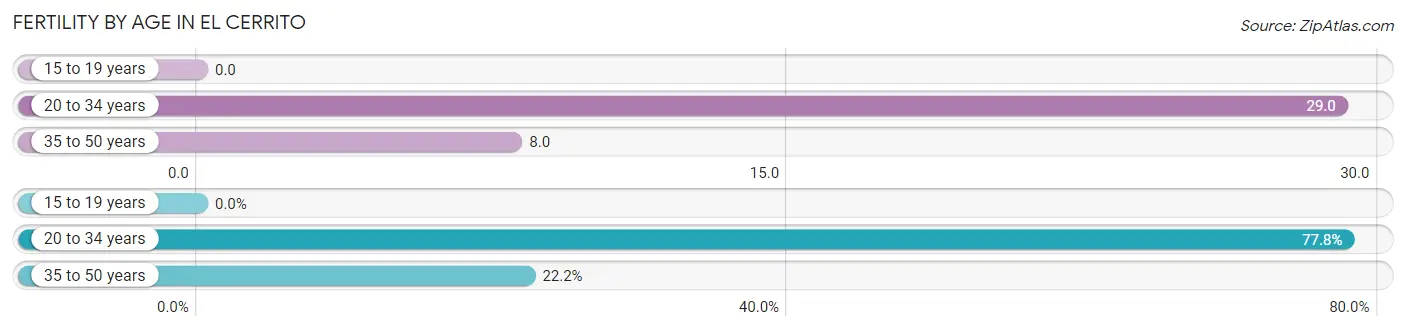
| Age Bracket | Women with Births | Births / 1,000 Women |
| 15 to 19 years | 0 (0.0%) | 0.0 |
| 20 to 34 years | 14 (77.8%) | 29.0 |
| 35 to 50 years | 4 (22.2%) | 8.0 |
| Total | 18 (100.0%) | 15.0 |
Fertility by Age by Marriage Status in El Cerrito
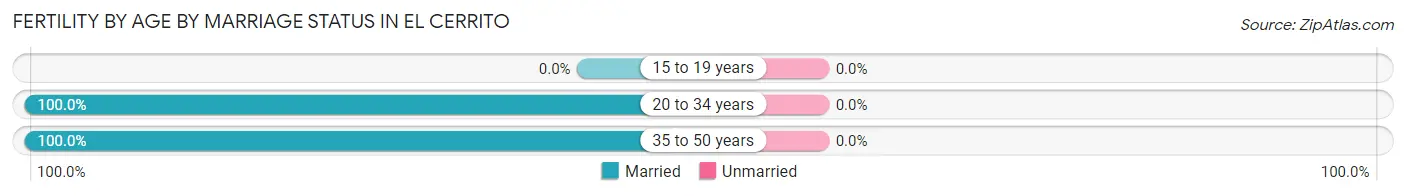
| Age Bracket | Married | Unmarried |
| 15 to 19 years | 0 (0.0%) | 0 (0.0%) |
| 20 to 34 years | 14 (100.0%) | 0 (0.0%) |
| 35 to 50 years | 4 (100.0%) | 0 (0.0%) |
| Total | 18 (100.0%) | 0 (0.0%) |
Fertility by Education in El Cerrito
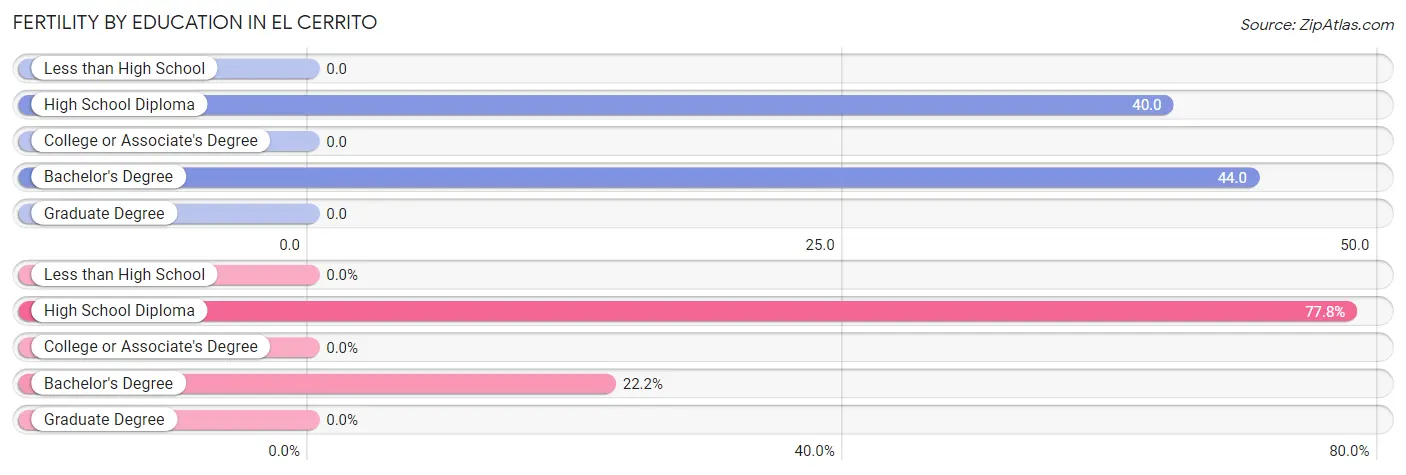
| Educational Attainment | Women with Births | Births / 1,000 Women |
| Less than High School | 0 (0.0%) | 0.0 |
| High School Diploma | 14 (77.8%) | 40.0 |
| College or Associate's Degree | 0 (0.0%) | 0.0 |
| Bachelor's Degree | 4 (22.2%) | 44.0 |
| Graduate Degree | 0 (0.0%) | 0.0 |
| Total | 18 (100.0%) | 15.0 |
Fertility by Education by Marriage Status in El Cerrito
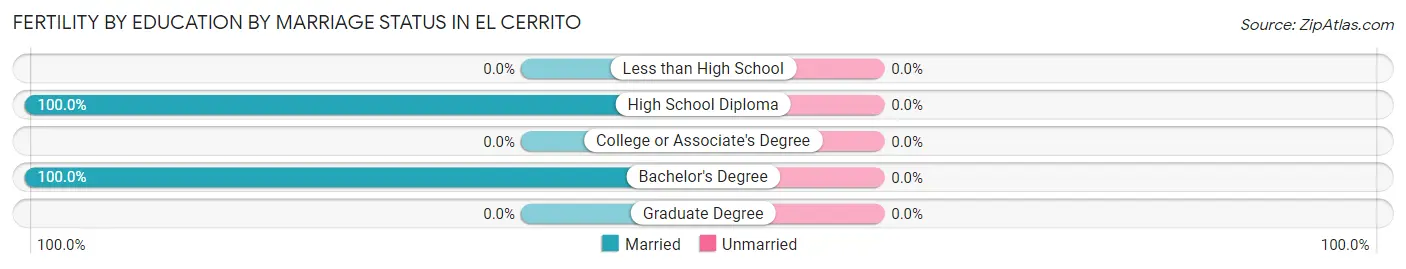
| Educational Attainment | Married | Unmarried |
| Less than High School | 0 (0.0%) | 0 (0.0%) |
| High School Diploma | 14 (100.0%) | 0 (0.0%) |
| College or Associate's Degree | 0 (0.0%) | 0 (0.0%) |
| Bachelor's Degree | 4 (100.0%) | 0 (0.0%) |
| Graduate Degree | 0 (0.0%) | 0 (0.0%) |
| Total | 18 (100.0%) | 0 (0.0%) |
Employment Characteristics in El Cerrito
Employment by Class of Employer in El Cerrito
Among the 2,561 employed individuals in El Cerrito, private company employees (1,779 | 69.5%), self-employed (not incorporated) (181 | 7.1%), and federal government employees (173 | 6.8%) make up the most common classes of employment.
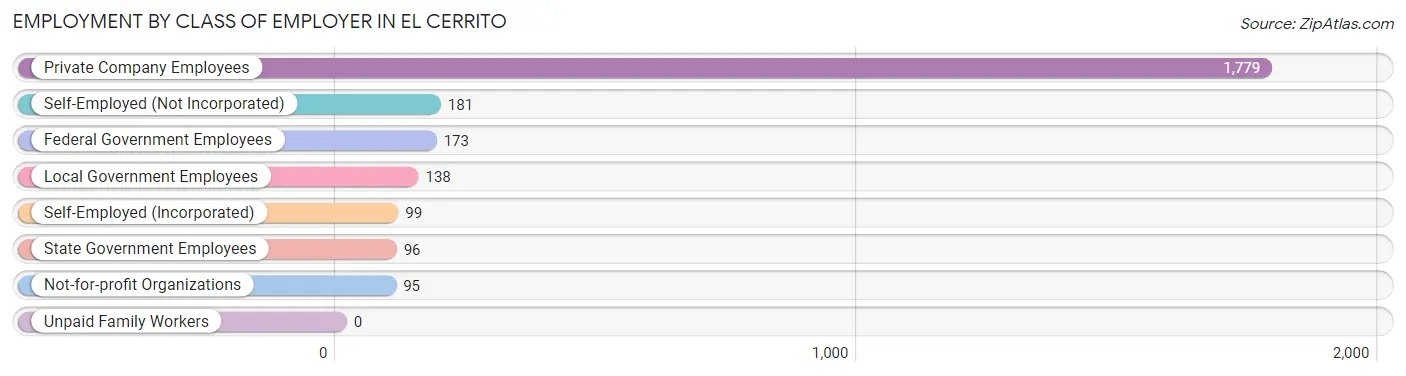
| Employer Class | # Employees | % Employees |
| Private Company Employees | 1,779 | 69.5% |
| Self-Employed (Incorporated) | 99 | 3.9% |
| Self-Employed (Not Incorporated) | 181 | 7.1% |
| Not-for-profit Organizations | 95 | 3.7% |
| Local Government Employees | 138 | 5.4% |
| State Government Employees | 96 | 3.7% |
| Federal Government Employees | 173 | 6.8% |
| Unpaid Family Workers | 0 | 0.0% |
| Total | 2,561 | 100.0% |
Employment Status by Age in El Cerrito
According to the labor force statistics for El Cerrito, out of the total population over 16 years of age (4,333), 62.3% or 2,699 individuals are in the labor force, with 3.1% or 84 of them unemployed. The age group with the highest labor force participation rate is 25 to 29 years, with 93.1% or 389 individuals in the labor force. Within the labor force, the 30 to 34 years age range has the highest percentage of unemployed individuals, with 12.3% or 23 of them being unemployed.
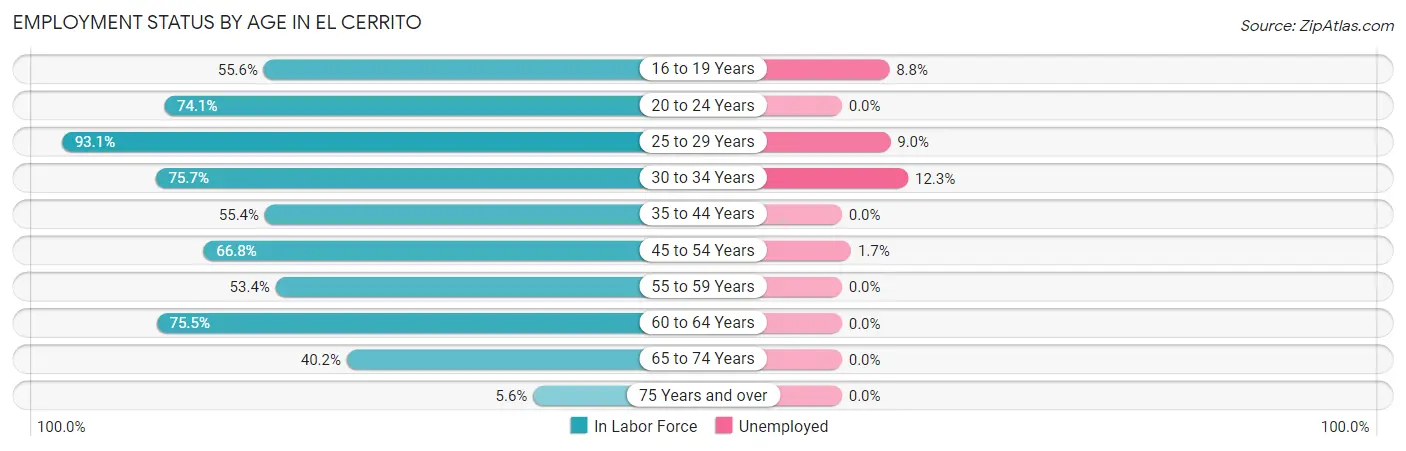
| Age Bracket | In Labor Force | Unemployed |
| 16 to 19 Years | 194 (55.6%) | 17 (8.8%) |
| 20 to 24 Years | 297 (74.1%) | 0 (0.0%) |
| 25 to 29 Years | 389 (93.1%) | 35 (9.0%) |
| 30 to 34 Years | 187 (75.7%) | 23 (12.3%) |
| 35 to 44 Years | 359 (55.4%) | 0 (0.0%) |
| 45 to 54 Years | 592 (66.8%) | 10 (1.7%) |
| 55 to 59 Years | 288 (53.4%) | 0 (0.0%) |
| 60 to 64 Years | 250 (75.5%) | 0 (0.0%) |
| 65 to 74 Years | 135 (40.2%) | 0 (0.0%) |
| 75 Years and over | 10 (5.6%) | 0 (0.0%) |
| Total | 2,699 (62.3%) | 84 (3.1%) |
Employment Status by Educational Attainment in El Cerrito
According to labor force statistics for El Cerrito, 67.3% of individuals (2,065) out of the total population between 25 and 64 years of age (3,069) are in the labor force, with 3.3% or 68 of them being unemployed. The group with the highest labor force participation rate are those with the educational attainment of college / associate degree, with 74.7% or 796 individuals in the labor force. Within the labor force, individuals with college / associate degree education have the highest percentage of unemployment, with 7.3% or 58 of them being unemployed.
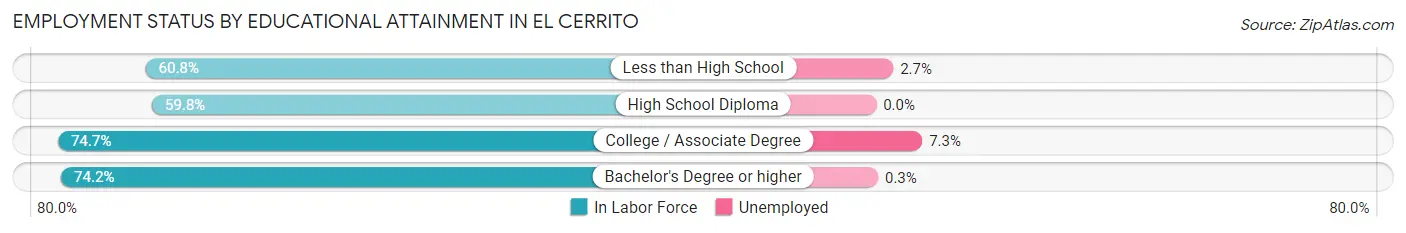
| Educational Attainment | In Labor Force | Unemployed |
| Less than High School | 330 (60.8%) | 15 (2.7%) |
| High School Diploma | 602 (59.8%) | 0 (0.0%) |
| College / Associate Degree | 796 (74.7%) | 78 (7.3%) |
| Bachelor's Degree or higher | 337 (74.2%) | 1 (0.3%) |
| Total | 2,065 (67.3%) | 101 (3.3%) |
Employment Occupations by Sex in El Cerrito
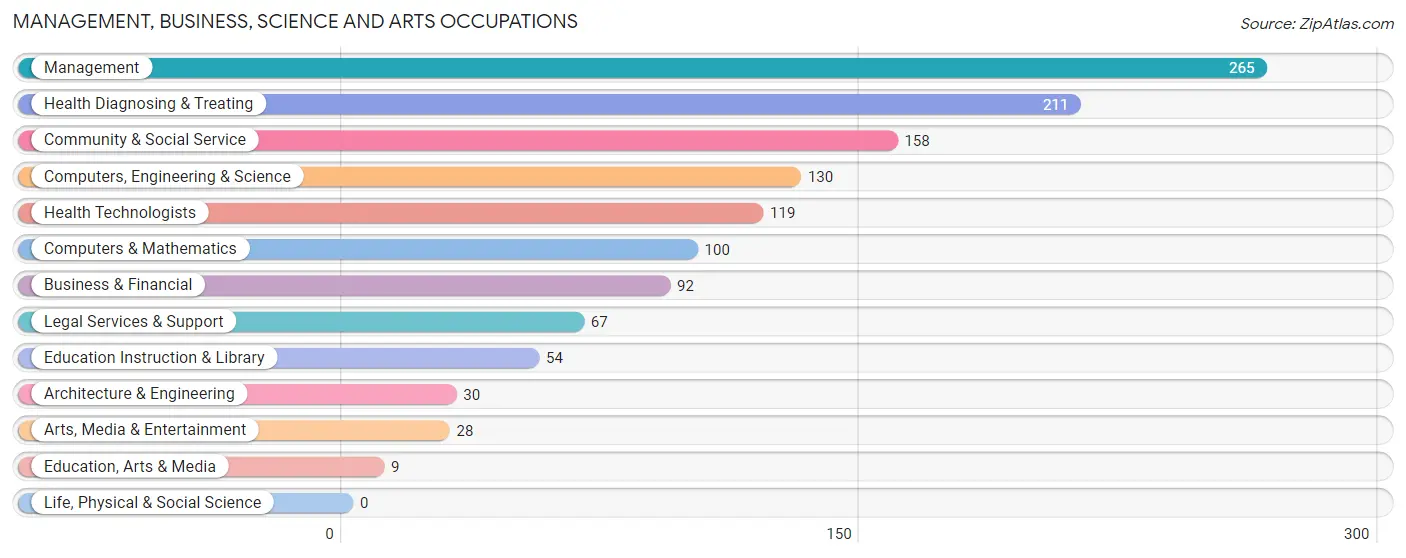
Management, Business, Science and Arts Occupations
The most common Management, Business, Science and Arts occupations in El Cerrito are Management (265 | 10.1%), Health Diagnosing & Treating (211 | 8.1%), Community & Social Service (158 | 6.0%), Computers, Engineering & Science (130 | 5.0%), and Health Technologists (119 | 4.5%).
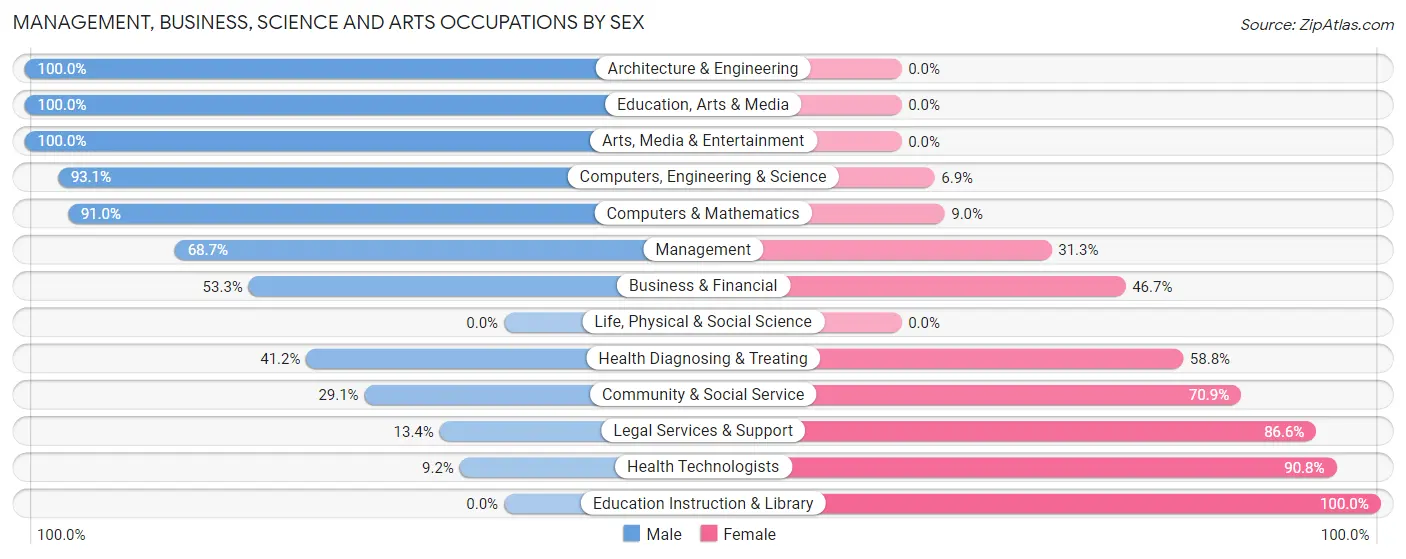
Management, Business, Science and Arts Occupations by Sex
Within the Management, Business, Science and Arts occupations in El Cerrito, the most male-oriented occupations are Architecture & Engineering (100.0%), Education, Arts & Media (100.0%), and Arts, Media & Entertainment (100.0%), while the most female-oriented occupations are Education Instruction & Library (100.0%), Health Technologists (90.8%), and Legal Services & Support (86.6%).
| Occupation | Male | Female |
| Management | 182 (68.7%) | 83 (31.3%) |
| Business & Financial | 49 (53.3%) | 43 (46.7%) |
| Computers, Engineering & Science | 121 (93.1%) | 9 (6.9%) |
| Computers & Mathematics | 91 (91.0%) | 9 (9.0%) |
| Architecture & Engineering | 30 (100.0%) | 0 (0.0%) |
| Life, Physical & Social Science | 0 (0.0%) | 0 (0.0%) |
| Community & Social Service | 46 (29.1%) | 112 (70.9%) |
| Education, Arts & Media | 9 (100.0%) | 0 (0.0%) |
| Legal Services & Support | 9 (13.4%) | 58 (86.6%) |
| Education Instruction & Library | 0 (0.0%) | 54 (100.0%) |
| Arts, Media & Entertainment | 28 (100.0%) | 0 (0.0%) |
| Health Diagnosing & Treating | 87 (41.2%) | 124 (58.8%) |
| Health Technologists | 11 (9.2%) | 108 (90.8%) |
| Total (Category) | 485 (56.7%) | 371 (43.3%) |
| Total (Overall) | 1,416 (54.1%) | 1,200 (45.9%) |
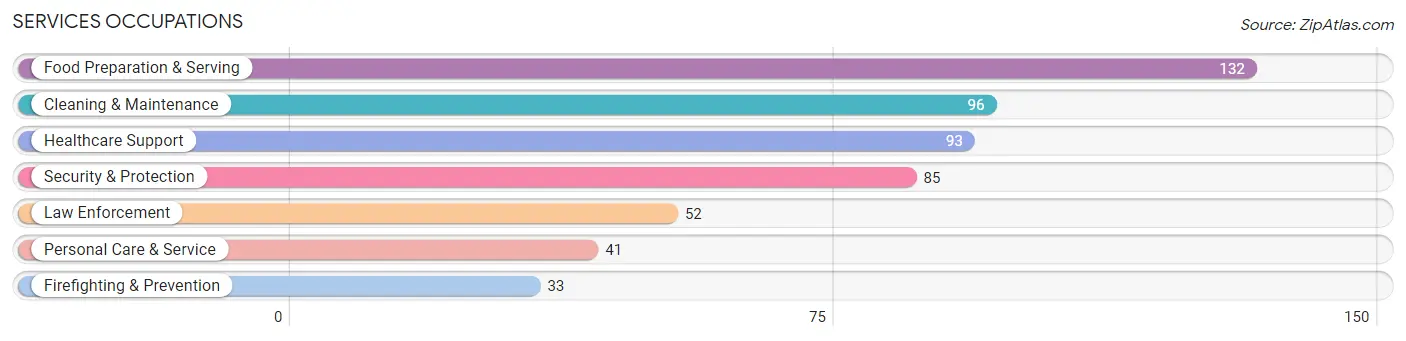
Services Occupations
The most common Services occupations in El Cerrito are Food Preparation & Serving (132 | 5.1%), Cleaning & Maintenance (96 | 3.7%), Healthcare Support (93 | 3.6%), Security & Protection (85 | 3.3%), and Law Enforcement (52 | 2.0%).
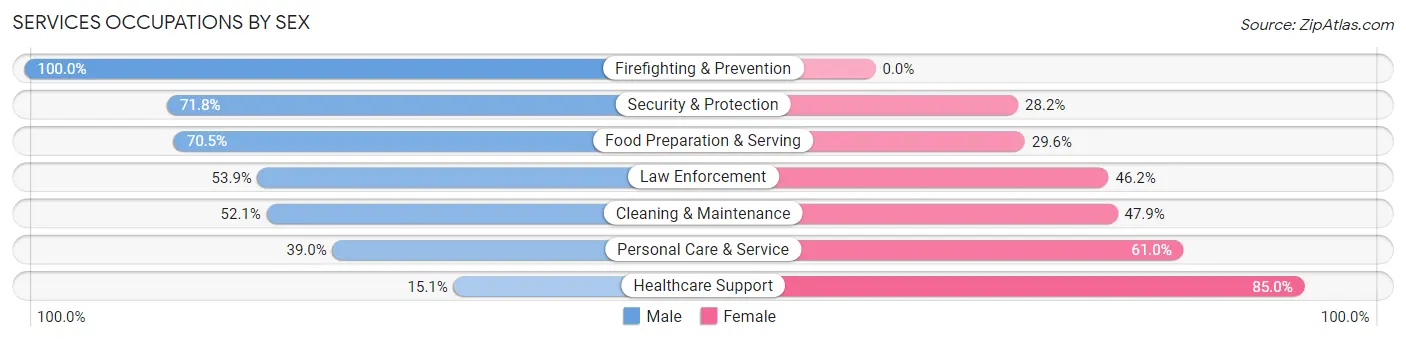
Services Occupations by Sex
Within the Services occupations in El Cerrito, the most male-oriented occupations are Firefighting & Prevention (100.0%), Security & Protection (71.8%), and Food Preparation & Serving (70.5%), while the most female-oriented occupations are Healthcare Support (85.0%), Personal Care & Service (61.0%), and Cleaning & Maintenance (47.9%).
| Occupation | Male | Female |
| Healthcare Support | 14 (15.0%) | 79 (85.0%) |
| Security & Protection | 61 (71.8%) | 24 (28.2%) |
| Firefighting & Prevention | 33 (100.0%) | 0 (0.0%) |
| Law Enforcement | 28 (53.8%) | 24 (46.2%) |
| Food Preparation & Serving | 93 (70.5%) | 39 (29.5%) |
| Cleaning & Maintenance | 50 (52.1%) | 46 (47.9%) |
| Personal Care & Service | 16 (39.0%) | 25 (61.0%) |
| Total (Category) | 234 (52.3%) | 213 (47.6%) |
| Total (Overall) | 1,416 (54.1%) | 1,200 (45.9%) |
Sales and Office Occupations
The most common Sales and Office occupations in El Cerrito are Office & Administration (483 | 18.5%), and Sales & Related (200 | 7.6%).
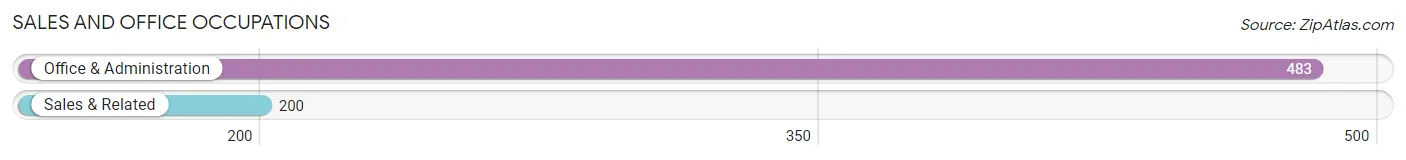
Sales and Office Occupations by Sex

| Occupation | Male | Female |
| Sales & Related | 158 (79.0%) | 42 (21.0%) |
| Office & Administration | 12 (2.5%) | 471 (97.5%) |
| Total (Category) | 170 (24.9%) | 513 (75.1%) |
| Total (Overall) | 1,416 (54.1%) | 1,200 (45.9%) |
Natural Resources, Construction and Maintenance Occupations
The most common Natural Resources, Construction and Maintenance occupations in El Cerrito are Construction & Extraction (150 | 5.7%), Installation, Maintenance & Repair (69 | 2.6%), and Farming, Fishing & Forestry (15 | 0.6%).
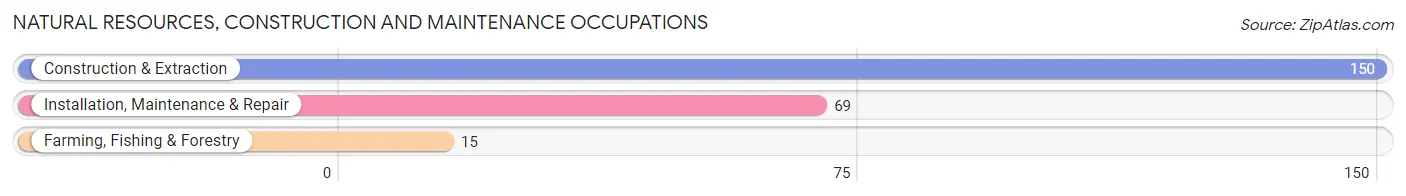
Natural Resources, Construction and Maintenance Occupations by Sex
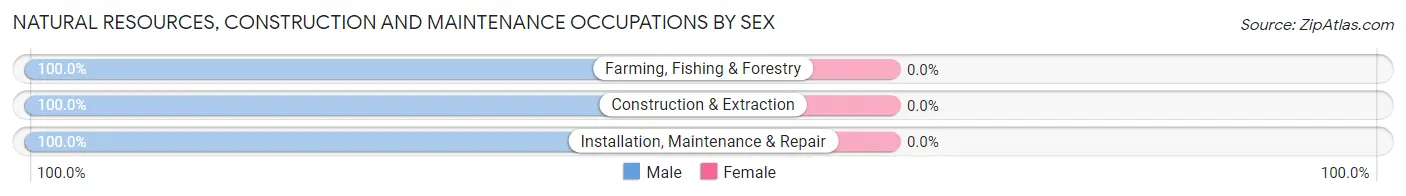
| Occupation | Male | Female |
| Farming, Fishing & Forestry | 15 (100.0%) | 0 (0.0%) |
| Construction & Extraction | 150 (100.0%) | 0 (0.0%) |
| Installation, Maintenance & Repair | 69 (100.0%) | 0 (0.0%) |
| Total (Category) | 234 (100.0%) | 0 (0.0%) |
| Total (Overall) | 1,416 (54.1%) | 1,200 (45.9%) |
Production, Transportation and Moving Occupations
The most common Production, Transportation and Moving occupations in El Cerrito are Production (187 | 7.1%), Transportation (159 | 6.1%), and Material Moving (50 | 1.9%).
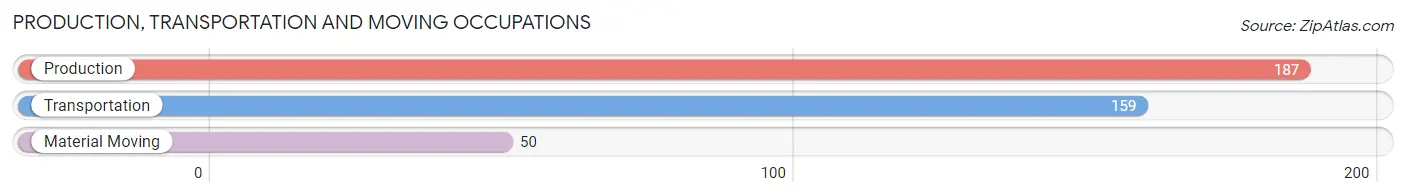
Production, Transportation and Moving Occupations by Sex
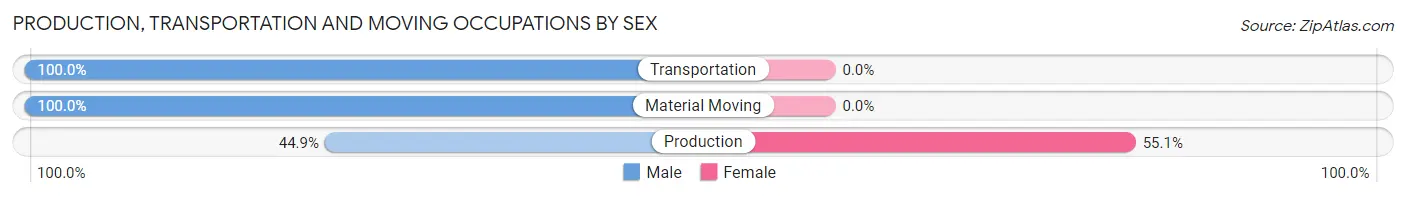
| Occupation | Male | Female |
| Production | 84 (44.9%) | 103 (55.1%) |
| Transportation | 159 (100.0%) | 0 (0.0%) |
| Material Moving | 50 (100.0%) | 0 (0.0%) |
| Total (Category) | 293 (74.0%) | 103 (26.0%) |
| Total (Overall) | 1,416 (54.1%) | 1,200 (45.9%) |
Employment Industries by Sex in El Cerrito
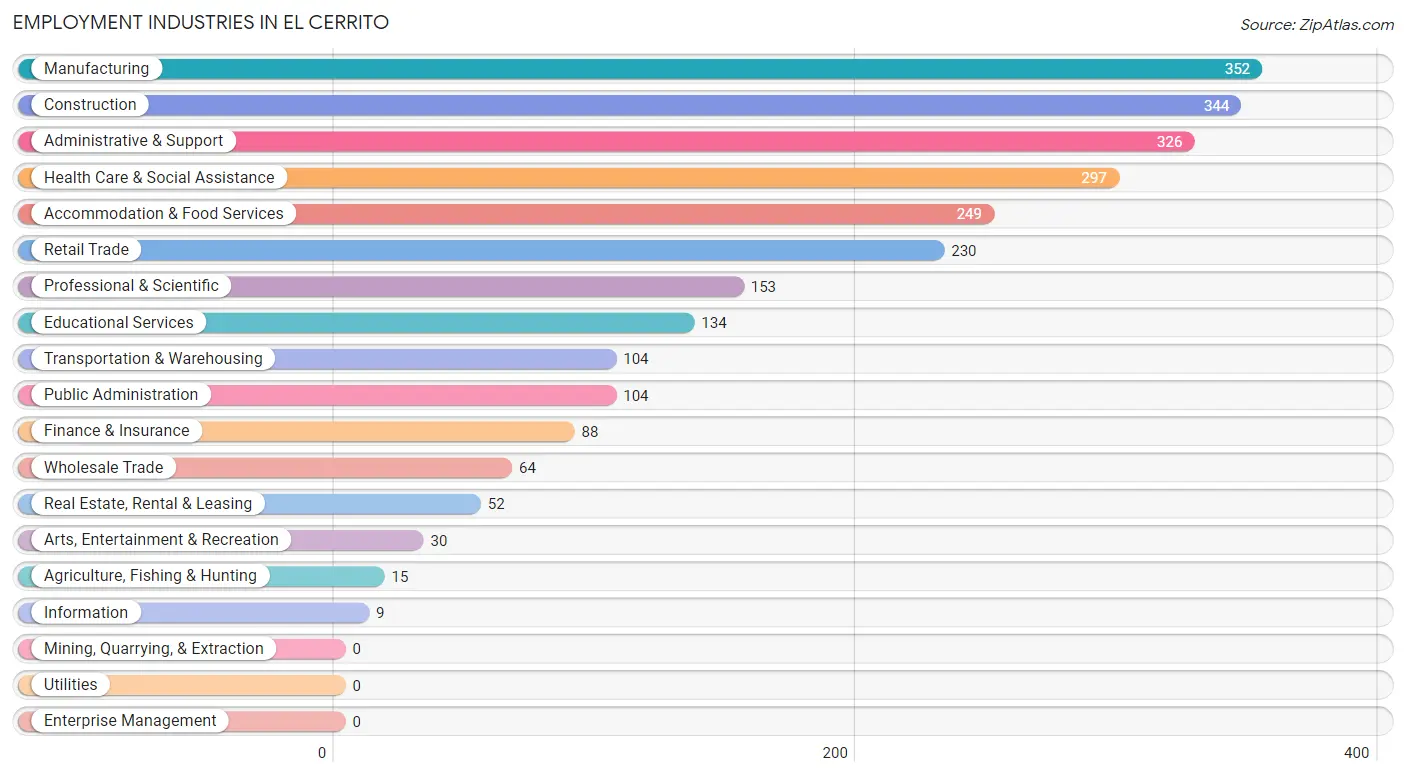
Employment Industries in El Cerrito
The major employment industries in El Cerrito include Manufacturing (352 | 13.5%), Construction (344 | 13.2%), Administrative & Support (326 | 12.5%), Health Care & Social Assistance (297 | 11.4%), and Accommodation & Food Services (249 | 9.5%).
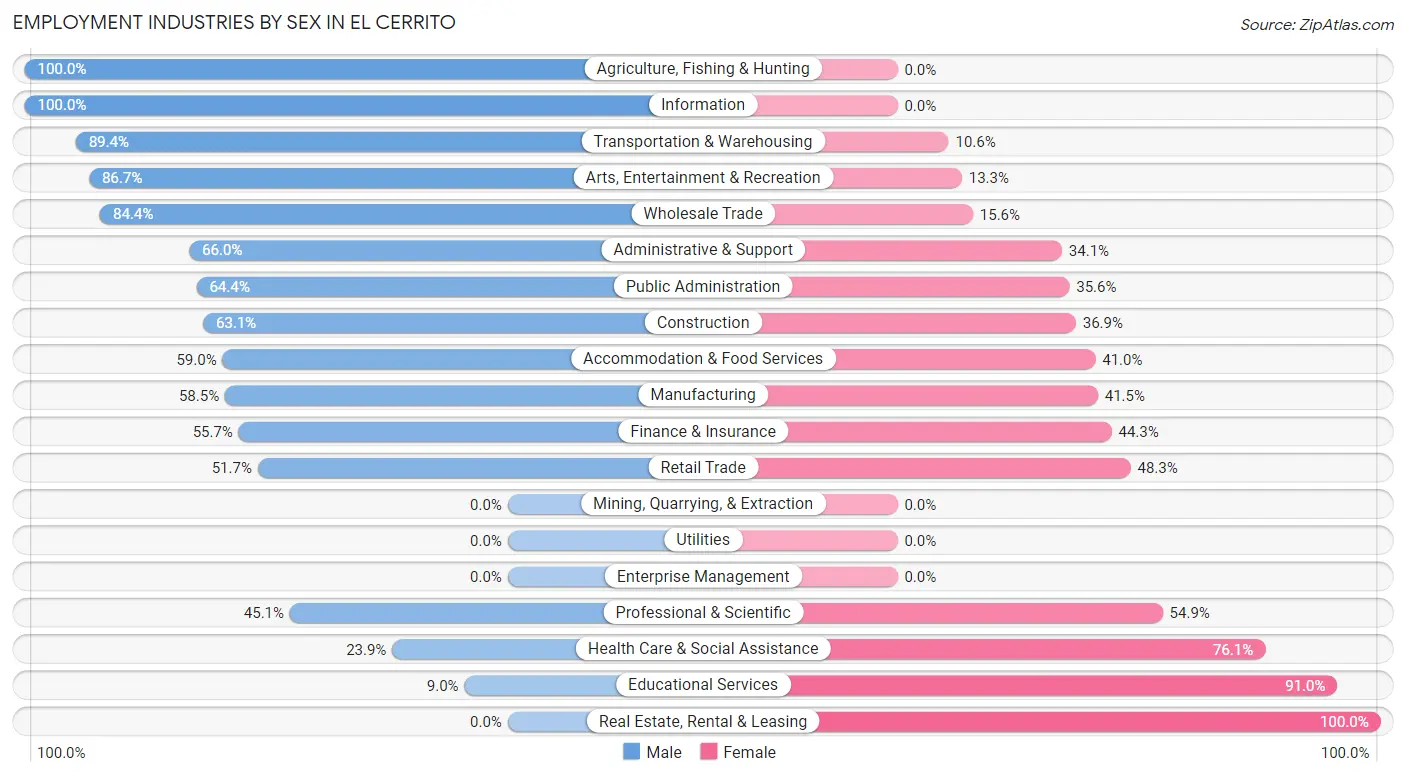
Employment Industries by Sex in El Cerrito
The El Cerrito industries that see more men than women are Agriculture, Fishing & Hunting (100.0%), Information (100.0%), and Transportation & Warehousing (89.4%), whereas the industries that tend to have a higher number of women are Real Estate, Rental & Leasing (100.0%), Educational Services (91.0%), and Health Care & Social Assistance (76.1%).
| Industry | Male | Female |
| Agriculture, Fishing & Hunting | 15 (100.0%) | 0 (0.0%) |
| Mining, Quarrying, & Extraction | 0 (0.0%) | 0 (0.0%) |
| Construction | 217 (63.1%) | 127 (36.9%) |
| Manufacturing | 206 (58.5%) | 146 (41.5%) |
| Wholesale Trade | 54 (84.4%) | 10 (15.6%) |
| Retail Trade | 119 (51.7%) | 111 (48.3%) |
| Transportation & Warehousing | 93 (89.4%) | 11 (10.6%) |
| Utilities | 0 (0.0%) | 0 (0.0%) |
| Information | 9 (100.0%) | 0 (0.0%) |
| Finance & Insurance | 49 (55.7%) | 39 (44.3%) |
| Real Estate, Rental & Leasing | 0 (0.0%) | 52 (100.0%) |
| Professional & Scientific | 69 (45.1%) | 84 (54.9%) |
| Enterprise Management | 0 (0.0%) | 0 (0.0%) |
| Administrative & Support | 215 (65.9%) | 111 (34.1%) |
| Educational Services | 12 (9.0%) | 122 (91.0%) |
| Health Care & Social Assistance | 71 (23.9%) | 226 (76.1%) |
| Arts, Entertainment & Recreation | 26 (86.7%) | 4 (13.3%) |
| Accommodation & Food Services | 147 (59.0%) | 102 (41.0%) |
| Public Administration | 67 (64.4%) | 37 (35.6%) |
| Total | 1,416 (54.1%) | 1,200 (45.9%) |
Education in El Cerrito
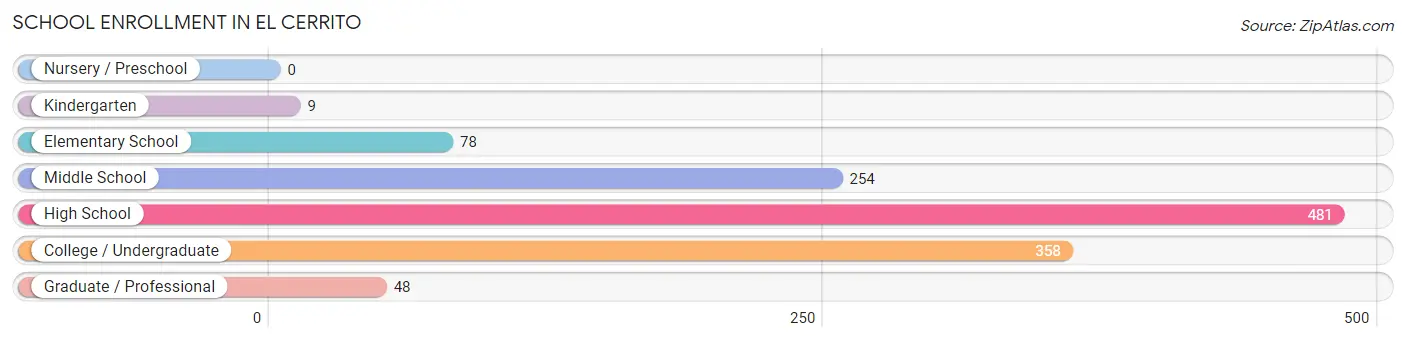
School Enrollment in El Cerrito
The most common levels of schooling among the 1,228 students in El Cerrito are high school (481 | 39.2%), college / undergraduate (358 | 29.1%), and middle school (254 | 20.7%).
| School Level | # Students | % Students |
| Nursery / Preschool | 0 | 0.0% |
| Kindergarten | 9 | 0.7% |
| Elementary School | 78 | 6.4% |
| Middle School | 254 | 20.7% |
| High School | 481 | 39.2% |
| College / Undergraduate | 358 | 29.1% |
| Graduate / Professional | 48 | 3.9% |
| Total | 1,228 | 100.0% |
School Enrollment by Age by Funding Source in El Cerrito
Out of a total of 1,228 students who are enrolled in schools in El Cerrito, 115 (9.4%) attend a private institution, while the remaining 1,113 (90.6%) are enrolled in public schools. The age group of 20 to 24 year olds has the highest likelihood of being enrolled in private schools, with 73 (35.4% in the age bracket) enrolled. Conversely, the age group of 15 to 17 year olds has the lowest likelihood of being enrolled in a private school, with 250 (100.0% in the age bracket) attending a public institution.
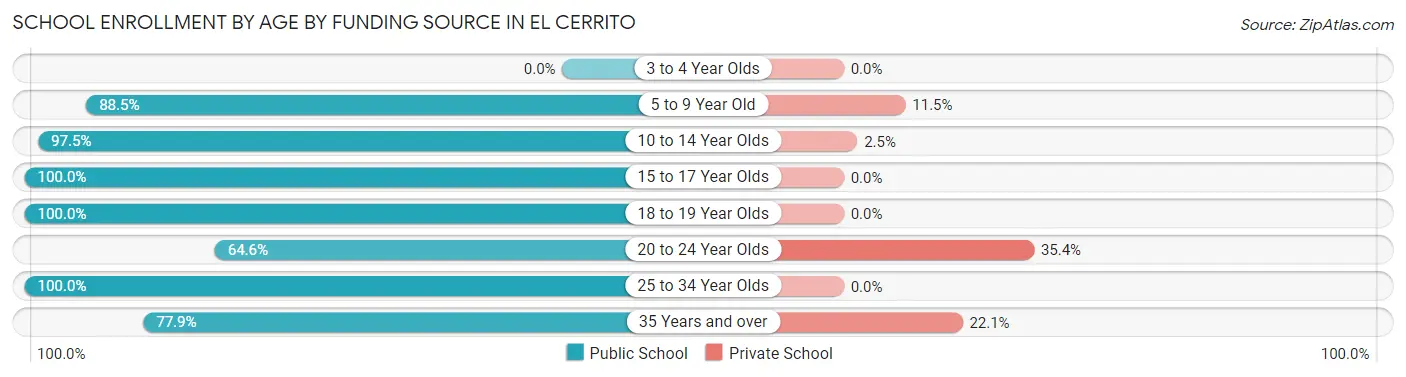
| Age Bracket | Public School | Private School |
| 3 to 4 Year Olds | 0 (0.0%) | 0 (0.0%) |
| 5 to 9 Year Old | 77 (88.5%) | 10 (11.5%) |
| 10 to 14 Year Olds | 385 (97.5%) | 10 (2.5%) |
| 15 to 17 Year Olds | 250 (100.0%) | 0 (0.0%) |
| 18 to 19 Year Olds | 144 (100.0%) | 0 (0.0%) |
| 20 to 24 Year Olds | 133 (64.6%) | 73 (35.4%) |
| 25 to 34 Year Olds | 42 (100.0%) | 0 (0.0%) |
| 35 Years and over | 81 (77.9%) | 23 (22.1%) |
| Total | 1,113 (90.6%) | 115 (9.4%) |
Educational Attainment by Field of Study in El Cerrito
Bio, nature & agricultural (76 | 14.2%), business (76 | 14.2%), social sciences (64 | 11.9%), arts & humanities (55 | 10.3%), and computers & mathematics (48 | 9.0%) are the most common fields of study among 536 individuals in El Cerrito who have obtained a bachelor's degree or higher.
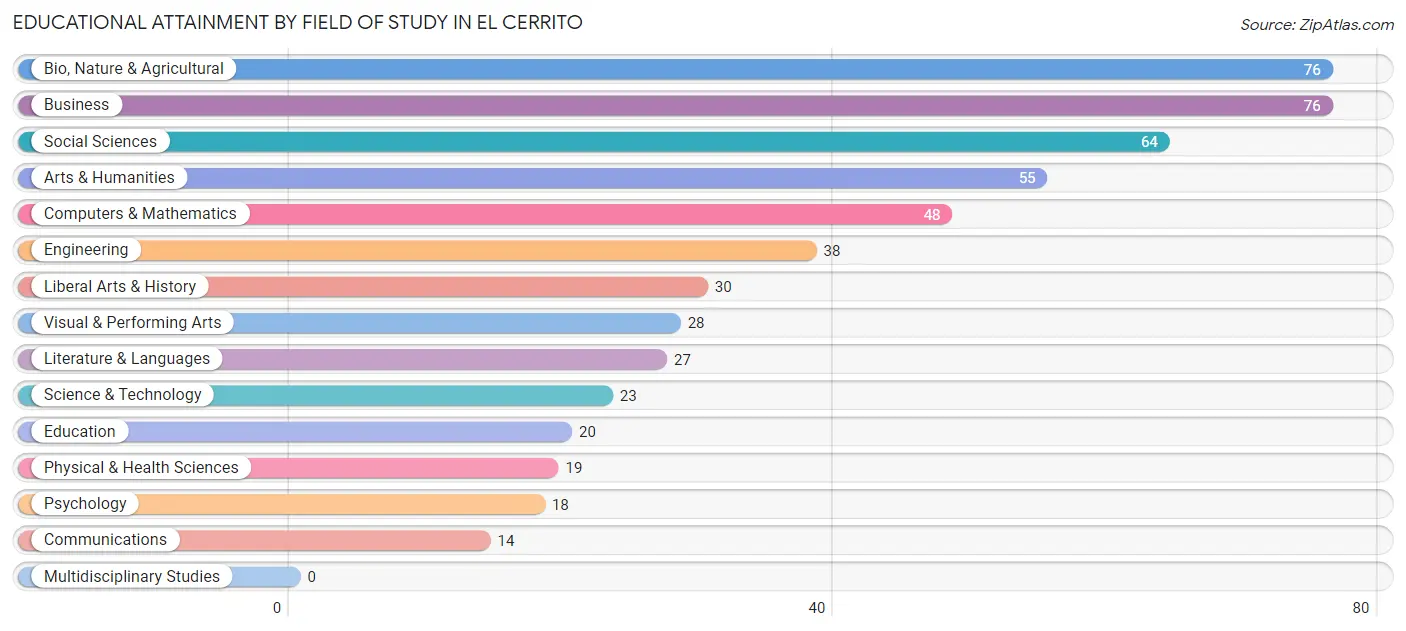
| Field of Study | # Graduates | % Graduates |
| Computers & Mathematics | 48 | 9.0% |
| Bio, Nature & Agricultural | 76 | 14.2% |
| Physical & Health Sciences | 19 | 3.5% |
| Psychology | 18 | 3.4% |
| Social Sciences | 64 | 11.9% |
| Engineering | 38 | 7.1% |
| Multidisciplinary Studies | 0 | 0.0% |
| Science & Technology | 23 | 4.3% |
| Business | 76 | 14.2% |
| Education | 20 | 3.7% |
| Literature & Languages | 27 | 5.0% |
| Liberal Arts & History | 30 | 5.6% |
| Visual & Performing Arts | 28 | 5.2% |
| Communications | 14 | 2.6% |
| Arts & Humanities | 55 | 10.3% |
| Total | 536 | 100.0% |
Transportation & Commute in El Cerrito
Vehicle Availability by Sex in El Cerrito
The most prevalent vehicle ownership categories in El Cerrito are males with 2 vehicles (441, accounting for 31.8%) and females with 2 vehicles (419, making up 37.5%).
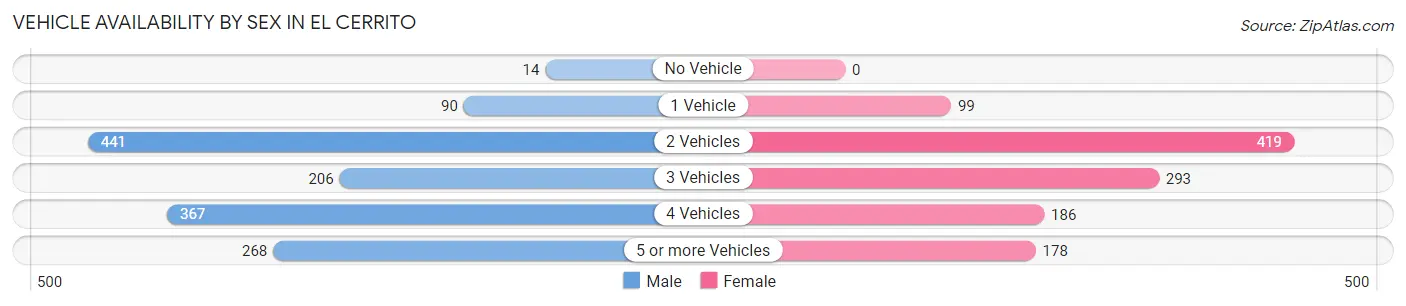
| Vehicles Available | Male | Female |
| No Vehicle | 14 (1.0%) | 0 (0.0%) |
| 1 Vehicle | 90 (6.5%) | 99 (8.4%) |
| 2 Vehicles | 441 (31.8%) | 419 (35.7%) |
| 3 Vehicles | 206 (14.9%) | 293 (24.9%) |
| 4 Vehicles | 367 (26.5%) | 186 (15.8%) |
| 5 or more Vehicles | 268 (19.3%) | 178 (15.1%) |
| Total | 1,386 (100.0%) | 1,175 (100.0%) |
Commute Time in El Cerrito
The most frequently occuring commute durations in El Cerrito are 45 to 59 minutes (410 commuters, 17.2%), 10 to 14 minutes (333 commuters, 14.0%), and 60 to 89 minutes (318 commuters, 13.4%).
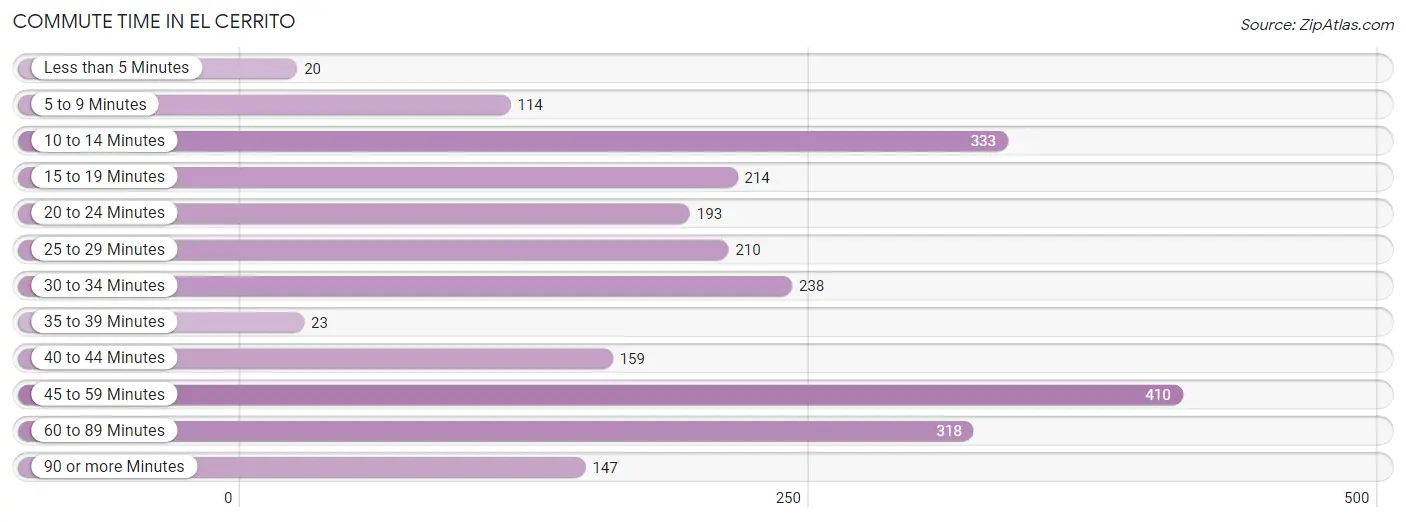
| Commute Time | # Commuters | % Commuters |
| Less than 5 Minutes | 20 | 0.8% |
| 5 to 9 Minutes | 114 | 4.8% |
| 10 to 14 Minutes | 333 | 14.0% |
| 15 to 19 Minutes | 214 | 9.0% |
| 20 to 24 Minutes | 193 | 8.1% |
| 25 to 29 Minutes | 210 | 8.8% |
| 30 to 34 Minutes | 238 | 10.0% |
| 35 to 39 Minutes | 23 | 1.0% |
| 40 to 44 Minutes | 159 | 6.7% |
| 45 to 59 Minutes | 410 | 17.2% |
| 60 to 89 Minutes | 318 | 13.4% |
| 90 or more Minutes | 147 | 6.2% |
Commute Time by Sex in El Cerrito
The most common commute times in El Cerrito are 60 to 89 minutes (252 commuters, 19.3%) for males and 45 to 59 minutes (209 commuters, 19.5%) for females.
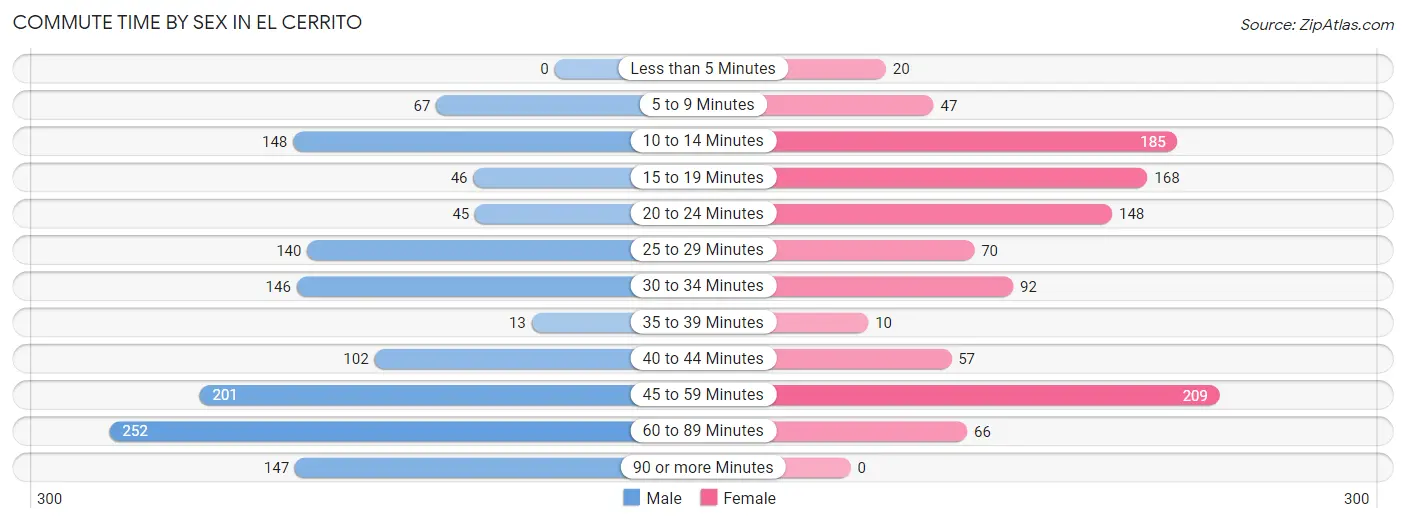
| Commute Time | Male | Female |
| Less than 5 Minutes | 0 (0.0%) | 20 (1.9%) |
| 5 to 9 Minutes | 67 (5.1%) | 47 (4.4%) |
| 10 to 14 Minutes | 148 (11.3%) | 185 (17.3%) |
| 15 to 19 Minutes | 46 (3.5%) | 168 (15.7%) |
| 20 to 24 Minutes | 45 (3.4%) | 148 (13.8%) |
| 25 to 29 Minutes | 140 (10.7%) | 70 (6.5%) |
| 30 to 34 Minutes | 146 (11.2%) | 92 (8.6%) |
| 35 to 39 Minutes | 13 (1.0%) | 10 (0.9%) |
| 40 to 44 Minutes | 102 (7.8%) | 57 (5.3%) |
| 45 to 59 Minutes | 201 (15.4%) | 209 (19.5%) |
| 60 to 89 Minutes | 252 (19.3%) | 66 (6.2%) |
| 90 or more Minutes | 147 (11.3%) | 0 (0.0%) |
Time of Departure to Work by Sex in El Cerrito
The most frequent times of departure to work in El Cerrito are 12:00 AM to 4:59 AM (545, 41.7%) for males and 6:00 AM to 6:29 AM (182, 17.0%) for females.
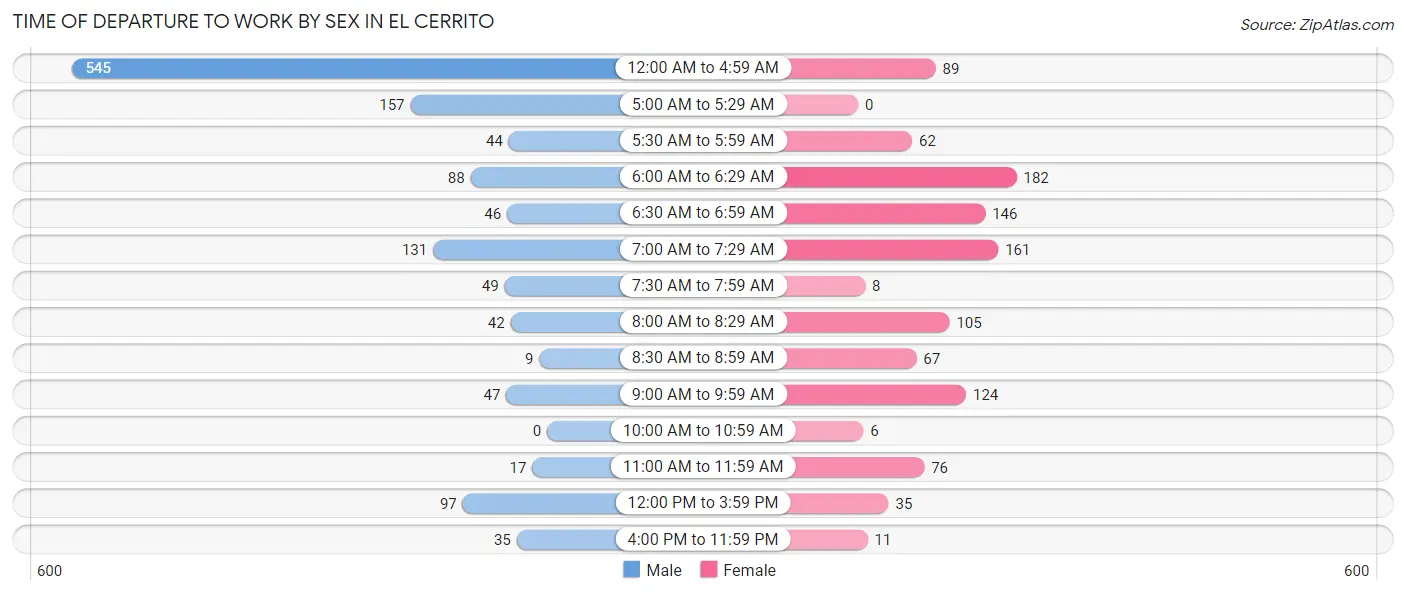
| Time of Departure | Male | Female |
| 12:00 AM to 4:59 AM | 545 (41.7%) | 89 (8.3%) |
| 5:00 AM to 5:29 AM | 157 (12.0%) | 0 (0.0%) |
| 5:30 AM to 5:59 AM | 44 (3.4%) | 62 (5.8%) |
| 6:00 AM to 6:29 AM | 88 (6.7%) | 182 (17.0%) |
| 6:30 AM to 6:59 AM | 46 (3.5%) | 146 (13.6%) |
| 7:00 AM to 7:29 AM | 131 (10.0%) | 161 (15.0%) |
| 7:30 AM to 7:59 AM | 49 (3.7%) | 8 (0.7%) |
| 8:00 AM to 8:29 AM | 42 (3.2%) | 105 (9.8%) |
| 8:30 AM to 8:59 AM | 9 (0.7%) | 67 (6.2%) |
| 9:00 AM to 9:59 AM | 47 (3.6%) | 124 (11.6%) |
| 10:00 AM to 10:59 AM | 0 (0.0%) | 6 (0.6%) |
| 11:00 AM to 11:59 AM | 17 (1.3%) | 76 (7.1%) |
| 12:00 PM to 3:59 PM | 97 (7.4%) | 35 (3.3%) |
| 4:00 PM to 11:59 PM | 35 (2.7%) | 11 (1.0%) |
| Total | 1,307 (100.0%) | 1,072 (100.0%) |
Housing Occupancy in El Cerrito
Occupancy by Ownership in El Cerrito
Of the total 1,436 dwellings in El Cerrito, owner-occupied units account for 1,105 (76.9%), while renter-occupied units make up 331 (23.1%).
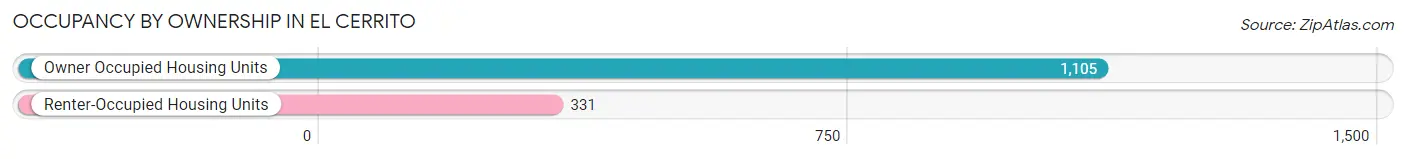
| Occupancy | # Housing Units | % Housing Units |
| Owner Occupied Housing Units | 1,105 | 76.9% |
| Renter-Occupied Housing Units | 331 | 23.1% |
| Total Occupied Housing Units | 1,436 | 100.0% |
Occupancy by Household Size in El Cerrito
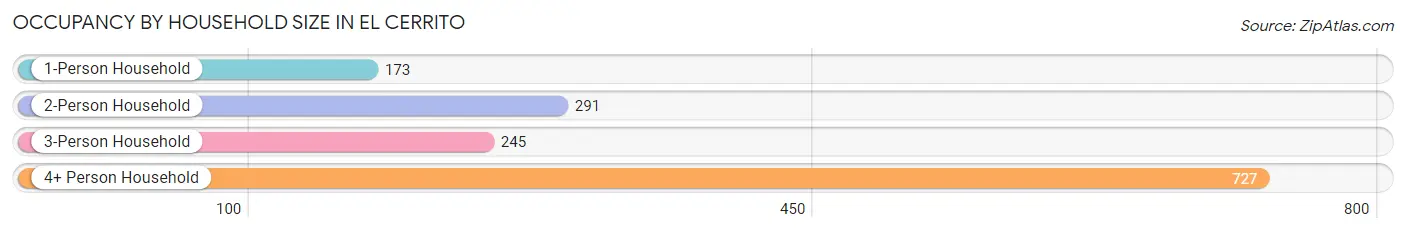
| Household Size | # Housing Units | % Housing Units |
| 1-Person Household | 173 | 12.0% |
| 2-Person Household | 291 | 20.3% |
| 3-Person Household | 245 | 17.1% |
| 4+ Person Household | 727 | 50.6% |
| Total Housing Units | 1,436 | 100.0% |
Occupancy by Ownership by Household Size in El Cerrito
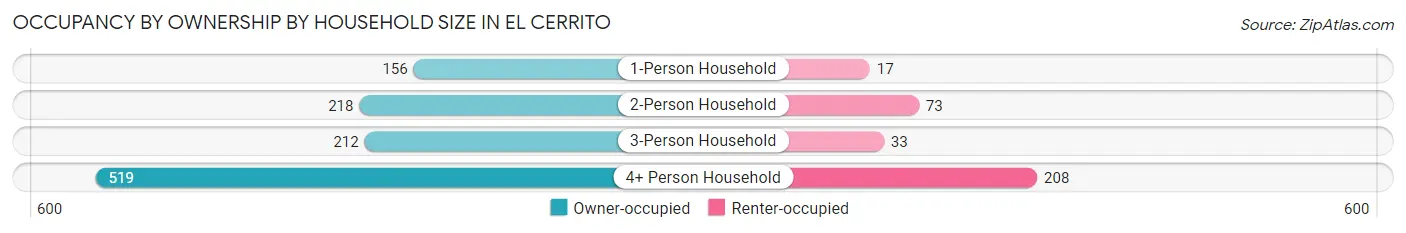
| Household Size | Owner-occupied | Renter-occupied |
| 1-Person Household | 156 (90.2%) | 17 (9.8%) |
| 2-Person Household | 218 (74.9%) | 73 (25.1%) |
| 3-Person Household | 212 (86.5%) | 33 (13.5%) |
| 4+ Person Household | 519 (71.4%) | 208 (28.6%) |
| Total Housing Units | 1,105 (76.9%) | 331 (23.1%) |
Occupancy by Educational Attainment in El Cerrito
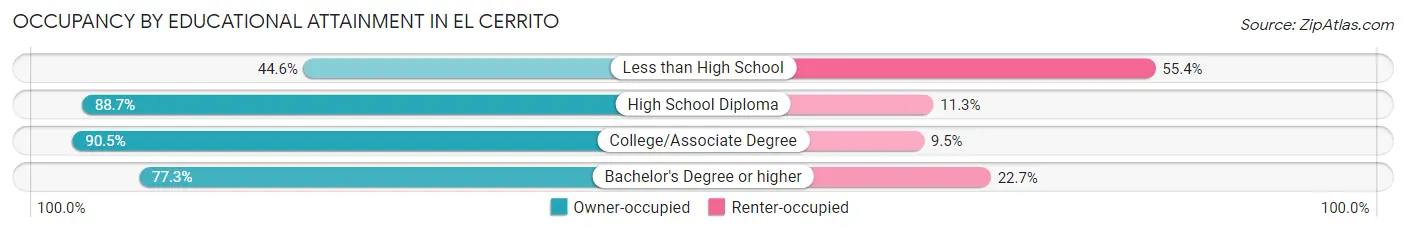
| Household Size | Owner-occupied | Renter-occupied |
| Less than High School | 154 (44.6%) | 191 (55.4%) |
| High School Diploma | 305 (88.7%) | 39 (11.3%) |
| College/Associate Degree | 469 (90.5%) | 49 (9.5%) |
| Bachelor's Degree or higher | 177 (77.3%) | 52 (22.7%) |
Occupancy by Age of Householder in El Cerrito

| Age Bracket | # Households | % Households |
| Under 35 Years | 57 | 4.0% |
| 35 to 44 Years | 207 | 14.4% |
| 45 to 54 Years | 427 | 29.7% |
| 55 to 64 Years | 516 | 35.9% |
| 65 to 74 Years | 165 | 11.5% |
| 75 to 84 Years | 64 | 4.5% |
| 85 Years and Over | 0 | 0.0% |
| Total | 1,436 | 100.0% |
Housing Finances in El Cerrito
Median Income by Occupancy in El Cerrito
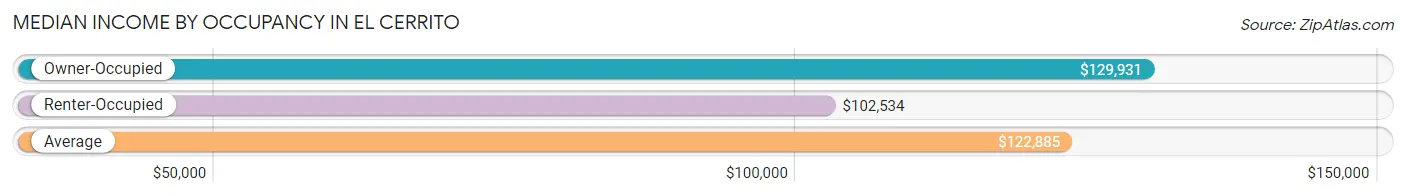
| Occupancy Type | # Households | Median Income |
| Owner-Occupied | 1,105 (76.9%) | $129,931 |
| Renter-Occupied | 331 (23.1%) | $102,534 |
| Average | 1,436 (100.0%) | $122,885 |
Occupancy by Householder Income Bracket in El Cerrito
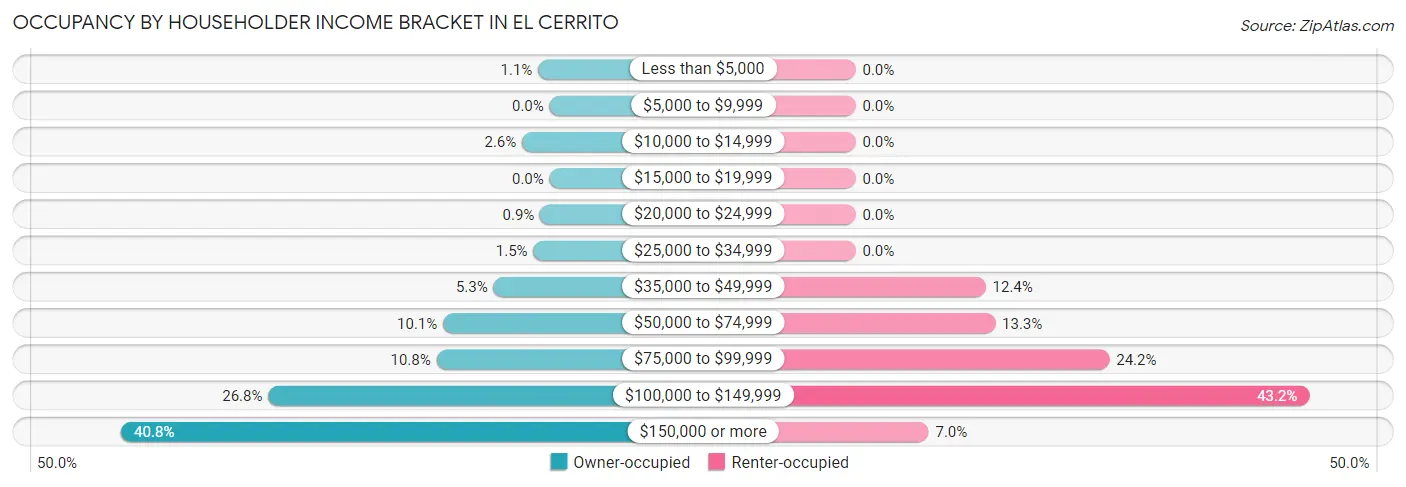
| Income Bracket | Owner-occupied | Renter-occupied |
| Less than $5,000 | 12 (1.1%) | 0 (0.0%) |
| $5,000 to $9,999 | 0 (0.0%) | 0 (0.0%) |
| $10,000 to $14,999 | 29 (2.6%) | 0 (0.0%) |
| $15,000 to $19,999 | 0 (0.0%) | 0 (0.0%) |
| $20,000 to $24,999 | 10 (0.9%) | 0 (0.0%) |
| $25,000 to $34,999 | 17 (1.5%) | 0 (0.0%) |
| $35,000 to $49,999 | 59 (5.3%) | 41 (12.4%) |
| $50,000 to $74,999 | 112 (10.1%) | 44 (13.3%) |
| $75,000 to $99,999 | 119 (10.8%) | 80 (24.2%) |
| $100,000 to $149,999 | 296 (26.8%) | 143 (43.2%) |
| $150,000 or more | 451 (40.8%) | 23 (7.0%) |
| Total | 1,105 (100.0%) | 331 (100.0%) |
Monthly Housing Cost Tiers in El Cerrito
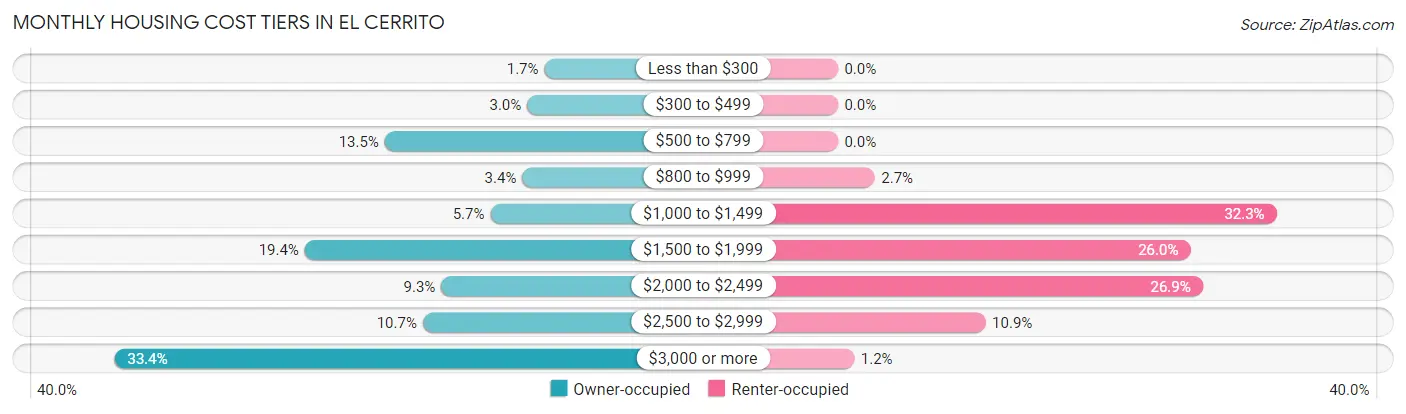
| Monthly Cost | Owner-occupied | Renter-occupied |
| Less than $300 | 19 (1.7%) | 0 (0.0%) |
| $300 to $499 | 33 (3.0%) | 0 (0.0%) |
| $500 to $799 | 149 (13.5%) | 0 (0.0%) |
| $800 to $999 | 37 (3.4%) | 9 (2.7%) |
| $1,000 to $1,499 | 63 (5.7%) | 107 (32.3%) |
| $1,500 to $1,999 | 214 (19.4%) | 86 (26.0%) |
| $2,000 to $2,499 | 103 (9.3%) | 89 (26.9%) |
| $2,500 to $2,999 | 118 (10.7%) | 36 (10.9%) |
| $3,000 or more | 369 (33.4%) | 4 (1.2%) |
| Total | 1,105 (100.0%) | 331 (100.0%) |
Physical Housing Characteristics in El Cerrito
Housing Structures in El Cerrito
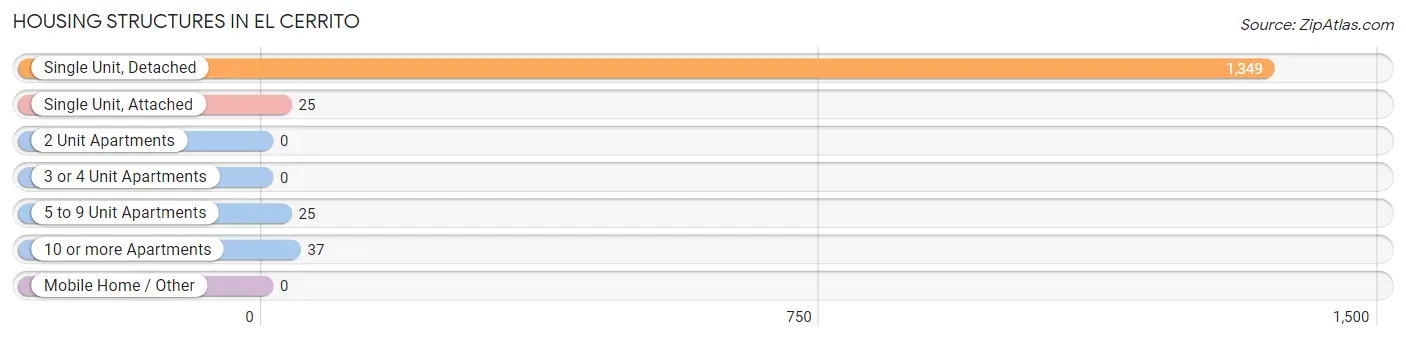
| Structure Type | # Housing Units | % Housing Units |
| Single Unit, Detached | 1,349 | 93.9% |
| Single Unit, Attached | 25 | 1.7% |
| 2 Unit Apartments | 0 | 0.0% |
| 3 or 4 Unit Apartments | 0 | 0.0% |
| 5 to 9 Unit Apartments | 25 | 1.7% |
| 10 or more Apartments | 37 | 2.6% |
| Mobile Home / Other | 0 | 0.0% |
| Total | 1,436 | 100.0% |
Housing Structures by Occupancy in El Cerrito
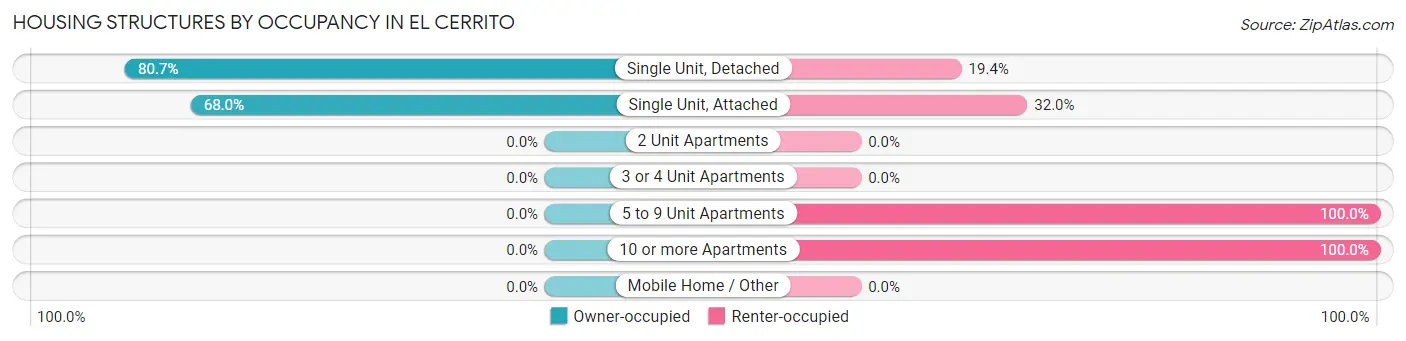
| Structure Type | Owner-occupied | Renter-occupied |
| Single Unit, Detached | 1,088 (80.6%) | 261 (19.4%) |
| Single Unit, Attached | 17 (68.0%) | 8 (32.0%) |
| 2 Unit Apartments | 0 (0.0%) | 0 (0.0%) |
| 3 or 4 Unit Apartments | 0 (0.0%) | 0 (0.0%) |
| 5 to 9 Unit Apartments | 0 (0.0%) | 25 (100.0%) |
| 10 or more Apartments | 0 (0.0%) | 37 (100.0%) |
| Mobile Home / Other | 0 (0.0%) | 0 (0.0%) |
| Total | 1,105 (76.9%) | 331 (23.1%) |
Housing Structures by Number of Rooms in El Cerrito
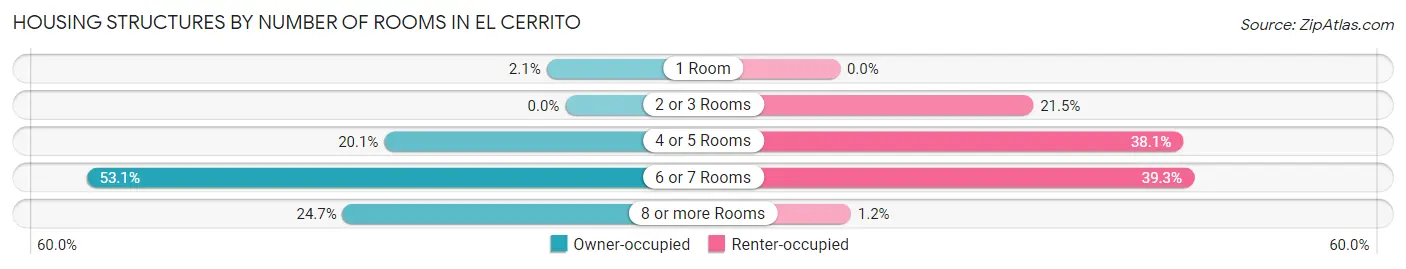
| Number of Rooms | Owner-occupied | Renter-occupied |
| 1 Room | 23 (2.1%) | 0 (0.0%) |
| 2 or 3 Rooms | 0 (0.0%) | 71 (21.4%) |
| 4 or 5 Rooms | 222 (20.1%) | 126 (38.1%) |
| 6 or 7 Rooms | 587 (53.1%) | 130 (39.3%) |
| 8 or more Rooms | 273 (24.7%) | 4 (1.2%) |
| Total | 1,105 (100.0%) | 331 (100.0%) |
Housing Structure by Heating Type in El Cerrito
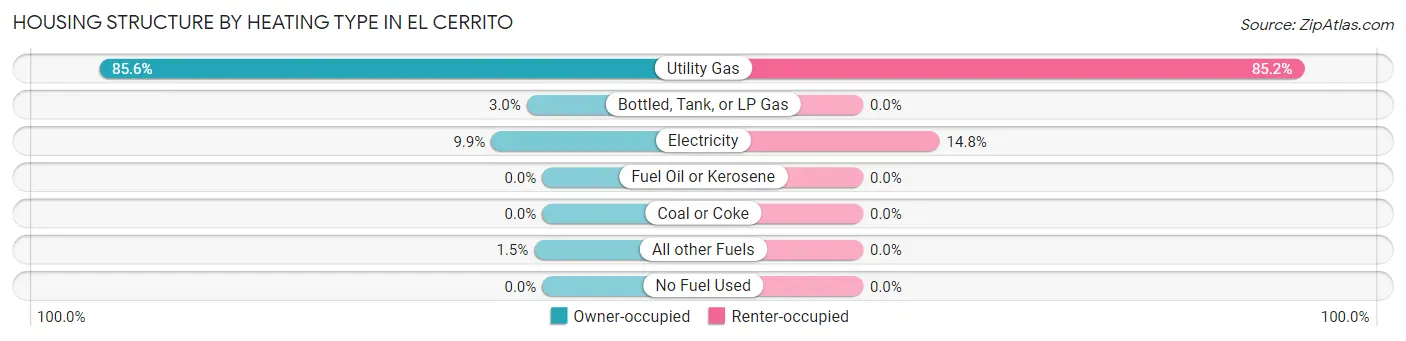
| Heating Type | Owner-occupied | Renter-occupied |
| Utility Gas | 946 (85.6%) | 282 (85.2%) |
| Bottled, Tank, or LP Gas | 33 (3.0%) | 0 (0.0%) |
| Electricity | 109 (9.9%) | 49 (14.8%) |
| Fuel Oil or Kerosene | 0 (0.0%) | 0 (0.0%) |
| Coal or Coke | 0 (0.0%) | 0 (0.0%) |
| All other Fuels | 17 (1.5%) | 0 (0.0%) |
| No Fuel Used | 0 (0.0%) | 0 (0.0%) |
| Total | 1,105 (100.0%) | 331 (100.0%) |
Household Vehicle Usage in El Cerrito
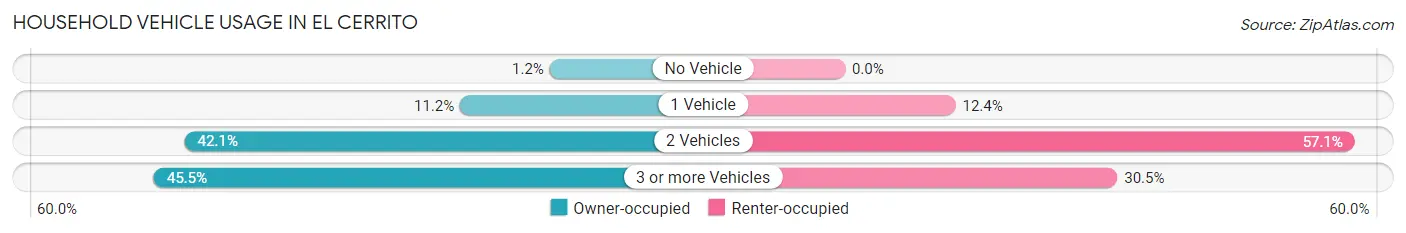
| Vehicles per Household | Owner-occupied | Renter-occupied |
| No Vehicle | 13 (1.2%) | 0 (0.0%) |
| 1 Vehicle | 124 (11.2%) | 41 (12.4%) |
| 2 Vehicles | 465 (42.1%) | 189 (57.1%) |
| 3 or more Vehicles | 503 (45.5%) | 101 (30.5%) |
| Total | 1,105 (100.0%) | 331 (100.0%) |
Real Estate & Mortgages in El Cerrito
Real Estate and Mortgage Overview in El Cerrito
| Characteristic | Without Mortgage | With Mortgage |
| Housing Units | 233 | 872 |
| Median Property Value | $504,900 | $595,700 |
| Median Household Income | $129,931 | $369 |
| Monthly Housing Costs | $625 | $369 |
| Real Estate Taxes | $3,170 | $21 |
Property Value by Mortgage Status in El Cerrito
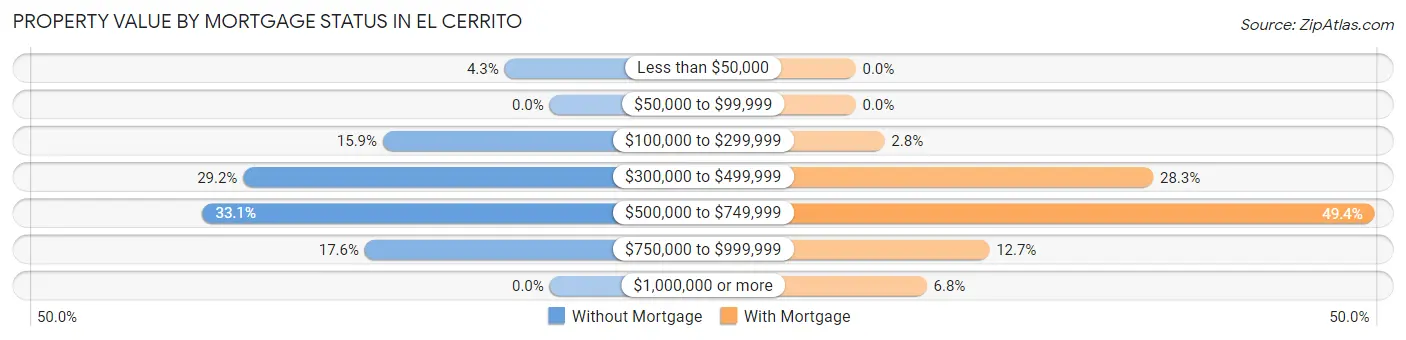
| Property Value | Without Mortgage | With Mortgage |
| Less than $50,000 | 10 (4.3%) | 0 (0.0%) |
| $50,000 to $99,999 | 0 (0.0%) | 0 (0.0%) |
| $100,000 to $299,999 | 37 (15.9%) | 24 (2.8%) |
| $300,000 to $499,999 | 68 (29.2%) | 247 (28.3%) |
| $500,000 to $749,999 | 77 (33.1%) | 431 (49.4%) |
| $750,000 to $999,999 | 41 (17.6%) | 111 (12.7%) |
| $1,000,000 or more | 0 (0.0%) | 59 (6.8%) |
| Total | 233 (100.0%) | 872 (100.0%) |
Household Income by Mortgage Status in El Cerrito
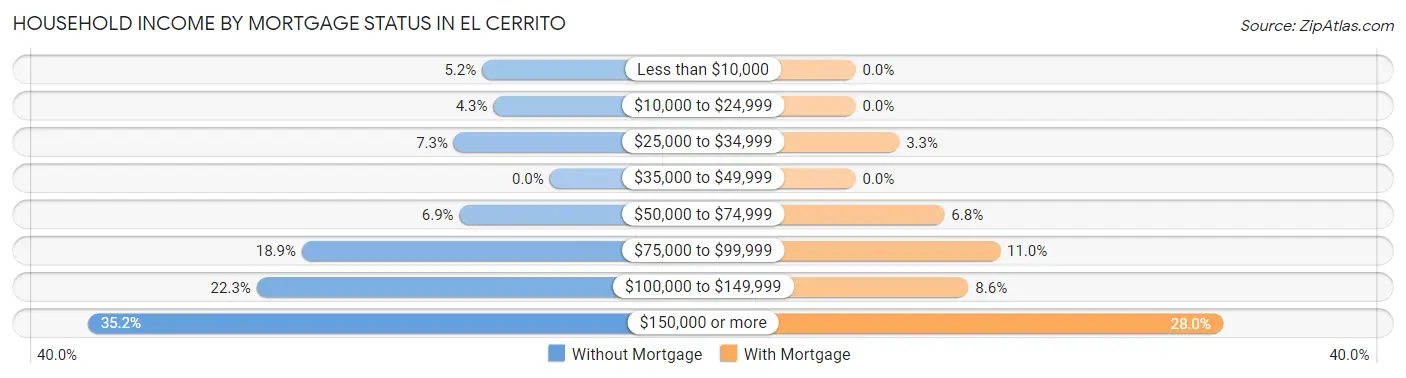
| Household Income | Without Mortgage | With Mortgage |
| Less than $10,000 | 12 (5.1%) | 0 (0.0%) |
| $10,000 to $24,999 | 10 (4.3%) | 0 (0.0%) |
| $25,000 to $34,999 | 17 (7.3%) | 29 (3.3%) |
| $35,000 to $49,999 | 0 (0.0%) | 0 (0.0%) |
| $50,000 to $74,999 | 16 (6.9%) | 59 (6.8%) |
| $75,000 to $99,999 | 44 (18.9%) | 96 (11.0%) |
| $100,000 to $149,999 | 52 (22.3%) | 75 (8.6%) |
| $150,000 or more | 82 (35.2%) | 244 (28.0%) |
| Total | 233 (100.0%) | 872 (100.0%) |
Property Value to Household Income Ratio in El Cerrito
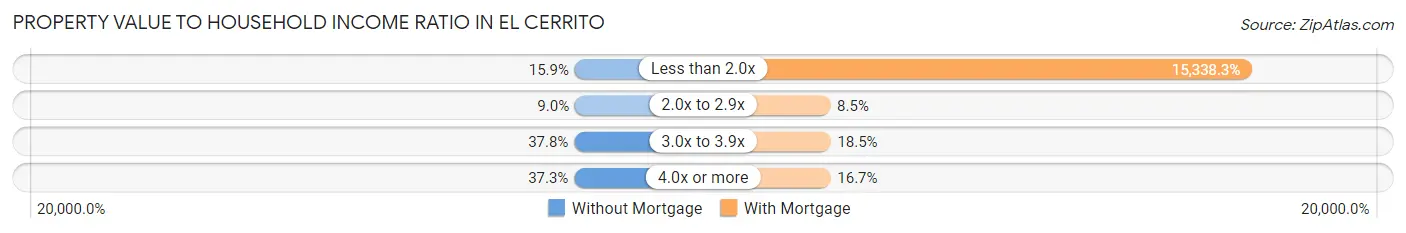
| Value-to-Income Ratio | Without Mortgage | With Mortgage |
| Less than 2.0x | 37 (15.9%) | 133,750 (15,338.3%) |
| 2.0x to 2.9x | 21 (9.0%) | 74 (8.5%) |
| 3.0x to 3.9x | 88 (37.8%) | 161 (18.5%) |
| 4.0x or more | 87 (37.3%) | 146 (16.7%) |
| Total | 233 (100.0%) | 872 (100.0%) |
Real Estate Taxes by Mortgage Status in El Cerrito

| Property Taxes | Without Mortgage | With Mortgage |
| Less than $800 | 10 (4.3%) | 0 (0.0%) |
| $800 to $1,499 | 29 (12.4%) | 0 (0.0%) |
| $800 to $1,499 | 194 (83.3%) | 80 (9.2%) |
| Total | 233 (100.0%) | 872 (100.0%) |
Health & Disability in El Cerrito
Health Insurance Coverage by Age in El Cerrito
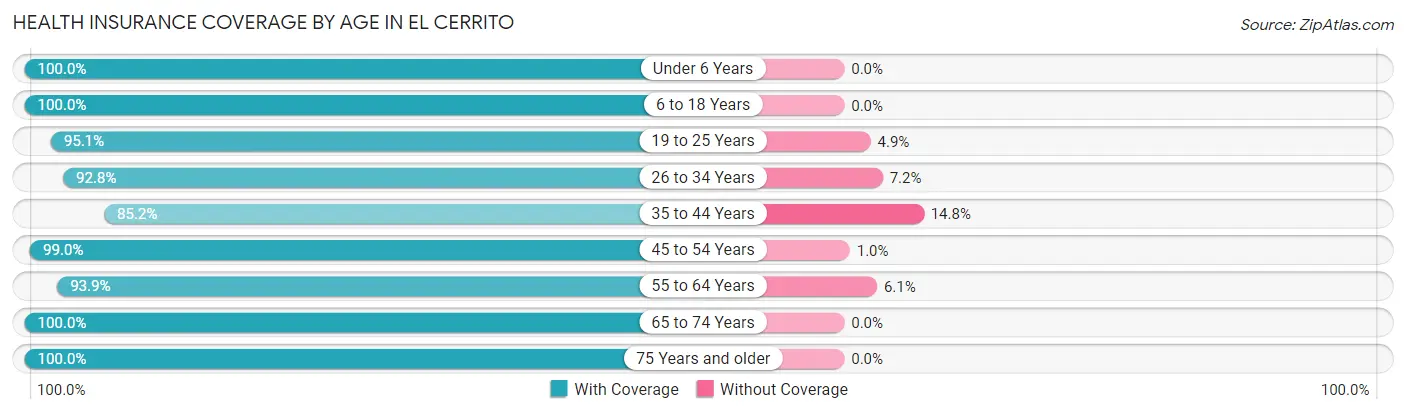
| Age Bracket | With Coverage | Without Coverage |
| Under 6 Years | 373 (100.0%) | 0 (0.0%) |
| 6 to 18 Years | 960 (100.0%) | 0 (0.0%) |
| 19 to 25 Years | 466 (95.1%) | 24 (4.9%) |
| 26 to 34 Years | 544 (92.8%) | 42 (7.2%) |
| 35 to 44 Years | 552 (85.2%) | 96 (14.8%) |
| 45 to 54 Years | 877 (99.0%) | 9 (1.0%) |
| 55 to 64 Years | 817 (93.9%) | 53 (6.1%) |
| 65 to 74 Years | 336 (100.0%) | 0 (0.0%) |
| 75 Years and older | 178 (100.0%) | 0 (0.0%) |
| Total | 5,103 (95.8%) | 224 (4.2%) |
Health Insurance Coverage by Citizenship Status in El Cerrito

| Citizenship Status | With Coverage | Without Coverage |
| Native Born | 373 (100.0%) | 0 (0.0%) |
| Foreign Born, Citizen | 960 (100.0%) | 0 (0.0%) |
| Foreign Born, not a Citizen | 466 (95.1%) | 24 (4.9%) |
Health Insurance Coverage by Household Income in El Cerrito
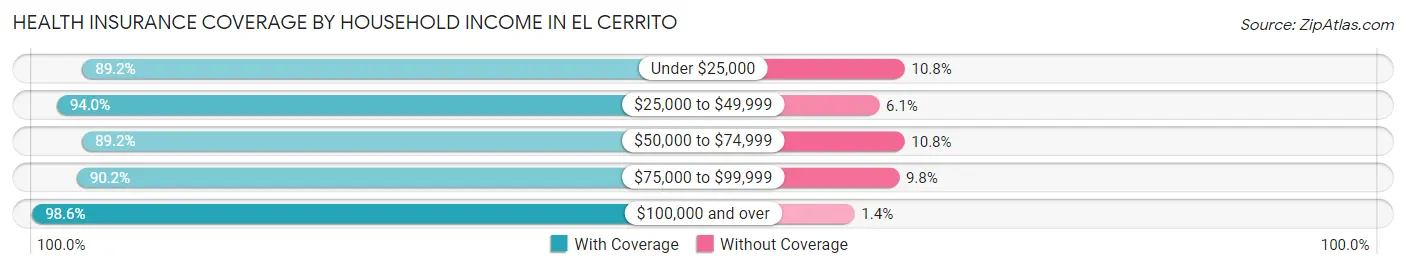
| Household Income | With Coverage | Without Coverage |
| Under $25,000 | 173 (89.2%) | 21 (10.8%) |
| $25,000 to $49,999 | 388 (94.0%) | 25 (6.0%) |
| $50,000 to $74,999 | 372 (89.2%) | 45 (10.8%) |
| $75,000 to $99,999 | 710 (90.2%) | 77 (9.8%) |
| $100,000 and over | 3,444 (98.6%) | 50 (1.4%) |
Public vs Private Health Insurance Coverage by Age in El Cerrito
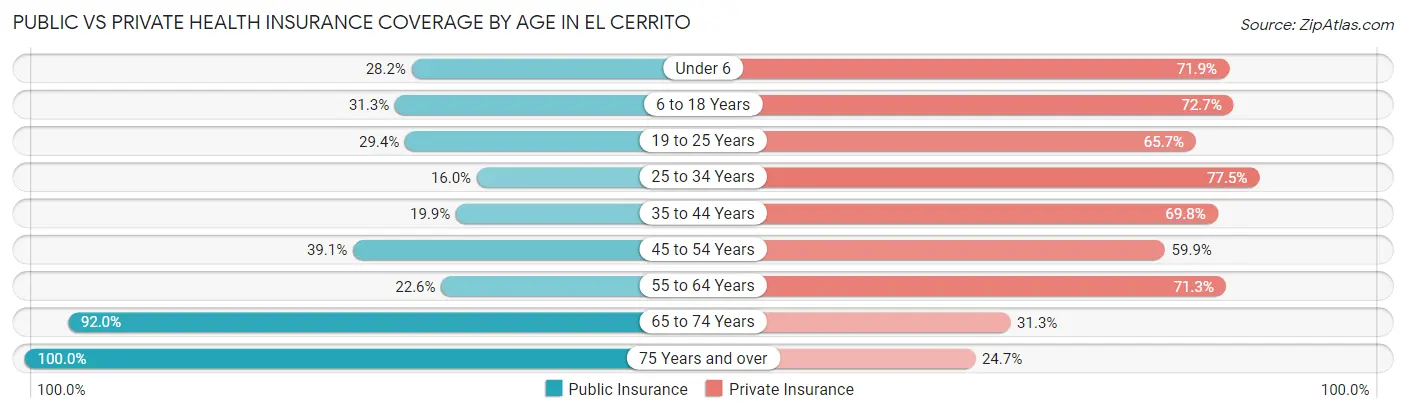
| Age Bracket | Public Insurance | Private Insurance |
| Under 6 | 105 (28.1%) | 268 (71.9%) |
| 6 to 18 Years | 300 (31.2%) | 698 (72.7%) |
| 19 to 25 Years | 144 (29.4%) | 322 (65.7%) |
| 25 to 34 Years | 94 (16.0%) | 454 (77.5%) |
| 35 to 44 Years | 129 (19.9%) | 452 (69.8%) |
| 45 to 54 Years | 346 (39.1%) | 531 (59.9%) |
| 55 to 64 Years | 197 (22.6%) | 620 (71.3%) |
| 65 to 74 Years | 309 (92.0%) | 105 (31.2%) |
| 75 Years and over | 178 (100.0%) | 44 (24.7%) |
| Total | 1,802 (33.8%) | 3,494 (65.6%) |
Disability Status by Sex by Age in El Cerrito
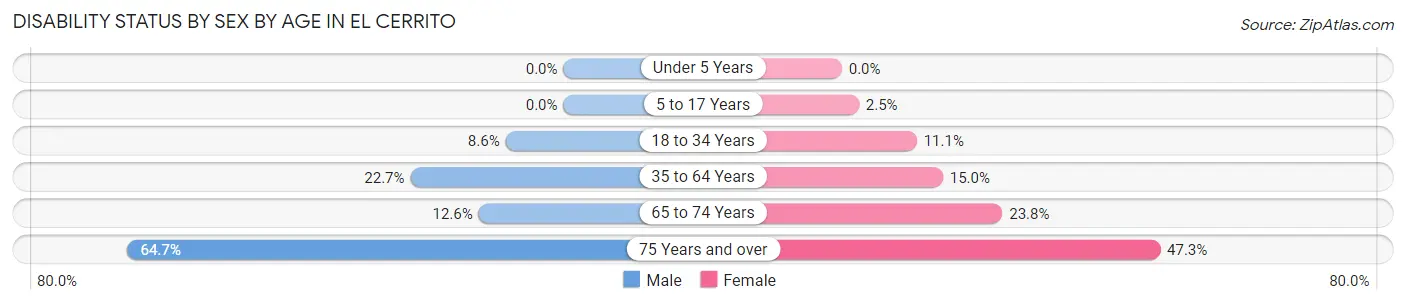
| Age Bracket | Male | Female |
| Under 5 Years | 0 (0.0%) | 0 (0.0%) |
| 5 to 17 Years | 0 (0.0%) | 11 (2.5%) |
| 18 to 34 Years | 59 (8.6%) | 68 (11.1%) |
| 35 to 64 Years | 272 (22.7%) | 181 (15.0%) |
| 65 to 74 Years | 18 (12.6%) | 46 (23.8%) |
| 75 Years and over | 44 (64.7%) | 52 (47.3%) |
Disability Class by Sex by Age in El Cerrito
Disability Class: Hearing Difficulty
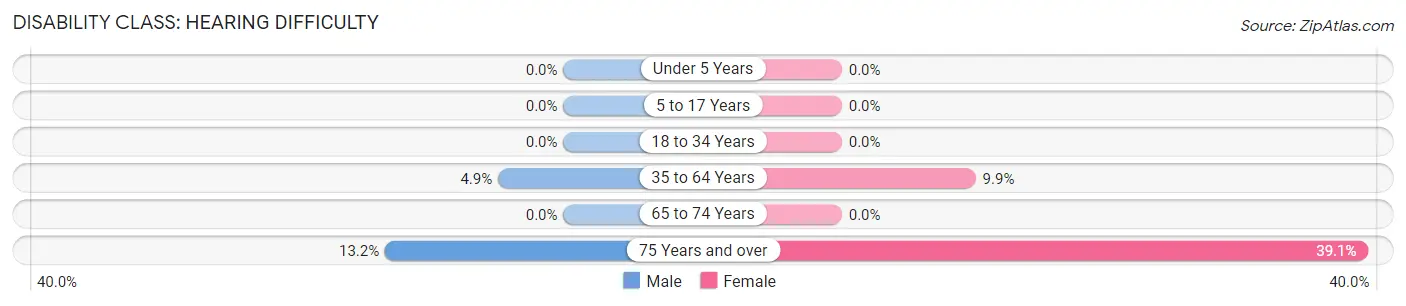
| Age Bracket | Male | Female |
| Under 5 Years | 0 (0.0%) | 0 (0.0%) |
| 5 to 17 Years | 0 (0.0%) | 0 (0.0%) |
| 18 to 34 Years | 0 (0.0%) | 0 (0.0%) |
| 35 to 64 Years | 58 (4.9%) | 120 (9.9%) |
| 65 to 74 Years | 0 (0.0%) | 0 (0.0%) |
| 75 Years and over | 9 (13.2%) | 43 (39.1%) |
Disability Class: Vision Difficulty
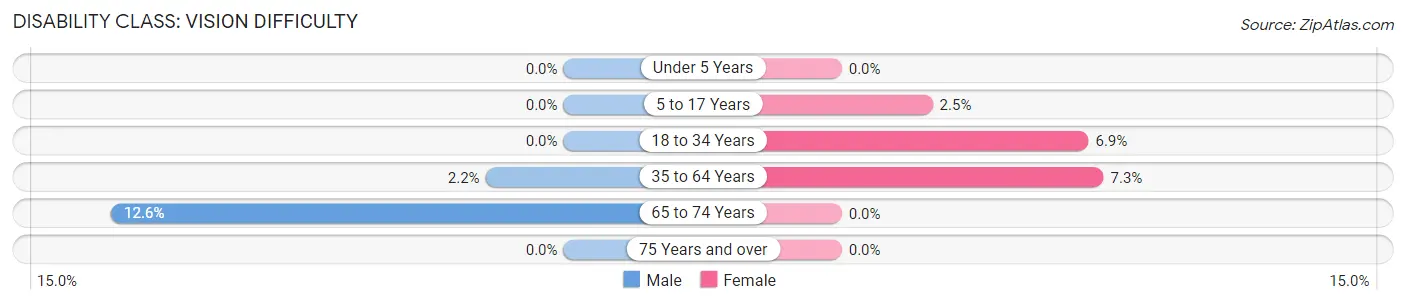
| Age Bracket | Male | Female |
| Under 5 Years | 0 (0.0%) | 0 (0.0%) |
| 5 to 17 Years | 0 (0.0%) | 11 (2.5%) |
| 18 to 34 Years | 0 (0.0%) | 42 (6.9%) |
| 35 to 64 Years | 26 (2.2%) | 88 (7.3%) |
| 65 to 74 Years | 18 (12.6%) | 0 (0.0%) |
| 75 Years and over | 0 (0.0%) | 0 (0.0%) |
Disability Class: Cognitive Difficulty
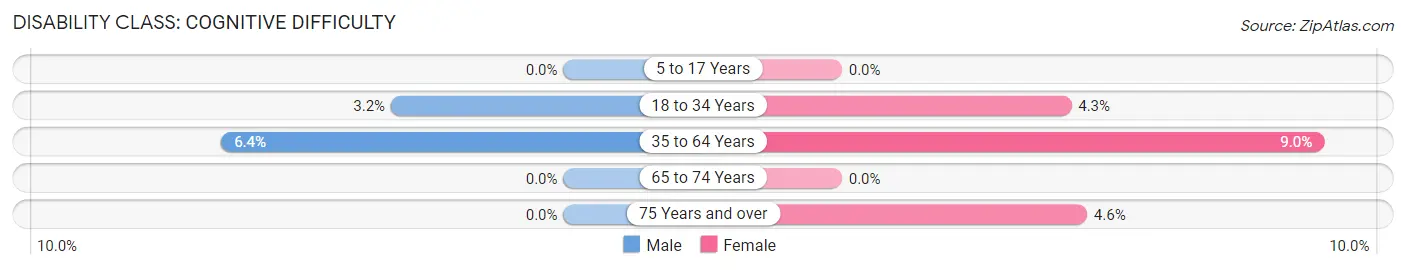
| Age Bracket | Male | Female |
| 5 to 17 Years | 0 (0.0%) | 0 (0.0%) |
| 18 to 34 Years | 22 (3.2%) | 26 (4.3%) |
| 35 to 64 Years | 76 (6.4%) | 108 (8.9%) |
| 65 to 74 Years | 0 (0.0%) | 0 (0.0%) |
| 75 Years and over | 0 (0.0%) | 5 (4.5%) |
Disability Class: Ambulatory Difficulty
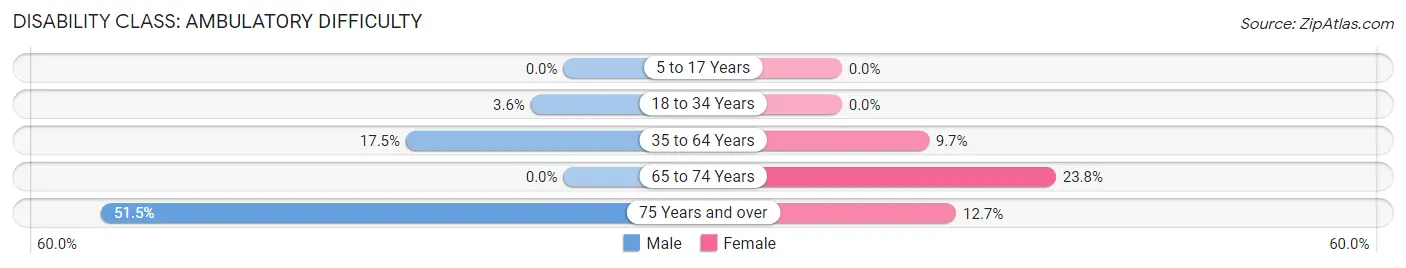
| Age Bracket | Male | Female |
| 5 to 17 Years | 0 (0.0%) | 0 (0.0%) |
| 18 to 34 Years | 25 (3.6%) | 0 (0.0%) |
| 35 to 64 Years | 210 (17.5%) | 117 (9.7%) |
| 65 to 74 Years | 0 (0.0%) | 46 (23.8%) |
| 75 Years and over | 35 (51.5%) | 14 (12.7%) |
Disability Class: Self-Care Difficulty
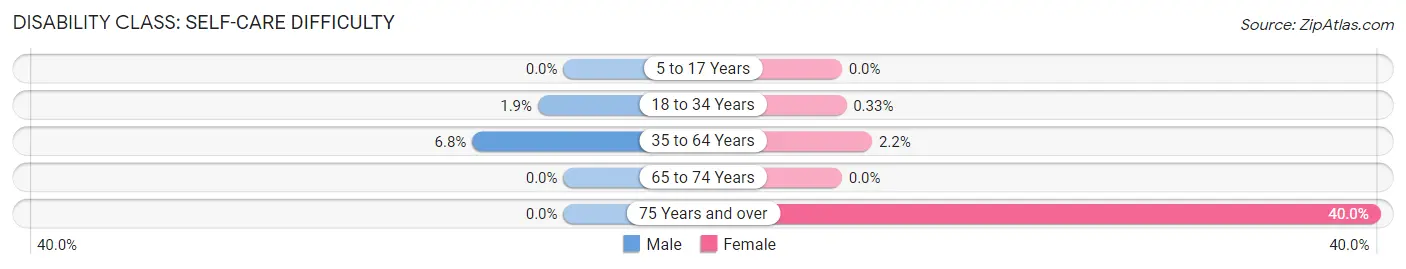
| Age Bracket | Male | Female |
| 5 to 17 Years | 0 (0.0%) | 0 (0.0%) |
| 18 to 34 Years | 13 (1.9%) | 2 (0.3%) |
| 35 to 64 Years | 81 (6.8%) | 27 (2.2%) |
| 65 to 74 Years | 0 (0.0%) | 0 (0.0%) |
| 75 Years and over | 0 (0.0%) | 44 (40.0%) |
Technology Access in El Cerrito
Computing Device Access in El Cerrito
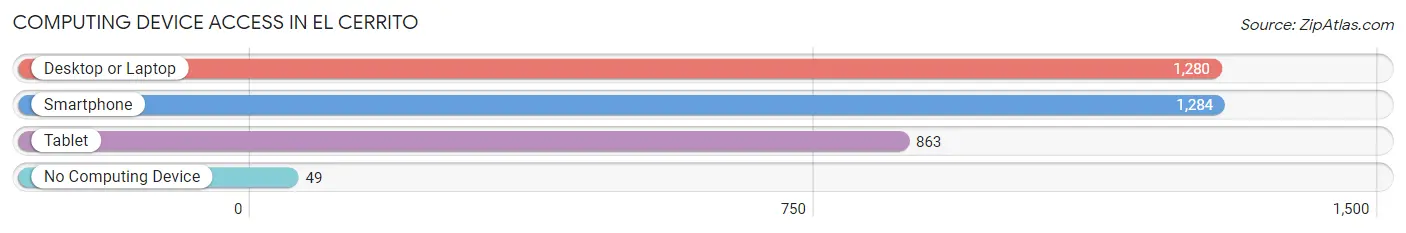
| Device Type | # Households | % Households |
| Desktop or Laptop | 1,280 | 89.1% |
| Smartphone | 1,284 | 89.4% |
| Tablet | 863 | 60.1% |
| No Computing Device | 49 | 3.4% |
| Total | 1,436 | 100.0% |
Internet Access in El Cerrito
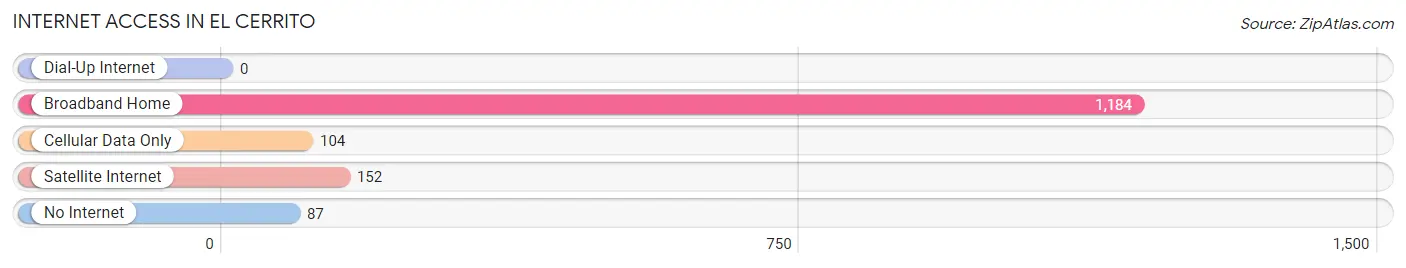
| Internet Type | # Households | % Households |
| Dial-Up Internet | 0 | 0.0% |
| Broadband Home | 1,184 | 82.5% |
| Cellular Data Only | 104 | 7.2% |
| Satellite Internet | 152 | 10.6% |
| No Internet | 87 | 6.1% |
| Total | 1,436 | 100.0% |
El Cerrito Summary
History
The history of El Cerrito, California dates back to the early 19th century when the area was first settled by Spanish missionaries. The area was originally part of the Rancho San Pablo, a large land grant given to the Mission San Francisco de Asis by the Spanish government in 1820. The area was then divided up into smaller parcels and sold off to settlers in the mid-1800s. The first permanent settlement in the area was established in 1859 by a man named William Meek, who built a small house and began farming the land.
In the late 1800s, the area began to develop as a small rural community, with the establishment of a post office, a school, and a few stores. The town was officially incorporated in 1908 and was named after the nearby Cerrito Creek.
In the early 20th century, El Cerrito experienced a period of rapid growth, as the population increased from just over 500 in 1910 to over 4,000 by 1920. This growth was largely due to the development of the nearby East Bay cities of Berkeley and Oakland, which provided employment opportunities for many of the new residents.
In the 1950s, El Cerrito experienced a period of suburbanization, as many of the residents moved out of the city and into the surrounding suburbs. This trend continued into the 1960s and 1970s, as the population of El Cerrito declined from its peak of over 10,000 in 1960 to just over 8,000 by 1980.
In the late 20th century, El Cerrito experienced a period of revitalization, as the city began to attract new businesses and residents. This trend has continued into the 21st century, as the population of El Cerrito has grown to over 24,000 as of 2020.
Geography
El Cerrito is located in the San Francisco Bay Area of California, in Contra Costa County. It is situated on the eastern shore of San Francisco Bay, just north of Berkeley and Oakland. The city covers an area of 4.2 square miles, with a population density of 5,717 people per square mile.
The city is bordered by the cities of Albany to the north, Richmond to the east, and Kensington to the south. The city is also bordered by the unincorporated communities of El Sobrante to the west and East Richmond Heights to the south.
The city is located at an elevation of about 200 feet above sea level, and is situated on a series of rolling hills. The city is home to several parks, including Cerrito Vista Park, Hillside Natural Area, and El Cerrito Plaza.
Economy
The economy of El Cerrito is largely based on the service industry, with many of the city’s residents employed in retail, healthcare, and education. The city is also home to several large employers, including the University of California, Berkeley, Kaiser Permanente, and the Lawrence Berkeley National Laboratory.
The city is also home to several small businesses, including restaurants, cafes, and retail stores. The city is also home to several large shopping centers, including El Cerrito Plaza and El Cerrito Plaza Shopping Center.
Demographics
As of the 2020 census, the population of El Cerrito was 24,072. The racial makeup of the city was 57.2% White, 16.2% Asian, 15.2% Hispanic or Latino, 8.2% African American, 0.7% Native American, and 2.7% from other races.
The median household income in El Cerrito was $90,845 in 2020, and the median home value was $817,000. The city has a high rate of homeownership, with over 70% of the population owning their own homes.
El Cerrito is a diverse city, with a large population of immigrants from all over the world. The city is home to a large population of Chinese, Filipino, and Mexican immigrants, as well as a growing population of African and Middle Eastern immigrants.
Common Questions
What is Per Capita Income in El Cerrito?
Per Capita income in El Cerrito is $37,584.
What is the Median Family Income in El Cerrito?
Median Family Income in El Cerrito is $115,081.
What is the Median Household income in El Cerrito?
Median Household Income in El Cerrito is $122,885.
What is Income or Wage Gap in El Cerrito?
Income or Wage Gap in El Cerrito is 36.7%.
Women in El Cerrito earn 63.3 cents for every dollar earned by a man.
What is Inequality or Gini Index in El Cerrito?
Inequality or Gini Index in El Cerrito is 0.31.
What is the Total Population of El Cerrito?
Total Population of El Cerrito is 5,328.
What is the Total Male Population of El Cerrito?
Total Male Population of El Cerrito is 2,567.
What is the Total Female Population of El Cerrito?
Total Female Population of El Cerrito is 2,761.
What is the Ratio of Males per 100 Females in El Cerrito?
There are 92.97 Males per 100 Females in El Cerrito.
What is the Ratio of Females per 100 Males in El Cerrito?
There are 107.56 Females per 100 Males in El Cerrito.
What is the Median Population Age in El Cerrito?
Median Population Age in El Cerrito is 36.5 Years.
What is the Average Family Size in El Cerrito
Average Family Size in El Cerrito is 3.9 People.
What is the Average Household Size in El Cerrito
Average Household Size in El Cerrito is 3.7 People.
How Large is the Labor Force in El Cerrito?
There are 2,699 People in the Labor Forcein in El Cerrito.
What is the Percentage of People in the Labor Force in El Cerrito?
62.3% of People are in the Labor Force in El Cerrito.
What is the Unemployment Rate in El Cerrito?
Unemployment Rate in El Cerrito is 3.1%.