Cities with the Lowest Poverty Level Among Married Couples in Virginia
RELATED REPORTS & OPTIONS
Lowest Poverty | Married Couple
Virginia
Compare Cities
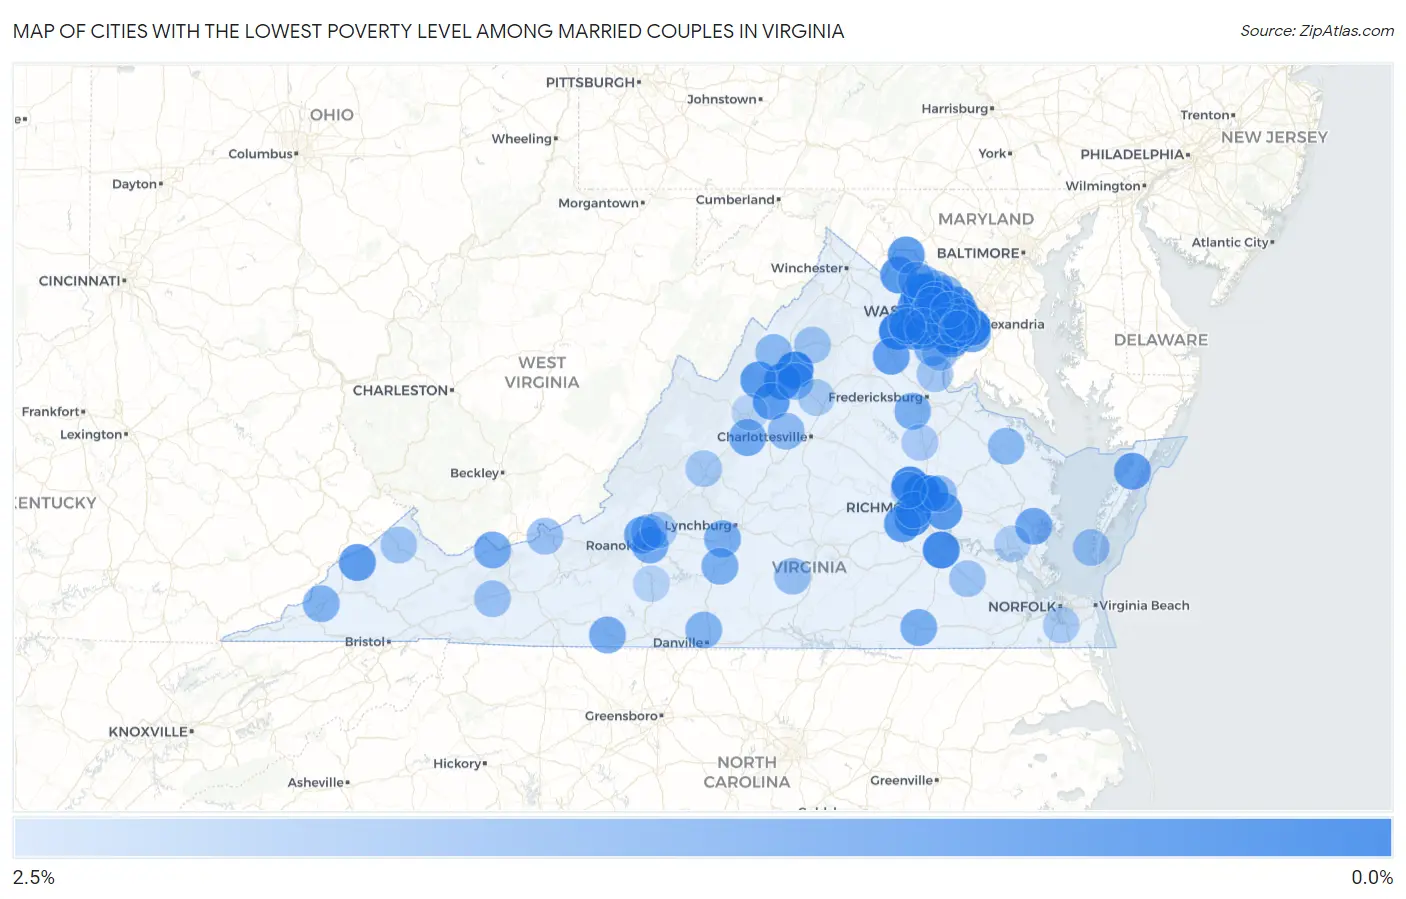
Map of Cities with the Lowest Poverty Level Among Married Couples in Virginia
2.5%
0.0%
Cities with the Lowest Poverty Level Among Married Couples in Virginia
| City | Married Couples Poverty | vs State | vs National | |
| 1. | New Baltimore | 0.14% | 3.2%(-3.06)#1 | 4.5%(-4.32)#18 |
| 2. | Laurel | 0.16% | 3.2%(-3.05)#2 | 4.5%(-4.30)#21 |
| 3. | Shenandoah | 0.18% | 3.2%(-3.03)#3 | 4.5%(-4.28)#24 |
| 4. | Dunn Loring | 0.23% | 3.2%(-2.97)#4 | 4.5%(-4.23)#42 |
| 5. | Broadlands | 0.27% | 3.2%(-2.93)#5 | 4.5%(-4.19)#55 |
| 6. | South Run | 0.34% | 3.2%(-2.87)#6 | 4.5%(-4.12)#93 |
| 7. | Wyndham | 0.39% | 3.2%(-2.82)#7 | 4.5%(-4.07)#129 |
| 8. | Fort Lee | 0.39% | 3.2%(-2.81)#8 | 4.5%(-4.07)#134 |
| 9. | Manassas Park | 0.40% | 3.2%(-2.81)#9 | 4.5%(-4.07)#136 |
| 10. | Rose Hill Cdp Fairfax County | 0.46% | 3.2%(-2.75)#10 | 4.5%(-4.00)#204 |
| 11. | Mclean | 0.48% | 3.2%(-2.73)#11 | 4.5%(-3.98)#223 |
| 12. | Rockwood | 0.49% | 3.2%(-2.72)#12 | 4.5%(-3.98)#227 |
| 13. | Newington | 0.54% | 3.2%(-2.67)#13 | 4.5%(-3.92)#297 |
| 14. | Wolf Trap | 0.54% | 3.2%(-2.66)#14 | 4.5%(-3.92)#298 |
| 15. | Stone Ridge | 0.56% | 3.2%(-2.65)#15 | 4.5%(-3.90)#323 |
| 16. | Linton Hall | 0.56% | 3.2%(-2.64)#16 | 4.5%(-3.90)#326 |
| 17. | Huntington | 0.57% | 3.2%(-2.64)#17 | 4.5%(-3.89)#338 |
| 18. | Massanutten | 0.58% | 3.2%(-2.63)#18 | 4.5%(-3.88)#352 |
| 19. | Brambleton | 0.66% | 3.2%(-2.55)#19 | 4.5%(-3.81)#449 |
| 20. | Dranesville | 0.67% | 3.2%(-2.53)#20 | 4.5%(-3.79)#485 |
| 21. | Sandston | 0.70% | 3.2%(-2.51)#21 | 4.5%(-3.76)#526 |
| 22. | Chamberlayne | 0.71% | 3.2%(-2.50)#22 | 4.5%(-3.75)#545 |
| 23. | Laurel Hill | 0.71% | 3.2%(-2.49)#23 | 4.5%(-3.75)#546 |
| 24. | Purcellville | 0.72% | 3.2%(-2.49)#24 | 4.5%(-3.75)#556 |
| 25. | Dayton | 0.72% | 3.2%(-2.49)#25 | 4.5%(-3.74)#562 |
| 26. | Grottoes | 0.73% | 3.2%(-2.47)#26 | 4.5%(-3.73)#588 |
| 27. | Woodlake | 0.76% | 3.2%(-2.45)#27 | 4.5%(-3.70)#643 |
| 28. | Lovettsville | 0.79% | 3.2%(-2.42)#28 | 4.5%(-3.68)#715 |
| 29. | Kings Park West | 0.79% | 3.2%(-2.41)#29 | 4.5%(-3.67)#734 |
| 30. | Burke | 0.80% | 3.2%(-2.40)#30 | 4.5%(-3.66)#758 |
| 31. | Clintwood | 0.83% | 3.2%(-2.38)#31 | 4.5%(-3.63)#824 |
| 32. | Parksley | 0.90% | 3.2%(-2.31)#32 | 4.5%(-3.56)#957 |
| 33. | Bealeton | 0.91% | 3.2%(-2.30)#33 | 4.5%(-3.55)#972 |
| 34. | Newington Forest | 0.94% | 3.2%(-2.27)#34 | 4.5%(-3.52)#1,058 |
| 35. | Fort Hunt | 0.96% | 3.2%(-2.25)#35 | 4.5%(-3.50)#1,104 |
| 36. | Kingstowne | 0.97% | 3.2%(-2.24)#36 | 4.5%(-3.49)#1,124 |
| 37. | Hollins | 0.97% | 3.2%(-2.23)#37 | 4.5%(-3.49)#1,145 |
| 38. | Falls Church | 1.0% | 3.2%(-2.19)#38 | 4.5%(-3.45)#1,241 |
| 39. | Greenbriar | 1.0% | 3.2%(-2.16)#39 | 4.5%(-3.42)#1,313 |
| 40. | Oakton | 1.1% | 3.2%(-2.11)#40 | 4.5%(-3.36)#1,419 |
| 41. | Gloucester Courthouse | 1.1% | 3.2%(-2.11)#41 | 4.5%(-3.36)#1,422 |
| 42. | Midlothian | 1.1% | 3.2%(-2.10)#42 | 4.5%(-3.35)#1,457 |
| 43. | Loudoun Valley Estates | 1.1% | 3.2%(-2.08)#43 | 4.5%(-3.34)#1,486 |
| 44. | Haymarket | 1.1% | 3.2%(-2.07)#44 | 4.5%(-3.32)#1,529 |
| 45. | Bluefield | 1.2% | 3.2%(-2.03)#45 | 4.5%(-3.29)#1,612 |
| 46. | Vinton | 1.2% | 3.2%(-2.02)#46 | 4.5%(-3.28)#1,636 |
| 47. | Stuarts Draft | 1.2% | 3.2%(-2.02)#47 | 4.5%(-3.28)#1,642 |
| 48. | Union Mill | 1.2% | 3.2%(-1.96)#48 | 4.5%(-3.22)#1,785 |
| 49. | Stuart | 1.3% | 3.2%(-1.96)#49 | 4.5%(-3.21)#1,788 |
| 50. | Timberlake | 1.3% | 3.2%(-1.94)#50 | 4.5%(-3.19)#1,848 |
| 51. | Emporia | 1.3% | 3.2%(-1.93)#51 | 4.5%(-3.19)#1,861 |
| 52. | Spotsylvania Courthouse | 1.3% | 3.2%(-1.91)#52 | 4.5%(-3.17)#1,914 |
| 53. | Altavista | 1.3% | 3.2%(-1.88)#53 | 4.5%(-3.14)#1,997 |
| 54. | Great Falls | 1.4% | 3.2%(-1.80)#54 | 4.5%(-3.06)#2,224 |
| 55. | Big Stone Gap | 1.4% | 3.2%(-1.78)#55 | 4.5%(-3.03)#2,278 |
| 56. | Independent Hill | 1.4% | 3.2%(-1.77)#56 | 4.5%(-3.02)#2,305 |
| 57. | Belle Haven | 1.4% | 3.2%(-1.77)#57 | 4.5%(-3.02)#2,308 |
| 58. | Cascades | 1.4% | 3.2%(-1.76)#58 | 4.5%(-3.01)#2,330 |
| 59. | Mount Hermon | 1.5% | 3.2%(-1.75)#59 | 4.5%(-3.00)#2,370 |
| 60. | Ashburn | 1.5% | 3.2%(-1.71)#60 | 4.5%(-2.97)#2,466 |
| 61. | Lansdowne | 1.5% | 3.2%(-1.69)#61 | 4.5%(-2.95)#2,514 |
| 62. | Bon Air | 1.5% | 3.2%(-1.66)#62 | 4.5%(-2.91)#2,604 |
| 63. | Elkton | 1.6% | 3.2%(-1.64)#63 | 4.5%(-2.89)#2,655 |
| 64. | Broadway | 1.6% | 3.2%(-1.63)#64 | 4.5%(-2.89)#2,662 |
| 65. | Warsaw | 1.6% | 3.2%(-1.63)#65 | 4.5%(-2.88)#2,693 |
| 66. | Chantilly | 1.6% | 3.2%(-1.61)#66 | 4.5%(-2.87)#2,740 |
| 67. | Crozet | 1.6% | 3.2%(-1.60)#67 | 4.5%(-2.86)#2,760 |
| 68. | Lake Barcroft | 1.6% | 3.2%(-1.56)#68 | 4.5%(-2.82)#2,884 |
| 69. | Crosspointe | 1.7% | 3.2%(-1.50)#69 | 4.5%(-2.76)#3,021 |
| 70. | Leesburg | 1.7% | 3.2%(-1.48)#70 | 4.5%(-2.73)#3,090 |
| 71. | Cape Charles | 1.7% | 3.2%(-1.48)#71 | 4.5%(-2.73)#3,098 |
| 72. | Cloverdale | 1.7% | 3.2%(-1.46)#72 | 4.5%(-2.72)#3,123 |
| 73. | Mechanicsville | 1.7% | 3.2%(-1.46)#73 | 4.5%(-2.71)#3,138 |
| 74. | Charlotte Court House | 1.8% | 3.2%(-1.45)#74 | 4.5%(-2.71)#3,147 |
| 75. | Rural Retreat | 1.8% | 3.2%(-1.45)#75 | 4.5%(-2.70)#3,160 |
| 76. | Narrows | 1.8% | 3.2%(-1.43)#76 | 4.5%(-2.68)#3,215 |
| 77. | Manassas | 1.8% | 3.2%(-1.41)#77 | 4.5%(-2.66)#3,274 |
| 78. | Long Branch | 1.8% | 3.2%(-1.39)#78 | 4.5%(-2.65)#3,318 |
| 79. | Grundy | 1.8% | 3.2%(-1.37)#79 | 4.5%(-2.63)#3,365 |
| 80. | Waverly | 1.8% | 3.2%(-1.37)#80 | 4.5%(-2.62)#3,373 |
| 81. | Luray | 1.8% | 3.2%(-1.36)#81 | 4.5%(-2.61)#3,392 |
| 82. | Aquia Harbour | 1.9% | 3.2%(-1.28)#82 | 4.5%(-2.54)#3,560 |
| 83. | Montclair | 1.9% | 3.2%(-1.27)#83 | 4.5%(-2.52)#3,599 |
| 84. | East Lexington | 2.0% | 3.2%(-1.24)#84 | 4.5%(-2.49)#3,679 |
| 85. | Herndon | 2.0% | 3.2%(-1.23)#85 | 4.5%(-2.49)#3,700 |
| 86. | Stanardsville | 2.0% | 3.2%(-1.19)#86 | 4.5%(-2.44)#3,810 |
| 87. | Burke Centre | 2.0% | 3.2%(-1.17)#87 | 4.5%(-2.43)#3,838 |
| 88. | Blue Ridge | 2.0% | 3.2%(-1.16)#88 | 4.5%(-2.42)#3,870 |
| 89. | Lake Caroline | 2.1% | 3.2%(-1.14)#89 | 4.5%(-2.40)#3,917 |
| 90. | Floris | 2.1% | 3.2%(-1.14)#90 | 4.5%(-2.39)#3,937 |
| 91. | Short Pump | 2.1% | 3.2%(-1.11)#91 | 4.5%(-2.36)#4,019 |
| 92. | Lincolnia | 2.1% | 3.2%(-1.11)#92 | 4.5%(-2.36)#4,024 |
| 93. | Chesapeake | 2.1% | 3.2%(-1.09)#93 | 4.5%(-2.35)#4,070 |
| 94. | Sudley | 2.1% | 3.2%(-1.08)#94 | 4.5%(-2.34)#4,091 |
| 95. | Williamsburg | 2.1% | 3.2%(-1.08)#95 | 4.5%(-2.34)#4,093 |
| 96. | Rocky Mount | 2.2% | 3.2%(-0.979)#96 | 4.5%(-2.23)#4,368 |
| 97. | Vienna | 2.2% | 3.2%(-0.974)#97 | 4.5%(-2.23)#4,382 |
| 98. | Springfield | 2.3% | 3.2%(-0.938)#98 | 4.5%(-2.19)#4,467 |
| 99. | Gainesville | 2.3% | 3.2%(-0.933)#99 | 4.5%(-2.19)#4,491 |
| 100. | Verona | 2.3% | 3.2%(-0.931)#100 | 4.5%(-2.19)#4,492 |
Common Questions
What are the Top 10 Cities with the Lowest Poverty Level Among Married Couples in Virginia?
Top 10 Cities with the Lowest Poverty Level Among Married Couples in Virginia are:
#1
0.14%
#2
0.16%
#3
0.18%
#4
0.23%
#5
0.27%
#6
0.34%
#7
0.39%
#8
0.39%
#9
0.40%
#10
0.48%
What city has the Lowest Poverty Level Among Married Couples in Virginia?
New Baltimore has the Lowest Poverty Level Among Married Couples in Virginia with 0.14%.
What is the Poverty Level Among Married Couples in the State of Virginia?
Poverty Level Among Married Couples in Virginia is 3.2%.
What is the Poverty Level Among Married Couples in the United States?
Poverty Level Among Married Couples in the United States is 4.5%.