Cities with the Lowest Poverty Level Among Married Couples in Michigan
RELATED REPORTS & OPTIONS
Lowest Poverty | Married Couple
Michigan
Compare Cities
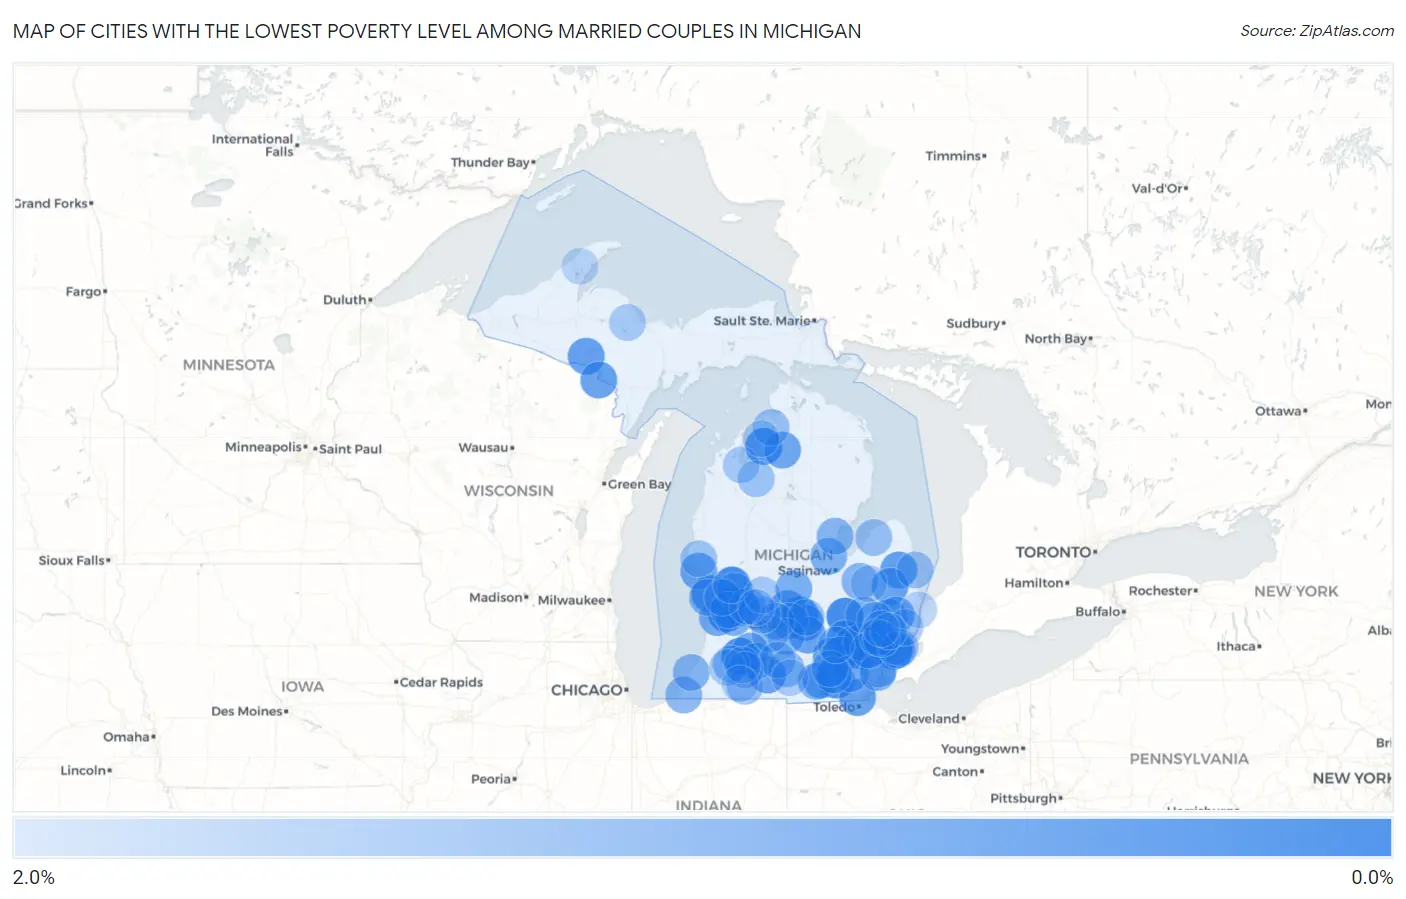
Map of Cities with the Lowest Poverty Level Among Married Couples in Michigan
2.0%
0.0%
Cities with the Lowest Poverty Level Among Married Couples in Michigan
| City | Married Couples Poverty | vs State | vs National | |
| 1. | Walker | 0.20% | 4.2%(-3.97)#1 | 4.5%(-4.26)#29 |
| 2. | Bingham Farms | 0.35% | 4.2%(-3.81)#2 | 4.5%(-4.11)#104 |
| 3. | Northville | 0.36% | 4.2%(-3.81)#3 | 4.5%(-4.11)#108 |
| 4. | Linden | 0.39% | 4.2%(-3.77)#4 | 4.5%(-4.07)#131 |
| 5. | Hudsonville | 0.42% | 4.2%(-3.75)#5 | 4.5%(-4.04)#161 |
| 6. | Westwood | 0.43% | 4.2%(-3.73)#6 | 4.5%(-4.03)#174 |
| 7. | Tecumseh | 0.49% | 4.2%(-3.68)#7 | 4.5%(-3.97)#228 |
| 8. | East Grand Rapids | 0.51% | 4.2%(-3.65)#8 | 4.5%(-3.95)#260 |
| 9. | Brighton | 0.53% | 4.2%(-3.64)#9 | 4.5%(-3.93)#279 |
| 10. | Grosse Pointe Park | 0.55% | 4.2%(-3.62)#10 | 4.5%(-3.92)#304 |
| 11. | Dewitt | 0.55% | 4.2%(-3.61)#11 | 4.5%(-3.91)#311 |
| 12. | Bellaire | 0.60% | 4.2%(-3.56)#12 | 4.5%(-3.86)#380 |
| 13. | Fruitport | 0.62% | 4.2%(-3.54)#13 | 4.5%(-3.84)#407 |
| 14. | Berkley | 0.66% | 4.2%(-3.51)#14 | 4.5%(-3.80)#453 |
| 15. | Plymouth | 0.68% | 4.2%(-3.49)#15 | 4.5%(-3.79)#490 |
| 16. | South Lyon | 0.70% | 4.2%(-3.46)#16 | 4.5%(-3.76)#531 |
| 17. | East Lansing | 0.73% | 4.2%(-3.43)#17 | 4.5%(-3.73)#578 |
| 18. | Chelsea | 0.74% | 4.2%(-3.43)#18 | 4.5%(-3.72)#593 |
| 19. | Sandusky | 0.74% | 4.2%(-3.43)#19 | 4.5%(-3.72)#594 |
| 20. | Kent City | 0.75% | 4.2%(-3.41)#20 | 4.5%(-3.71)#623 |
| 21. | Crystal Falls | 0.77% | 4.2%(-3.40)#21 | 4.5%(-3.69)#667 |
| 22. | Dexter | 0.77% | 4.2%(-3.39)#22 | 4.5%(-3.69)#673 |
| 23. | Temperance | 0.79% | 4.2%(-3.38)#23 | 4.5%(-3.67)#723 |
| 24. | Union City | 0.79% | 4.2%(-3.37)#24 | 4.5%(-3.67)#732 |
| 25. | Kingsford | 0.80% | 4.2%(-3.36)#25 | 4.5%(-3.66)#757 |
| 26. | Ferndale | 0.82% | 4.2%(-3.34)#26 | 4.5%(-3.64)#810 |
| 27. | Brown City | 0.83% | 4.2%(-3.34)#27 | 4.5%(-3.64)#813 |
| 28. | Mason | 0.83% | 4.2%(-3.33)#28 | 4.5%(-3.63)#826 |
| 29. | Westphalia | 0.84% | 4.2%(-3.32)#29 | 4.5%(-3.62)#845 |
| 30. | Onsted | 0.85% | 4.2%(-3.31)#30 | 4.5%(-3.61)#869 |
| 31. | Huntington Woods | 0.85% | 4.2%(-3.31)#31 | 4.5%(-3.61)#873 |
| 32. | Romeo | 0.88% | 4.2%(-3.28)#32 | 4.5%(-3.58)#923 |
| 33. | Lakes Of The North | 0.89% | 4.2%(-3.27)#33 | 4.5%(-3.57)#938 |
| 34. | Whitehall | 0.91% | 4.2%(-3.25)#34 | 4.5%(-3.55)#982 |
| 35. | Milan | 0.92% | 4.2%(-3.24)#35 | 4.5%(-3.54)#1,014 |
| 36. | Armada | 0.93% | 4.2%(-3.24)#36 | 4.5%(-3.54)#1,022 |
| 37. | Zeeland | 0.94% | 4.2%(-3.22)#37 | 4.5%(-3.52)#1,061 |
| 38. | Richland | 0.94% | 4.2%(-3.22)#38 | 4.5%(-3.52)#1,066 |
| 39. | Climax | 1.0% | 4.2%(-3.15)#39 | 4.5%(-3.45)#1,243 |
| 40. | Perrinton | 1.1% | 4.2%(-3.09)#40 | 4.5%(-3.39)#1,380 |
| 41. | Auburn | 1.1% | 4.2%(-3.08)#41 | 4.5%(-3.37)#1,402 |
| 42. | Novi | 1.1% | 4.2%(-3.06)#42 | 4.5%(-3.36)#1,433 |
| 43. | Spring Lake | 1.1% | 4.2%(-3.06)#43 | 4.5%(-3.36)#1,439 |
| 44. | Trenton | 1.1% | 4.2%(-3.06)#44 | 4.5%(-3.35)#1,444 |
| 45. | Grand Ledge | 1.1% | 4.2%(-3.05)#45 | 4.5%(-3.34)#1,469 |
| 46. | Byron Center | 1.1% | 4.2%(-3.03)#46 | 4.5%(-3.32)#1,525 |
| 47. | Royal Oak | 1.2% | 4.2%(-3.00)#47 | 4.5%(-3.30)#1,598 |
| 48. | Manitou Beach Devils Lake | 1.2% | 4.2%(-3.00)#48 | 4.5%(-3.30)#1,599 |
| 49. | Sparta | 1.2% | 4.2%(-2.99)#49 | 4.5%(-3.29)#1,616 |
| 50. | Three Oaks | 1.2% | 4.2%(-2.97)#50 | 4.5%(-3.27)#1,653 |
| 51. | Millington | 1.2% | 4.2%(-2.97)#51 | 4.5%(-3.27)#1,654 |
| 52. | Ortonville | 1.2% | 4.2%(-2.96)#52 | 4.5%(-3.26)#1,685 |
| 53. | Charlotte | 1.2% | 4.2%(-2.96)#53 | 4.5%(-3.26)#1,687 |
| 54. | St Joseph | 1.2% | 4.2%(-2.95)#54 | 4.5%(-3.25)#1,709 |
| 55. | Pinconning | 1.2% | 4.2%(-2.95)#55 | 4.5%(-3.25)#1,711 |
| 56. | Sunfield | 1.2% | 4.2%(-2.94)#56 | 4.5%(-3.24)#1,729 |
| 57. | Clinton | 1.2% | 4.2%(-2.93)#57 | 4.5%(-3.23)#1,771 |
| 58. | Gibraltar | 1.2% | 4.2%(-2.92)#58 | 4.5%(-3.22)#1,775 |
| 59. | Lake Orion | 1.3% | 4.2%(-2.91)#59 | 4.5%(-3.21)#1,799 |
| 60. | Livonia | 1.3% | 4.2%(-2.90)#60 | 4.5%(-3.19)#1,849 |
| 61. | Grosse Pointe Woods | 1.3% | 4.2%(-2.84)#61 | 4.5%(-3.13)#2,003 |
| 62. | Mattawan | 1.3% | 4.2%(-2.83)#62 | 4.5%(-3.12)#2,038 |
| 63. | Homer | 1.3% | 4.2%(-2.83)#63 | 4.5%(-3.12)#2,039 |
| 64. | Nashville | 1.4% | 4.2%(-2.81)#64 | 4.5%(-3.10)#2,095 |
| 65. | Manchester | 1.4% | 4.2%(-2.79)#65 | 4.5%(-3.09)#2,140 |
| 66. | Village Of Grosse Pointe Shores | 1.4% | 4.2%(-2.78)#66 | 4.5%(-3.08)#2,153 |
| 67. | Three Lakes | 1.4% | 4.2%(-2.78)#67 | 4.5%(-3.07)#2,182 |
| 68. | Jenison | 1.4% | 4.2%(-2.77)#68 | 4.5%(-3.07)#2,189 |
| 69. | Pigeon | 1.4% | 4.2%(-2.74)#69 | 4.5%(-3.04)#2,260 |
| 70. | Port Sanilac | 1.4% | 4.2%(-2.73)#70 | 4.5%(-3.02)#2,312 |
| 71. | Centreville | 1.4% | 4.2%(-2.72)#71 | 4.5%(-3.02)#2,320 |
| 72. | Clarksville | 1.4% | 4.2%(-2.72)#72 | 4.5%(-3.01)#2,345 |
| 73. | Bath | 1.5% | 4.2%(-2.70)#73 | 4.5%(-3.00)#2,376 |
| 74. | Grosse Pointe Farms | 1.5% | 4.2%(-2.69)#74 | 4.5%(-2.99)#2,391 |
| 75. | Advance | 1.5% | 4.2%(-2.69)#75 | 4.5%(-2.99)#2,404 |
| 76. | Marshall | 1.5% | 4.2%(-2.68)#76 | 4.5%(-2.98)#2,426 |
| 77. | New Era | 1.5% | 4.2%(-2.67)#77 | 4.5%(-2.97)#2,458 |
| 78. | Fife Lake | 1.5% | 4.2%(-2.67)#78 | 4.5%(-2.97)#2,461 |
| 79. | Forest Hills | 1.5% | 4.2%(-2.67)#79 | 4.5%(-2.96)#2,469 |
| 80. | Coopersville | 1.5% | 4.2%(-2.66)#80 | 4.5%(-2.95)#2,502 |
| 81. | Vicksburg | 1.6% | 4.2%(-2.61)#81 | 4.5%(-2.91)#2,614 |
| 82. | Birmingham | 1.6% | 4.2%(-2.59)#82 | 4.5%(-2.89)#2,661 |
| 83. | Casnovia | 1.6% | 4.2%(-2.58)#83 | 4.5%(-2.87)#2,716 |
| 84. | Lawton | 1.6% | 4.2%(-2.57)#84 | 4.5%(-2.87)#2,737 |
| 85. | Belding | 1.6% | 4.2%(-2.56)#85 | 4.5%(-2.86)#2,758 |
| 86. | Traverse City | 1.6% | 4.2%(-2.56)#86 | 4.5%(-2.86)#2,766 |
| 87. | Lowell | 1.6% | 4.2%(-2.55)#87 | 4.5%(-2.85)#2,777 |
| 88. | New Baltimore | 1.6% | 4.2%(-2.53)#88 | 4.5%(-2.82)#2,850 |
| 89. | Negaunee | 1.6% | 4.2%(-2.52)#89 | 4.5%(-2.82)#2,875 |
| 90. | Litchfield | 1.7% | 4.2%(-2.51)#90 | 4.5%(-2.80)#2,919 |
| 91. | Portage | 1.7% | 4.2%(-2.50)#91 | 4.5%(-2.80)#2,922 |
| 92. | Pinckney | 1.7% | 4.2%(-2.48)#92 | 4.5%(-2.78)#2,958 |
| 93. | Three Rivers | 1.7% | 4.2%(-2.47)#93 | 4.5%(-2.77)#3,008 |
| 94. | Fostoria | 1.7% | 4.2%(-2.45)#94 | 4.5%(-2.75)#3,056 |
| 95. | Clawson | 1.7% | 4.2%(-2.44)#95 | 4.5%(-2.74)#3,070 |
| 96. | Central Lake | 1.7% | 4.2%(-2.42)#96 | 4.5%(-2.72)#3,128 |
| 97. | Marysville | 1.8% | 4.2%(-2.39)#97 | 4.5%(-2.69)#3,196 |
| 98. | Utica | 1.8% | 4.2%(-2.36)#98 | 4.5%(-2.66)#3,291 |
| 99. | Rochester Hills | 1.8% | 4.2%(-2.35)#99 | 4.5%(-2.65)#3,305 |
| 100. | Hubbell | 1.8% | 4.2%(-2.35)#100 | 4.5%(-2.64)#3,324 |
Common Questions
What are the Top 10 Cities with the Lowest Poverty Level Among Married Couples in Michigan?
Top 10 Cities with the Lowest Poverty Level Among Married Couples in Michigan are:
#1
0.20%
#2
0.35%
#3
0.36%
#4
0.39%
#5
0.42%
#6
0.43%
#7
0.49%
#8
0.51%
#9
0.53%
#10
0.55%
What city has the Lowest Poverty Level Among Married Couples in Michigan?
Walker has the Lowest Poverty Level Among Married Couples in Michigan with 0.20%.
What is the Poverty Level Among Married Couples in the State of Michigan?
Poverty Level Among Married Couples in Michigan is 4.2%.
What is the Poverty Level Among Married Couples in the United States?
Poverty Level Among Married Couples in the United States is 4.5%.