Cities with the Lowest Poverty Level Among Married Couples in Pennsylvania
RELATED REPORTS & OPTIONS
Lowest Poverty | Married Couple
Pennsylvania
Compare Cities
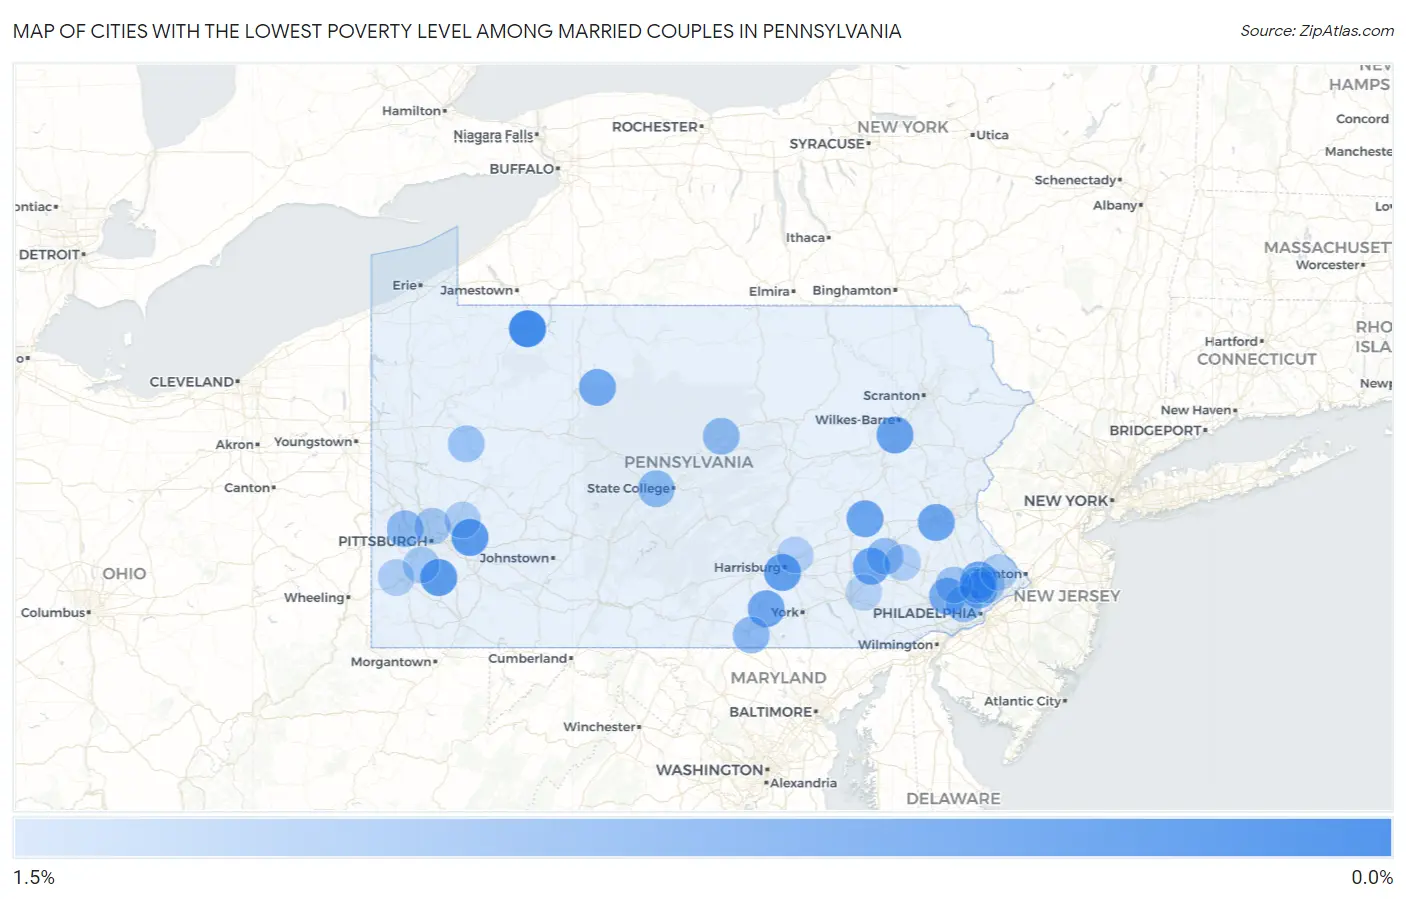
Map of Cities with the Lowest Poverty Level Among Married Couples in Pennsylvania
1.5%
0.0%
Cities with the Lowest Poverty Level Among Married Couples in Pennsylvania
| City | Married Couples Poverty | vs State | vs National | |
| 1. | Media Borough | 0.10% | 3.5%(-3.36)#1 | 4.5%(-4.36)#7 |
| 2. | Conshohocken Borough | 0.12% | 3.5%(-3.35)#2 | 4.5%(-4.35)#8 |
| 3. | Warren | 0.20% | 3.5%(-3.27)#3 | 4.5%(-4.27)#27 |
| 4. | Murrysville | 0.40% | 3.5%(-3.07)#4 | 4.5%(-4.07)#135 |
| 5. | Monongahela | 0.41% | 3.5%(-3.05)#5 | 4.5%(-4.05)#149 |
| 6. | Oakmont Borough | 0.41% | 3.5%(-3.05)#6 | 4.5%(-4.05)#157 |
| 7. | Hulmeville Borough | 0.42% | 3.5%(-3.04)#7 | 4.5%(-4.04)#164 |
| 8. | Lower Allen | 0.47% | 3.5%(-2.99)#8 | 4.5%(-3.99)#211 |
| 9. | Mountain Top | 0.50% | 3.5%(-2.96)#9 | 4.5%(-3.96)#244 |
| 10. | Lake Wynonah | 0.52% | 3.5%(-2.94)#10 | 4.5%(-3.94)#270 |
| 11. | Wescosville | 0.53% | 3.5%(-2.94)#11 | 4.5%(-3.94)#272 |
| 12. | Old Forge Borough | 0.53% | 3.5%(-2.93)#12 | 4.5%(-3.93)#278 |
| 13. | Reinholds | 0.53% | 3.5%(-2.93)#13 | 4.5%(-3.93)#280 |
| 14. | Maple Glen | 0.53% | 3.5%(-2.93)#14 | 4.5%(-3.93)#281 |
| 15. | Dauphin Borough | 0.55% | 3.5%(-2.91)#15 | 4.5%(-3.92)#305 |
| 16. | Lake Meade | 0.57% | 3.5%(-2.89)#16 | 4.5%(-3.90)#332 |
| 17. | Robesonia Borough | 0.57% | 3.5%(-2.89)#17 | 4.5%(-3.90)#333 |
| 18. | Freemansburg Borough | 0.57% | 3.5%(-2.89)#18 | 4.5%(-3.89)#340 |
| 19. | St Marys | 0.59% | 3.5%(-2.87)#19 | 4.5%(-3.87)#365 |
| 20. | Shiremanstown Borough | 0.59% | 3.5%(-2.87)#20 | 4.5%(-3.87)#369 |
| 21. | Honey Brook Borough | 0.60% | 3.5%(-2.86)#21 | 4.5%(-3.86)#373 |
| 22. | Crafton Borough | 0.63% | 3.5%(-2.84)#22 | 4.5%(-3.84)#410 |
| 23. | Mercer Borough | 0.63% | 3.5%(-2.83)#23 | 4.5%(-3.83)#413 |
| 24. | Somerset Borough | 0.63% | 3.5%(-2.83)#24 | 4.5%(-3.83)#417 |
| 25. | Chesterbrook | 0.63% | 3.5%(-2.83)#25 | 4.5%(-3.83)#419 |
| 26. | Roslyn | 0.63% | 3.5%(-2.83)#26 | 4.5%(-3.83)#421 |
| 27. | Forest Hills Borough | 0.64% | 3.5%(-2.82)#27 | 4.5%(-3.82)#432 |
| 28. | Sankertown Borough | 0.65% | 3.5%(-2.82)#28 | 4.5%(-3.82)#437 |
| 29. | North Irwin Borough | 0.66% | 3.5%(-2.80)#29 | 4.5%(-3.80)#452 |
| 30. | Oreland | 0.66% | 3.5%(-2.80)#30 | 4.5%(-3.80)#462 |
| 31. | Mount Holly Springs Borough | 0.66% | 3.5%(-2.80)#31 | 4.5%(-3.80)#463 |
| 32. | Rose Valley Borough | 0.67% | 3.5%(-2.79)#32 | 4.5%(-3.79)#477 |
| 33. | Freeburg Borough | 0.70% | 3.5%(-2.76)#33 | 4.5%(-3.76)#529 |
| 34. | West Grove Borough | 0.71% | 3.5%(-2.76)#34 | 4.5%(-3.76)#534 |
| 35. | Langhorne Borough | 0.71% | 3.5%(-2.75)#35 | 4.5%(-3.75)#541 |
| 36. | Saegertown Borough | 0.71% | 3.5%(-2.75)#36 | 4.5%(-3.75)#552 |
| 37. | Quakertown Borough | 0.74% | 3.5%(-2.72)#37 | 4.5%(-3.72)#606 |
| 38. | North Catasauqua Borough | 0.75% | 3.5%(-2.72)#38 | 4.5%(-3.72)#608 |
| 39. | Ridley Park Borough | 0.75% | 3.5%(-2.71)#39 | 4.5%(-3.71)#629 |
| 40. | Beaver Meadows Borough | 0.78% | 3.5%(-2.68)#40 | 4.5%(-3.68)#700 |
| 41. | Goldsboro Borough | 0.78% | 3.5%(-2.68)#41 | 4.5%(-3.68)#702 |
| 42. | Stormstown | 0.78% | 3.5%(-2.68)#42 | 4.5%(-3.68)#706 |
| 43. | Souderton Borough | 0.78% | 3.5%(-2.68)#43 | 4.5%(-3.68)#707 |
| 44. | West Middlesex Borough | 0.78% | 3.5%(-2.68)#44 | 4.5%(-3.68)#709 |
| 45. | Red Hill Borough | 0.79% | 3.5%(-2.67)#45 | 4.5%(-3.67)#735 |
| 46. | Lake Heritage | 0.81% | 3.5%(-2.66)#46 | 4.5%(-3.66)#764 |
| 47. | Carnot Moon | 0.81% | 3.5%(-2.65)#47 | 4.5%(-3.65)#769 |
| 48. | Elizabethtown Borough | 0.81% | 3.5%(-2.65)#48 | 4.5%(-3.65)#772 |
| 49. | Lock Haven | 0.82% | 3.5%(-2.64)#49 | 4.5%(-3.65)#788 |
| 50. | Clarks Green Borough | 0.82% | 3.5%(-2.64)#50 | 4.5%(-3.64)#809 |
| 51. | Shamokin Dam Borough | 0.83% | 3.5%(-2.63)#51 | 4.5%(-3.63)#832 |
| 52. | Roaring Spring Borough | 0.84% | 3.5%(-2.62)#52 | 4.5%(-3.62)#840 |
| 53. | Cresson Borough | 0.84% | 3.5%(-2.62)#53 | 4.5%(-3.62)#844 |
| 54. | Ben Avon Borough | 0.86% | 3.5%(-2.60)#54 | 4.5%(-3.60)#891 |
| 55. | Cross Roads Borough | 0.86% | 3.5%(-2.60)#55 | 4.5%(-3.60)#892 |
| 56. | Beaver Borough | 0.87% | 3.5%(-2.60)#56 | 4.5%(-3.60)#894 |
| 57. | Whitfield | 0.87% | 3.5%(-2.59)#57 | 4.5%(-3.59)#903 |
| 58. | Economy Borough | 0.88% | 3.5%(-2.58)#58 | 4.5%(-3.59)#911 |
| 59. | Chester Heights Borough | 0.88% | 3.5%(-2.58)#59 | 4.5%(-3.58)#914 |
| 60. | Callery Borough | 0.89% | 3.5%(-2.57)#60 | 4.5%(-3.57)#940 |
| 61. | Loganville Borough | 0.90% | 3.5%(-2.56)#61 | 4.5%(-3.56)#966 |
| 62. | Bryn Mawr | 0.91% | 3.5%(-2.55)#62 | 4.5%(-3.55)#990 |
| 63. | Dalton Borough | 0.92% | 3.5%(-2.54)#63 | 4.5%(-3.54)#997 |
| 64. | Tatamy Borough | 0.92% | 3.5%(-2.54)#64 | 4.5%(-3.54)#999 |
| 65. | Parker | 0.92% | 3.5%(-2.54)#65 | 4.5%(-3.54)#1,000 |
| 66. | Villanova | 0.92% | 3.5%(-2.54)#66 | 4.5%(-3.54)#1,004 |
| 67. | Mcsherrystown Borough | 0.92% | 3.5%(-2.54)#67 | 4.5%(-3.54)#1,005 |
| 68. | Burgettstown Borough | 0.92% | 3.5%(-2.54)#68 | 4.5%(-3.54)#1,010 |
| 69. | Penn Farms | 0.92% | 3.5%(-2.54)#69 | 4.5%(-3.54)#1,016 |
| 70. | Willow Grove | 0.93% | 3.5%(-2.53)#70 | 4.5%(-3.53)#1,036 |
| 71. | Trooper | 0.95% | 3.5%(-2.52)#71 | 4.5%(-3.52)#1,069 |
| 72. | Madison Borough | 0.95% | 3.5%(-2.51)#72 | 4.5%(-3.51)#1,091 |
| 73. | Frazer | 0.97% | 3.5%(-2.49)#73 | 4.5%(-3.49)#1,127 |
| 74. | Glenshaw | 0.98% | 3.5%(-2.48)#74 | 4.5%(-3.48)#1,152 |
| 75. | Delta Borough | 0.98% | 3.5%(-2.48)#75 | 4.5%(-3.48)#1,156 |
| 76. | Archbald Borough | 0.99% | 3.5%(-2.47)#76 | 4.5%(-3.48)#1,172 |
| 77. | Mcmurray | 0.99% | 3.5%(-2.47)#77 | 4.5%(-3.47)#1,176 |
| 78. | Jermyn Borough | 0.99% | 3.5%(-2.47)#78 | 4.5%(-3.47)#1,182 |
| 79. | Valencia Borough | 0.99% | 3.5%(-2.47)#79 | 4.5%(-3.47)#1,189 |
| 80. | Stewartstown Borough | 1.0% | 3.5%(-2.46)#80 | 4.5%(-3.46)#1,216 |
| 81. | Homer City Borough | 1.0% | 3.5%(-2.45)#81 | 4.5%(-3.45)#1,231 |
| 82. | Greenville Borough | 1.0% | 3.5%(-2.45)#82 | 4.5%(-3.45)#1,237 |
| 83. | Norwood Borough | 1.0% | 3.5%(-2.44)#83 | 4.5%(-3.45)#1,245 |
| 84. | West York Borough | 1.0% | 3.5%(-2.44)#84 | 4.5%(-3.45)#1,246 |
| 85. | Mechanicsville Borough | 1.0% | 3.5%(-2.42)#85 | 4.5%(-3.42)#1,307 |
| 86. | Alburtis Borough | 1.1% | 3.5%(-2.41)#86 | 4.5%(-3.41)#1,323 |
| 87. | Wolfdale | 1.1% | 3.5%(-2.41)#87 | 4.5%(-3.41)#1,324 |
| 88. | Lower Burrell | 1.1% | 3.5%(-2.40)#88 | 4.5%(-3.40)#1,358 |
| 89. | Fort Washington | 1.1% | 3.5%(-2.39)#89 | 4.5%(-3.40)#1,362 |
| 90. | Lorane | 1.1% | 3.5%(-2.39)#90 | 4.5%(-3.39)#1,374 |
| 91. | Bloomfield Borough | 1.1% | 3.5%(-2.39)#91 | 4.5%(-3.39)#1,377 |
| 92. | Aldan Borough | 1.1% | 3.5%(-2.38)#92 | 4.5%(-3.38)#1,386 |
| 93. | Richboro | 1.1% | 3.5%(-2.38)#93 | 4.5%(-3.38)#1,396 |
| 94. | Linglestown | 1.1% | 3.5%(-2.37)#94 | 4.5%(-3.37)#1,398 |
| 95. | Ferndale Borough | 1.1% | 3.5%(-2.37)#95 | 4.5%(-3.37)#1,403 |
| 96. | Centerville Borough Washington County | 1.1% | 3.5%(-2.35)#96 | 4.5%(-3.35)#1,442 |
| 97. | Orwigsburg Borough | 1.1% | 3.5%(-2.35)#97 | 4.5%(-3.35)#1,465 |
| 98. | Leola | 1.1% | 3.5%(-2.34)#98 | 4.5%(-3.34)#1,477 |
| 99. | Cooperstown Borough | 1.1% | 3.5%(-2.34)#99 | 4.5%(-3.34)#1,484 |
| 100. | Camp Hill Borough | 1.1% | 3.5%(-2.33)#100 | 4.5%(-3.33)#1,492 |
Common Questions
What are the Top 10 Cities with the Lowest Poverty Level Among Married Couples in Pennsylvania?
Top 10 Cities with the Lowest Poverty Level Among Married Couples in Pennsylvania are:
#1
0.20%
#2
0.40%
#3
0.41%
#4
0.47%
#5
0.50%
#6
0.52%
#7
0.53%
#8
0.53%
#9
0.53%
#10
0.57%
What city has the Lowest Poverty Level Among Married Couples in Pennsylvania?
Warren has the Lowest Poverty Level Among Married Couples in Pennsylvania with 0.20%.
What is the Poverty Level Among Married Couples in the State of Pennsylvania?
Poverty Level Among Married Couples in Pennsylvania is 3.5%.
What is the Poverty Level Among Married Couples in the United States?
Poverty Level Among Married Couples in the United States is 4.5%.