Cities with the Lowest Poverty Level Among Married Couples in Utah
RELATED REPORTS & OPTIONS
Lowest Poverty | Married Couple
Utah
Compare Cities
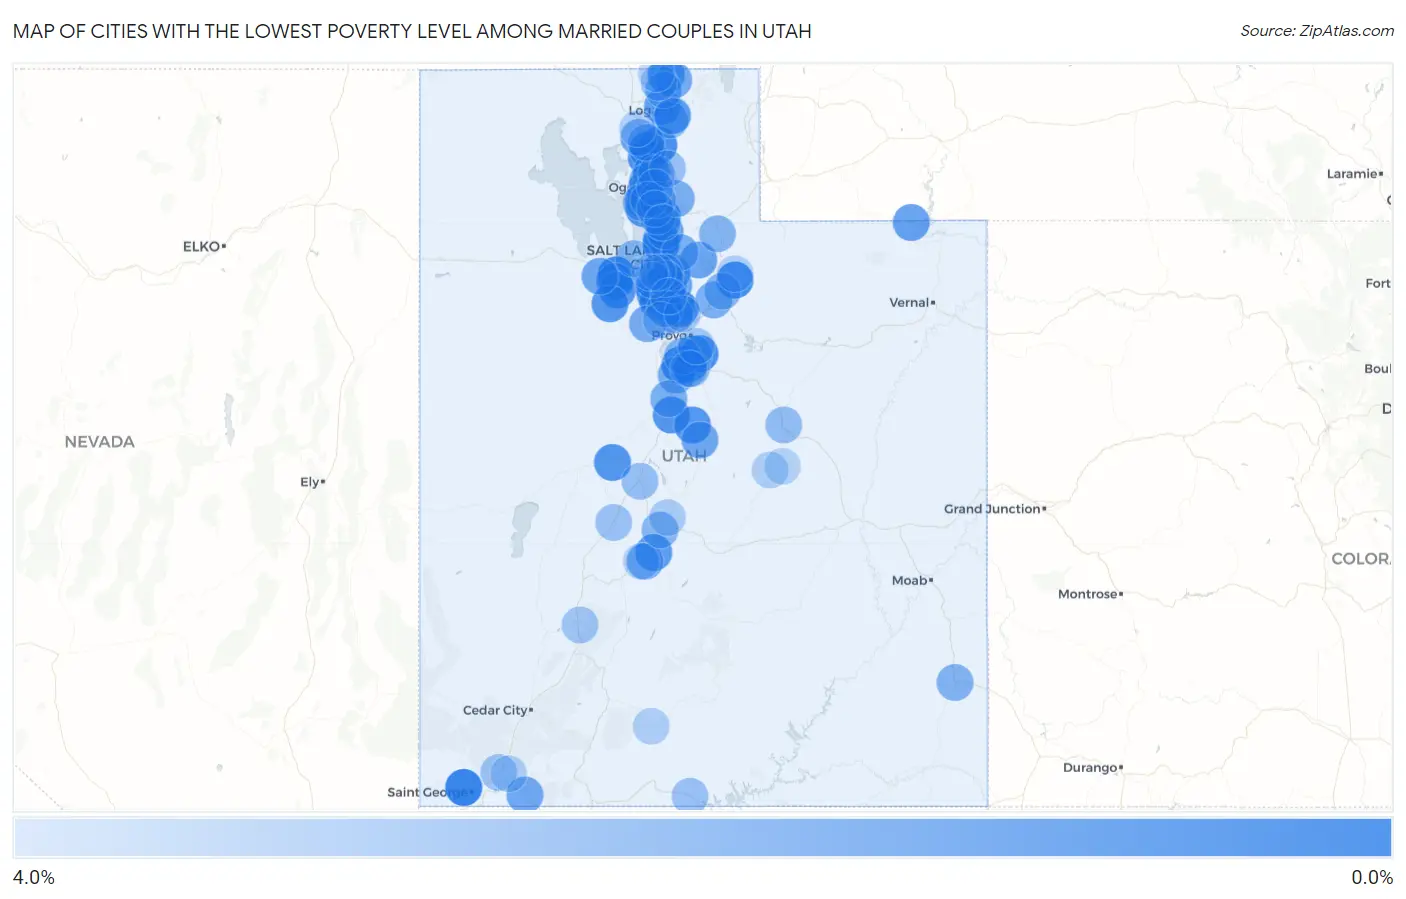
Map of Cities with the Lowest Poverty Level Among Married Couples in Utah
4.0%
0.0%
Cities with the Lowest Poverty Level Among Married Couples in Utah
| City | Married Couples Poverty | vs State | vs National | |
| 1. | Santa Clara | 0.31% | 3.8%(-3.44)#1 | 4.5%(-4.15)#77 |
| 2. | North Salt Lake | 0.33% | 3.8%(-3.43)#2 | 4.5%(-4.14)#81 |
| 3. | Stansbury Park | 0.57% | 3.8%(-3.18)#3 | 4.5%(-3.89)#344 |
| 4. | Francis | 0.64% | 3.8%(-3.11)#4 | 4.5%(-3.82)#433 |
| 5. | Payson | 0.69% | 3.8%(-3.06)#5 | 4.5%(-3.77)#513 |
| 6. | Mapleton | 0.76% | 3.8%(-3.00)#6 | 4.5%(-3.71)#637 |
| 7. | Mantua | 0.77% | 3.8%(-2.99)#7 | 4.5%(-3.70)#661 |
| 8. | West Haven | 0.78% | 3.8%(-2.97)#8 | 4.5%(-3.68)#705 |
| 9. | Riverton | 0.80% | 3.8%(-2.96)#9 | 4.5%(-3.67)#746 |
| 10. | Fruit Heights | 0.96% | 3.8%(-2.80)#10 | 4.5%(-3.51)#1,096 |
| 11. | Erda | 0.99% | 3.8%(-2.76)#11 | 4.5%(-3.47)#1,180 |
| 12. | Oak City | 0.99% | 3.8%(-2.76)#12 | 4.5%(-3.47)#1,186 |
| 13. | Highland | 1.0% | 3.8%(-2.75)#13 | 4.5%(-3.45)#1,223 |
| 14. | Willard | 1.0% | 3.8%(-2.73)#14 | 4.5%(-3.44)#1,265 |
| 15. | Tooele | 1.0% | 3.8%(-2.71)#15 | 4.5%(-3.42)#1,300 |
| 16. | Nephi | 1.1% | 3.8%(-2.69)#16 | 4.5%(-3.40)#1,337 |
| 17. | Fountain Green | 1.1% | 3.8%(-2.69)#17 | 4.5%(-3.40)#1,351 |
| 18. | South Jordan | 1.1% | 3.8%(-2.62)#18 | 4.5%(-3.33)#1,504 |
| 19. | Syracuse | 1.1% | 3.8%(-2.61)#19 | 4.5%(-3.32)#1,526 |
| 20. | Cedar Hills | 1.1% | 3.8%(-2.61)#20 | 4.5%(-3.32)#1,534 |
| 21. | Stockton | 1.1% | 3.8%(-2.61)#21 | 4.5%(-3.32)#1,536 |
| 22. | Perry | 1.2% | 3.8%(-2.58)#22 | 4.5%(-3.29)#1,615 |
| 23. | Glenwood | 1.3% | 3.8%(-2.50)#23 | 4.5%(-3.21)#1,790 |
| 24. | Pleasant View | 1.3% | 3.8%(-2.49)#24 | 4.5%(-3.20)#1,807 |
| 25. | Lewiston | 1.3% | 3.8%(-2.45)#25 | 4.5%(-3.16)#1,952 |
| 26. | Bluffdale | 1.3% | 3.8%(-2.43)#26 | 4.5%(-3.14)#1,998 |
| 27. | Woods Cross | 1.4% | 3.8%(-2.36)#27 | 4.5%(-3.07)#2,188 |
| 28. | Benson | 1.4% | 3.8%(-2.35)#28 | 4.5%(-3.06)#2,213 |
| 29. | Manila | 1.4% | 3.8%(-2.32)#29 | 4.5%(-3.03)#2,288 |
| 30. | Centerville | 1.5% | 3.8%(-2.25)#30 | 4.5%(-2.96)#2,471 |
| 31. | Roy | 1.5% | 3.8%(-2.23)#31 | 4.5%(-2.94)#2,544 |
| 32. | Granite | 1.5% | 3.8%(-2.21)#32 | 4.5%(-2.92)#2,576 |
| 33. | Salem | 1.6% | 3.8%(-2.17)#33 | 4.5%(-2.88)#2,697 |
| 34. | Summit Park | 1.6% | 3.8%(-2.14)#34 | 4.5%(-2.85)#2,774 |
| 35. | Grantsville | 1.6% | 3.8%(-2.11)#35 | 4.5%(-2.82)#2,885 |
| 36. | Kaysville | 1.7% | 3.8%(-2.06)#36 | 4.5%(-2.77)#3,009 |
| 37. | Clinton | 1.7% | 3.8%(-2.00)#37 | 4.5%(-2.71)#3,132 |
| 38. | Moroni | 1.7% | 3.8%(-2.00)#38 | 4.5%(-2.71)#3,137 |
| 39. | Apple Valley | 1.8% | 3.8%(-1.97)#39 | 4.5%(-2.68)#3,212 |
| 40. | Sandy | 1.9% | 3.8%(-1.90)#40 | 4.5%(-2.61)#3,416 |
| 41. | Holladay | 1.9% | 3.8%(-1.85)#41 | 4.5%(-2.56)#3,517 |
| 42. | Richmond | 1.9% | 3.8%(-1.85)#42 | 4.5%(-2.56)#3,519 |
| 43. | Eagle Mountain | 2.0% | 3.8%(-1.80)#43 | 4.5%(-2.51)#3,628 |
| 44. | Annabella | 2.0% | 3.8%(-1.79)#44 | 4.5%(-2.50)#3,657 |
| 45. | Mountain Green | 2.0% | 3.8%(-1.77)#45 | 4.5%(-2.48)#3,709 |
| 46. | Santaquin | 2.0% | 3.8%(-1.77)#46 | 4.5%(-2.48)#3,727 |
| 47. | Corinne | 2.1% | 3.8%(-1.70)#47 | 4.5%(-2.41)#3,891 |
| 48. | Charleston | 2.1% | 3.8%(-1.69)#48 | 4.5%(-2.40)#3,907 |
| 49. | Emigration Canyon | 2.1% | 3.8%(-1.68)#49 | 4.5%(-2.39)#3,922 |
| 50. | Mona | 2.1% | 3.8%(-1.68)#50 | 4.5%(-2.39)#3,941 |
| 51. | Marriott Slaterville | 2.1% | 3.8%(-1.62)#51 | 4.5%(-2.33)#4,098 |
| 52. | West Point | 2.1% | 3.8%(-1.61)#52 | 4.5%(-2.32)#4,151 |
| 53. | North Ogden | 2.2% | 3.8%(-1.59)#53 | 4.5%(-2.30)#4,199 |
| 54. | Monticello | 2.2% | 3.8%(-1.52)#54 | 4.5%(-2.23)#4,387 |
| 55. | Providence | 2.3% | 3.8%(-1.49)#55 | 4.5%(-2.20)#4,445 |
| 56. | Murray | 2.3% | 3.8%(-1.47)#56 | 4.5%(-2.18)#4,510 |
| 57. | American Fork | 2.3% | 3.8%(-1.43)#57 | 4.5%(-2.14)#4,619 |
| 58. | Coalville | 2.3% | 3.8%(-1.42)#58 | 4.5%(-2.13)#4,634 |
| 59. | Spanish Fork | 2.3% | 3.8%(-1.42)#59 | 4.5%(-2.13)#4,641 |
| 60. | Heber | 2.4% | 3.8%(-1.39)#60 | 4.5%(-2.10)#4,699 |
| 61. | South Weber | 2.4% | 3.8%(-1.38)#61 | 4.5%(-2.09)#4,728 |
| 62. | Aurora | 2.4% | 3.8%(-1.36)#62 | 4.5%(-2.07)#4,800 |
| 63. | Magna | 2.4% | 3.8%(-1.31)#63 | 4.5%(-2.02)#4,943 |
| 64. | Lehi | 2.4% | 3.8%(-1.31)#64 | 4.5%(-2.02)#4,952 |
| 65. | Nibley | 2.5% | 3.8%(-1.28)#65 | 4.5%(-1.99)#5,011 |
| 66. | Amalga | 2.5% | 3.8%(-1.27)#66 | 4.5%(-1.98)#5,019 |
| 67. | Benjamin | 2.5% | 3.8%(-1.26)#67 | 4.5%(-1.97)#5,030 |
| 68. | Brigham City | 2.5% | 3.8%(-1.23)#68 | 4.5%(-1.94)#5,139 |
| 69. | Woodland Hills | 2.6% | 3.8%(-1.18)#69 | 4.5%(-1.89)#5,268 |
| 70. | Carbonville | 2.6% | 3.8%(-1.12)#70 | 4.5%(-1.83)#5,401 |
| 71. | Elk Ridge | 2.6% | 3.8%(-1.11)#71 | 4.5%(-1.82)#5,430 |
| 72. | Midvale | 2.7% | 3.8%(-1.06)#72 | 4.5%(-1.77)#5,534 |
| 73. | West Jordan | 2.7% | 3.8%(-1.01)#73 | 4.5%(-1.72)#5,653 |
| 74. | Scipio | 2.8% | 3.8%(-0.974)#74 | 4.5%(-1.68)#5,760 |
| 75. | Sunset | 2.8% | 3.8%(-0.937)#75 | 4.5%(-1.65)#5,835 |
| 76. | Liberty | 2.8% | 3.8%(-0.925)#76 | 4.5%(-1.64)#5,863 |
| 77. | Fillmore | 2.9% | 3.8%(-0.901)#77 | 4.5%(-1.61)#5,907 |
| 78. | Big Water | 2.9% | 3.8%(-0.867)#78 | 4.5%(-1.58)#5,997 |
| 79. | Leeds | 2.9% | 3.8%(-0.845)#79 | 4.5%(-1.55)#6,041 |
| 80. | Ogden | 2.9% | 3.8%(-0.821)#80 | 4.5%(-1.53)#6,093 |
| 81. | Millville | 2.9% | 3.8%(-0.817)#81 | 4.5%(-1.53)#6,105 |
| 82. | Beaver | 3.0% | 3.8%(-0.795)#82 | 4.5%(-1.51)#6,169 |
| 83. | Springville | 3.0% | 3.8%(-0.743)#83 | 4.5%(-1.45)#6,291 |
| 84. | Layton | 3.0% | 3.8%(-0.719)#84 | 4.5%(-1.43)#6,357 |
| 85. | Saratoga Springs | 3.1% | 3.8%(-0.699)#85 | 4.5%(-1.41)#6,384 |
| 86. | Trenton | 3.1% | 3.8%(-0.699)#86 | 4.5%(-1.41)#6,391 |
| 87. | Pleasant Grove | 3.1% | 3.8%(-0.639)#87 | 4.5%(-1.35)#6,520 |
| 88. | Taylorsville | 3.2% | 3.8%(-0.584)#88 | 4.5%(-1.29)#6,650 |
| 89. | Redmond | 3.3% | 3.8%(-0.455)#89 | 4.5%(-1.17)#6,942 |
| 90. | Henrieville | 3.3% | 3.8%(-0.419)#90 | 4.5%(-1.13)#7,025 |
| 91. | Huntington | 3.4% | 3.8%(-0.402)#91 | 4.5%(-1.11)#7,062 |
| 92. | La Verkin | 3.4% | 3.8%(-0.366)#92 | 4.5%(-1.08)#7,143 |
| 93. | Farmington | 3.4% | 3.8%(-0.358)#93 | 4.5%(-1.07)#7,161 |
| 94. | Kamas | 3.4% | 3.8%(-0.349)#94 | 4.5%(-1.06)#7,173 |
| 95. | Kearns | 3.4% | 3.8%(-0.328)#95 | 4.5%(-1.04)#7,213 |
| 96. | Central Valley | 3.5% | 3.8%(-0.280)#96 | 4.5%(-0.990)#7,334 |
| 97. | Draper | 3.5% | 3.8%(-0.272)#97 | 4.5%(-0.982)#7,355 |
| 98. | Bear River City | 3.5% | 3.8%(-0.269)#98 | 4.5%(-0.979)#7,360 |
| 99. | Cleveland | 3.5% | 3.8%(-0.256)#99 | 4.5%(-0.965)#7,388 |
| 100. | Cornish | 3.6% | 3.8%(-0.181)#100 | 4.5%(-0.890)#7,575 |
Common Questions
What are the Top 10 Cities with the Lowest Poverty Level Among Married Couples in Utah?
Top 10 Cities with the Lowest Poverty Level Among Married Couples in Utah are:
#1
0.31%
#2
0.33%
#3
0.57%
#4
0.64%
#5
0.69%
#6
0.76%
#7
0.77%
#8
0.78%
#9
0.80%
#10
0.96%
What city has the Lowest Poverty Level Among Married Couples in Utah?
Santa Clara has the Lowest Poverty Level Among Married Couples in Utah with 0.31%.
What is the Poverty Level Among Married Couples in the State of Utah?
Poverty Level Among Married Couples in Utah is 3.8%.
What is the Poverty Level Among Married Couples in the United States?
Poverty Level Among Married Couples in the United States is 4.5%.