Las Flores CDP Orange County, CA Map & Demographics
Las Flores CDP Orange County Overview
$60,817
PER CAPITA INCOME
$197,500
AVG FAMILY INCOME
$138,750
AVG HOUSEHOLD INCOME
28.2%
WAGE / INCOME GAP [ % ]
71.8¢/ $1
WAGE / INCOME GAP [ $ ]
0.38
INEQUALITY / GINI INDEX
5,757
TOTAL POPULATION
2,935
MALE POPULATION
2,822
FEMALE POPULATION
104.00
MALES / 100 FEMALES
96.15
FEMALES / 100 MALES
31.6
MEDIAN AGE
3.2
AVG FAMILY SIZE
3.1
AVG HOUSEHOLD SIZE
3,373
LABOR FORCE [ PEOPLE ]
76.6%
PERCENT IN LABOR FORCE
3.4%
UNEMPLOYMENT RATE
Income in Las Flores CDP Orange County
Income Overview in Las Flores CDP Orange County
Per Capita Income in Las Flores CDP Orange County is $60,817, while median incomes of families and households are $197,500 and $138,750 respectively.
| Characteristic | Number | Measure |
| Per Capita Income | 5,757 | $60,817 |
| Median Family Income | 1,446 | $197,500 |
| Mean Family Income | 1,446 | $201,556 |
| Median Household Income | 1,870 | $138,750 |
| Mean Household Income | 1,870 | $183,442 |
| Income Deficit | 1,446 | $0 |
| Wage / Income Gap (%) | 5,757 | 28.24% |
| Wage / Income Gap ($) | 5,757 | 71.76¢ per $1 |
| Gini / Inequality Index | 5,757 | 0.38 |
Earnings by Sex in Las Flores CDP Orange County
Average Earnings in Las Flores CDP Orange County are $65,825, $81,736 for men and $58,650 for women, a difference of 28.2%.
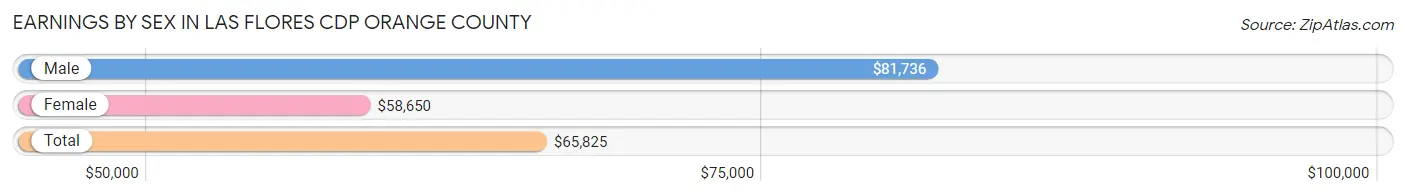
| Sex | Number | Average Earnings |
| Male | 1,807 (51.9%) | $81,736 |
| Female | 1,676 (48.1%) | $58,650 |
| Total | 3,483 (100.0%) | $65,825 |
Earnings by Sex by Income Bracket in Las Flores CDP Orange County
The most common earnings brackets in Las Flores CDP Orange County are $100,000+ for men (812 | 44.9%) and $100,000+ for women (344 | 20.5%).
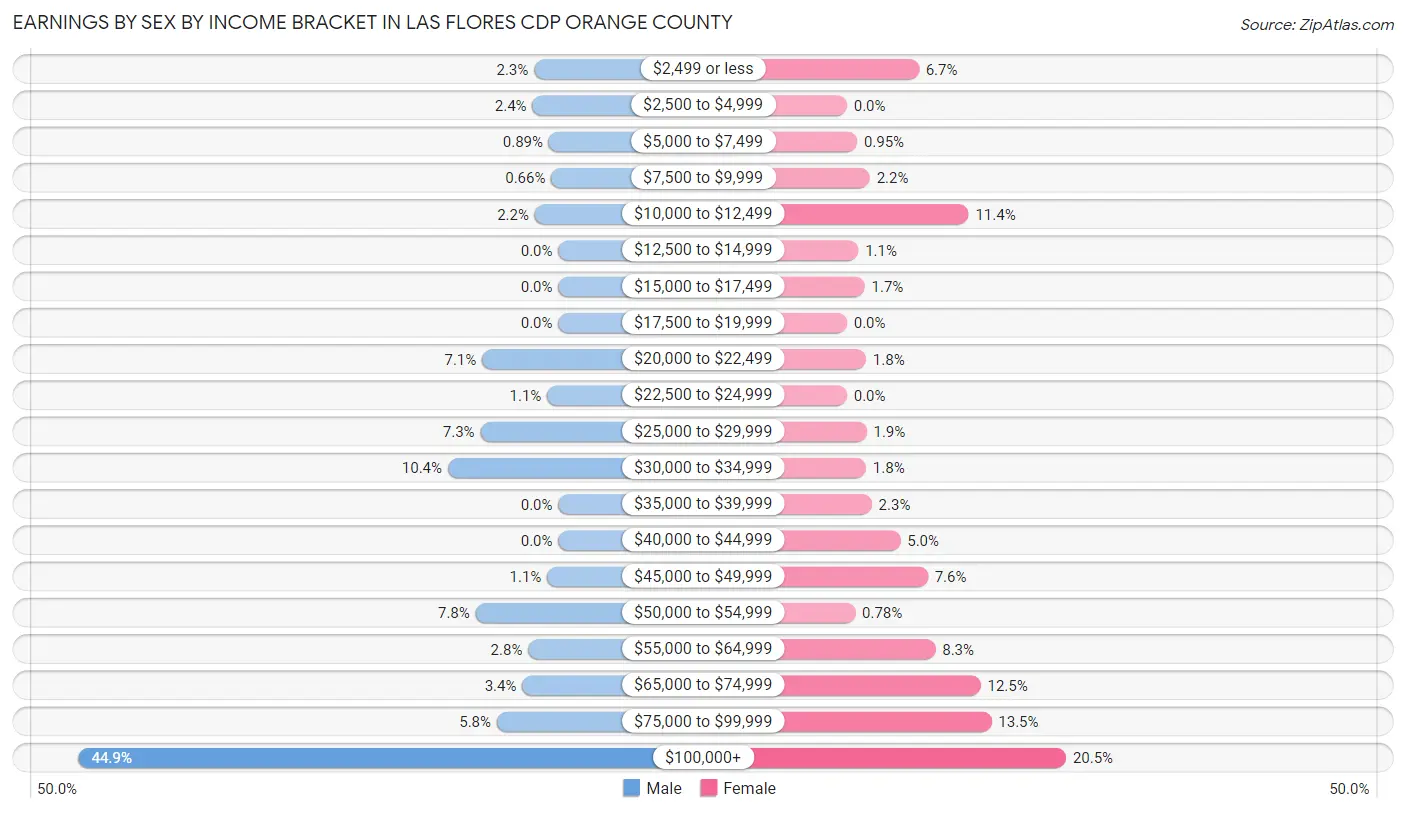
| Income | Male | Female |
| $2,499 or less | 41 (2.3%) | 113 (6.7%) |
| $2,500 to $4,999 | 44 (2.4%) | 0 (0.0%) |
| $5,000 to $7,499 | 16 (0.9%) | 16 (0.9%) |
| $7,500 to $9,999 | 12 (0.7%) | 36 (2.1%) |
| $10,000 to $12,499 | 40 (2.2%) | 191 (11.4%) |
| $12,500 to $14,999 | 0 (0.0%) | 18 (1.1%) |
| $15,000 to $17,499 | 0 (0.0%) | 28 (1.7%) |
| $17,500 to $19,999 | 0 (0.0%) | 0 (0.0%) |
| $20,000 to $22,499 | 129 (7.1%) | 30 (1.8%) |
| $22,500 to $24,999 | 19 (1.1%) | 0 (0.0%) |
| $25,000 to $29,999 | 132 (7.3%) | 31 (1.8%) |
| $30,000 to $34,999 | 187 (10.3%) | 30 (1.8%) |
| $35,000 to $39,999 | 0 (0.0%) | 39 (2.3%) |
| $40,000 to $44,999 | 0 (0.0%) | 84 (5.0%) |
| $45,000 to $49,999 | 19 (1.1%) | 127 (7.6%) |
| $50,000 to $54,999 | 140 (7.7%) | 13 (0.8%) |
| $55,000 to $64,999 | 51 (2.8%) | 139 (8.3%) |
| $65,000 to $74,999 | 61 (3.4%) | 210 (12.5%) |
| $75,000 to $99,999 | 104 (5.8%) | 227 (13.5%) |
| $100,000+ | 812 (44.9%) | 344 (20.5%) |
| Total | 1,807 (100.0%) | 1,676 (100.0%) |
Earnings by Sex by Educational Attainment in Las Flores CDP Orange County
Average earnings in Las Flores CDP Orange County are $88,276 for men and $68,317 for women, a difference of 22.6%. Men with an educational attainment of bachelor's degree enjoy the highest average annual earnings of $172,188, while those with high school diploma education earn the least with $22,006. Women with an educational attainment of graduate degree earn the most with the average annual earnings of $129,583, while those with college or associate's degree education have the smallest earnings of $47,212.
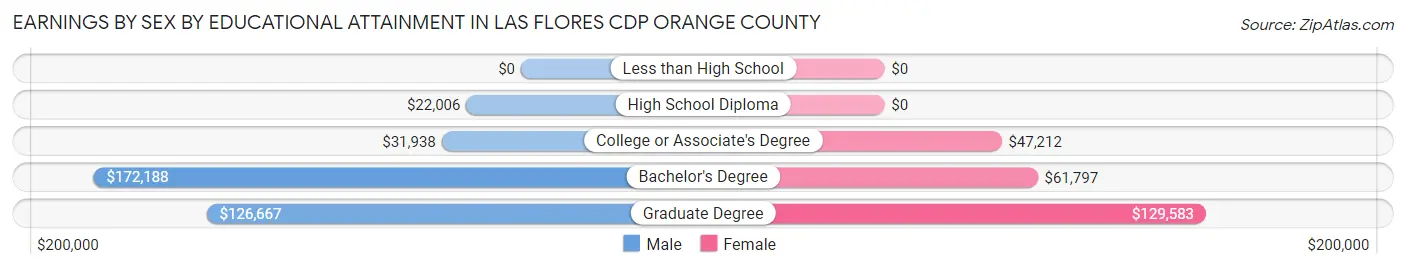
| Educational Attainment | Male Income | Female Income |
| Less than High School | - | - |
| High School Diploma | $22,006 | $0 |
| College or Associate's Degree | $31,938 | $47,212 |
| Bachelor's Degree | $172,188 | $61,797 |
| Graduate Degree | $126,667 | $129,583 |
| Total | $88,276 | $68,317 |
Family Income in Las Flores CDP Orange County
Family Income Brackets in Las Flores CDP Orange County
According to the Las Flores CDP Orange County family income data, there are 665 families falling into the $200,000+ income range, which is the most common income bracket and makes up 46.0% of all families.
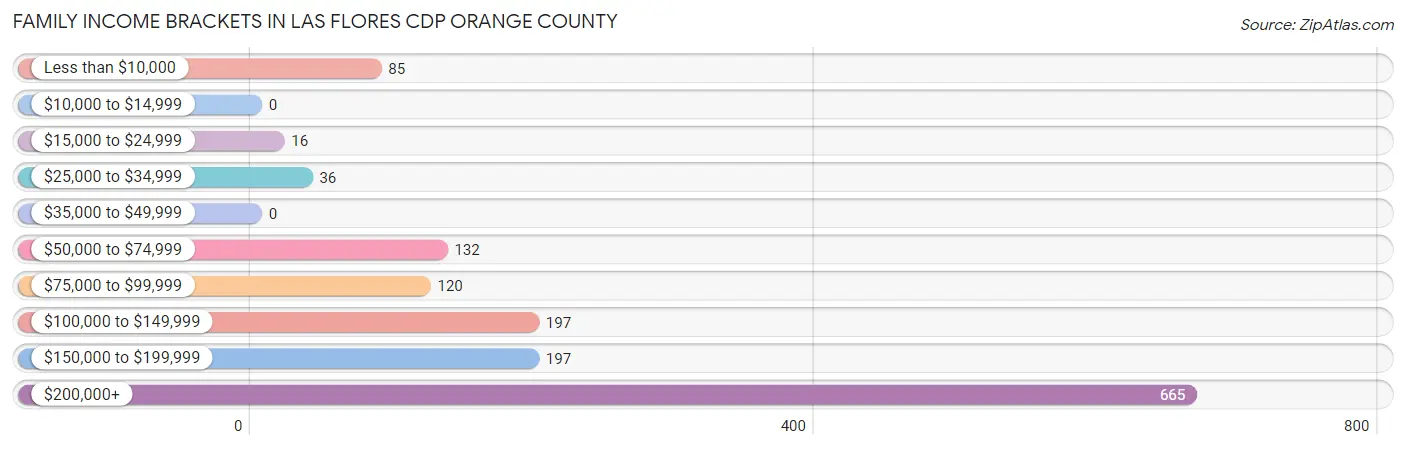
| Income Bracket | # Families | % Families |
| Less than $10,000 | 85 | 5.9% |
| $10,000 to $14,999 | 0 | 0.0% |
| $15,000 to $24,999 | 16 | 1.1% |
| $25,000 to $34,999 | 36 | 2.5% |
| $35,000 to $49,999 | 0 | 0.0% |
| $50,000 to $74,999 | 132 | 9.1% |
| $75,000 to $99,999 | 120 | 8.3% |
| $100,000 to $149,999 | 197 | 13.6% |
| $150,000 to $199,999 | 197 | 13.6% |
| $200,000+ | 665 | 46.0% |
Family Income by Famaliy Size in Las Flores CDP Orange County
5-person families (45 | 3.1%) account for the highest median family income in Las Flores CDP Orange County with $250,001 per family, while 2-person families (581 | 40.2%) have the highest median income of $106,094 per family member.
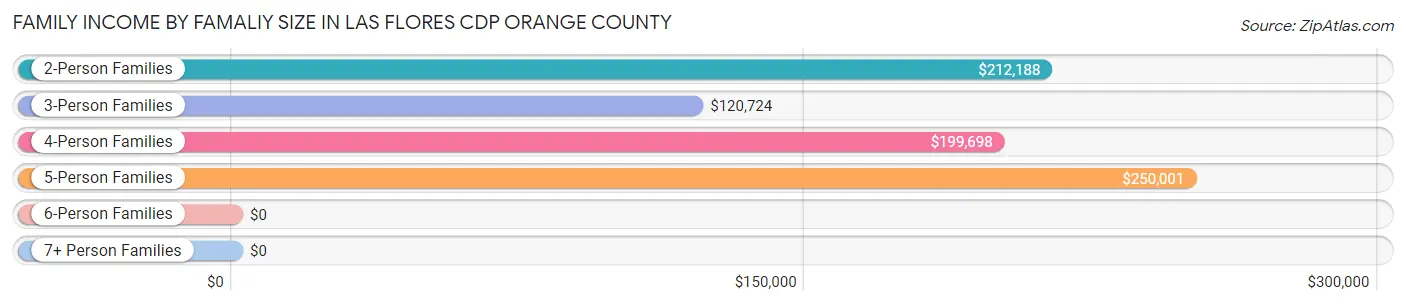
| Income Bracket | # Families | Median Income |
| 2-Person Families | 581 (40.2%) | $212,188 |
| 3-Person Families | 377 (26.1%) | $120,724 |
| 4-Person Families | 348 (24.1%) | $199,698 |
| 5-Person Families | 45 (3.1%) | $250,001 |
| 6-Person Families | 72 (5.0%) | $0 |
| 7+ Person Families | 23 (1.6%) | $0 |
| Total | 1,446 (100.0%) | $197,500 |
Family Income by Number of Earners in Las Flores CDP Orange County
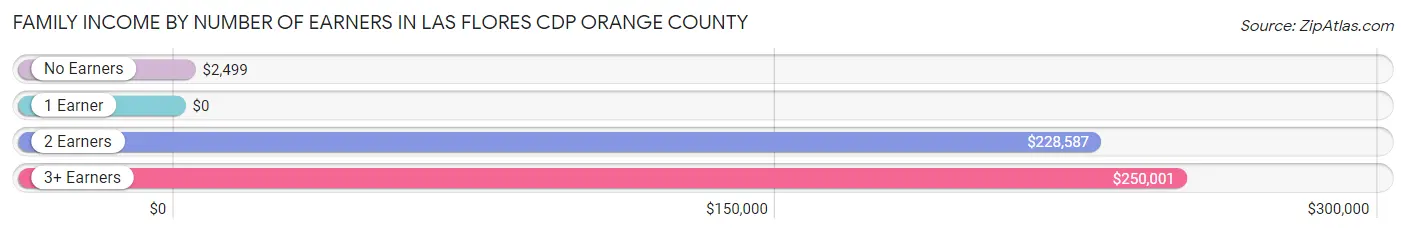
| Number of Earners | # Families | Median Income |
| No Earners | 80 (5.5%) | $2,499 |
| 1 Earner | 389 (26.9%) | $0 |
| 2 Earners | 874 (60.4%) | $228,587 |
| 3+ Earners | 103 (7.1%) | $250,001 |
| Total | 1,446 (100.0%) | $197,500 |
Household Income in Las Flores CDP Orange County
Household Income Brackets in Las Flores CDP Orange County
With 714 households falling in the category, the $200,000+ income range is the most frequent in Las Flores CDP Orange County, accounting for 38.2% of all households. In contrast, only 7 households (0.4%) fall into the $35,000 to $49,999 income bracket, making it the least populous group.
| Income Bracket | # Households | % Households |
| Less than $10,000 | 62 | 3.3% |
| $10,000 to $14,999 | 24 | 1.3% |
| $15,000 to $24,999 | 17 | 0.9% |
| $25,000 to $34,999 | 21 | 1.1% |
| $35,000 to $49,999 | 7 | 0.4% |
| $50,000 to $74,999 | 189 | 10.1% |
| $75,000 to $99,999 | 245 | 13.1% |
| $100,000 to $149,999 | 381 | 20.4% |
| $150,000 to $199,999 | 209 | 11.2% |
| $200,000+ | 714 | 38.2% |
Household Income by Householder Age in Las Flores CDP Orange County
The median household income in Las Flores CDP Orange County is $138,750, with the highest median household income of $166,917 found in the 25 to 44 years age bracket for the primary householder. A total of 790 households (42.2%) fall into this category. Meanwhile, the 15 to 24 years age bracket for the primary householder has the lowest median household income of $0, with 62 households (3.3%) in this group.
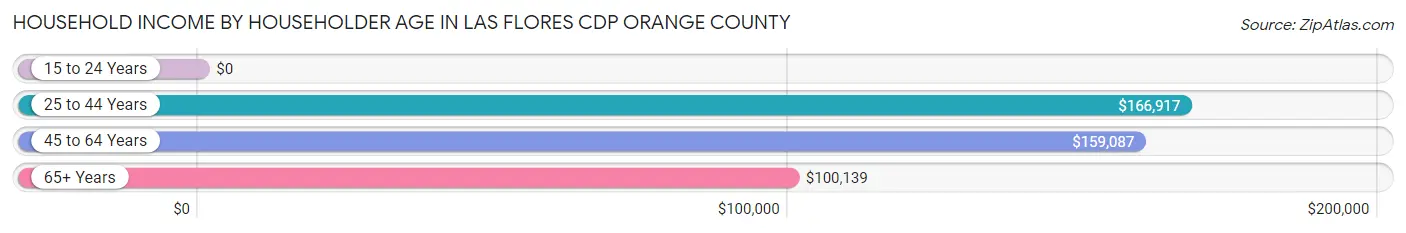
| Income Bracket | # Households | Median Income |
| 15 to 24 Years | 62 (3.3%) | $0 |
| 25 to 44 Years | 790 (42.2%) | $166,917 |
| 45 to 64 Years | 861 (46.0%) | $159,087 |
| 65+ Years | 157 (8.4%) | $100,139 |
| Total | 1,870 (100.0%) | $138,750 |
Poverty in Las Flores CDP Orange County
Income Below Poverty by Sex and Age in Las Flores CDP Orange County
With 5.3% poverty level for males and 14.2% for females among the residents of Las Flores CDP Orange County, 18 to 24 year old males and 6 to 11 year old females are the most vulnerable to poverty, with 52 males (34.2%) and 85 females (43.1%) in their respective age groups living below the poverty level.
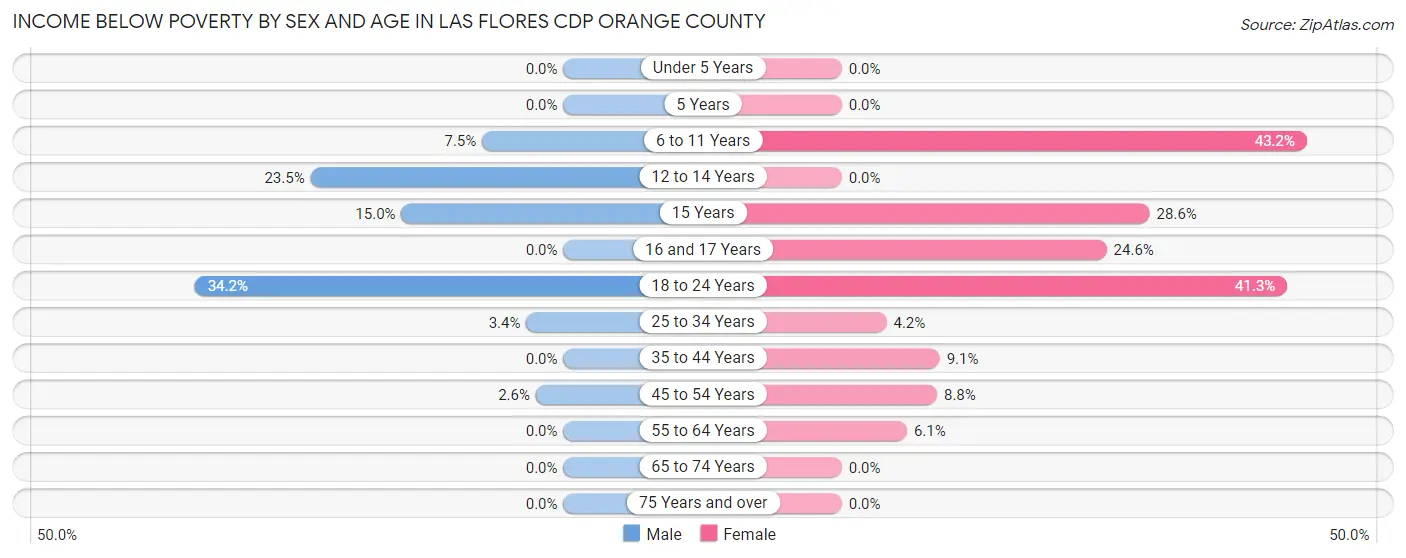
| Age Bracket | Male | Female |
| Under 5 Years | 0 (0.0%) | 0 (0.0%) |
| 5 Years | 0 (0.0%) | 0 (0.0%) |
| 6 to 11 Years | 23 (7.5%) | 85 (43.1%) |
| 12 to 14 Years | 23 (23.5%) | 0 (0.0%) |
| 15 Years | 23 (15.0%) | 12 (28.6%) |
| 16 and 17 Years | 0 (0.0%) | 29 (24.6%) |
| 18 to 24 Years | 52 (34.2%) | 162 (41.3%) |
| 25 to 34 Years | 18 (3.4%) | 19 (4.2%) |
| 35 to 44 Years | 0 (0.0%) | 31 (9.1%) |
| 45 to 54 Years | 16 (2.6%) | 39 (8.8%) |
| 55 to 64 Years | 0 (0.0%) | 24 (6.0%) |
| 65 to 74 Years | 0 (0.0%) | 0 (0.0%) |
| 75 Years and over | 0 (0.0%) | 0 (0.0%) |
| Total | 155 (5.3%) | 401 (14.2%) |
Income Above Poverty by Sex and Age in Las Flores CDP Orange County
According to the poverty statistics in Las Flores CDP Orange County, males aged under 5 years and females aged under 5 years are the age groups that are most secure financially, with 100.0% of males and 100.0% of females in these age groups living above the poverty line.
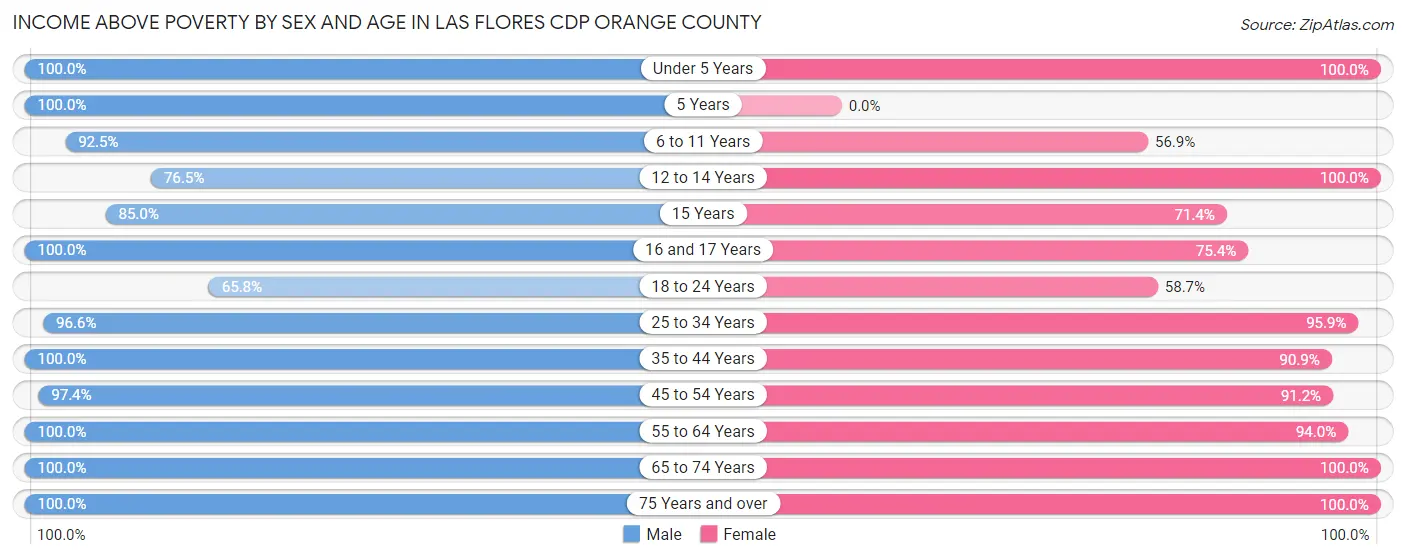
| Age Bracket | Male | Female |
| Under 5 Years | 189 (100.0%) | 125 (100.0%) |
| 5 Years | 77 (100.0%) | 0 (0.0%) |
| 6 to 11 Years | 282 (92.5%) | 112 (56.9%) |
| 12 to 14 Years | 75 (76.5%) | 167 (100.0%) |
| 15 Years | 130 (85.0%) | 30 (71.4%) |
| 16 and 17 Years | 161 (100.0%) | 89 (75.4%) |
| 18 to 24 Years | 100 (65.8%) | 230 (58.7%) |
| 25 to 34 Years | 506 (96.6%) | 439 (95.9%) |
| 35 to 44 Years | 366 (100.0%) | 310 (90.9%) |
| 45 to 54 Years | 609 (97.4%) | 402 (91.2%) |
| 55 to 64 Years | 171 (100.0%) | 373 (94.0%) |
| 65 to 74 Years | 94 (100.0%) | 115 (100.0%) |
| 75 Years and over | 20 (100.0%) | 29 (100.0%) |
| Total | 2,780 (94.7%) | 2,421 (85.8%) |
Income Below Poverty Among Married-Couple Families in Las Flores CDP Orange County
The poverty statistics for married-couple families in Las Flores CDP Orange County show that 1.4% or 16 of the total 1,120 families live below the poverty line. Families with no children have the highest poverty rate of 3.5%, comprising of 16 families. On the other hand, families with 1 or 2 children have the lowest poverty rate of 0.0%, which includes 0 families.
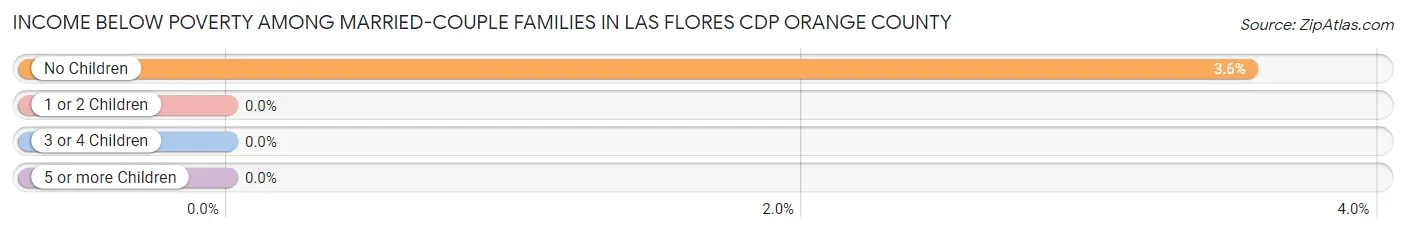
| Children | Above Poverty | Below Poverty |
| No Children | 435 (96.5%) | 16 (3.5%) |
| 1 or 2 Children | 574 (100.0%) | 0 (0.0%) |
| 3 or 4 Children | 95 (100.0%) | 0 (0.0%) |
| 5 or more Children | 0 (0.0%) | 0 (0.0%) |
| Total | 1,104 (98.6%) | 16 (1.4%) |
Income Below Poverty Among Single-Parent Households in Las Flores CDP Orange County
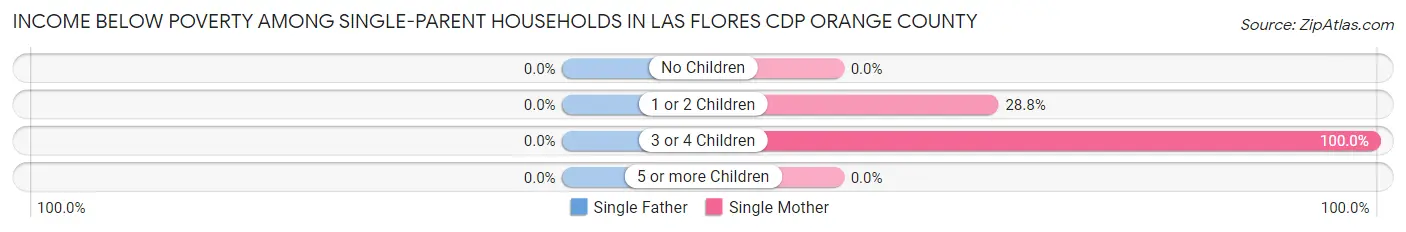
| Children | Single Father | Single Mother |
| No Children | 0 (0.0%) | 0 (0.0%) |
| 1 or 2 Children | 0 (0.0%) | 62 (28.8%) |
| 3 or 4 Children | 0 (0.0%) | 23 (100.0%) |
| 5 or more Children | 0 (0.0%) | 0 (0.0%) |
| Total | 0 (0.0%) | 85 (26.1%) |
Income Below Poverty Among Married-Couple vs Single-Parent Households in Las Flores CDP Orange County
The poverty data for Las Flores CDP Orange County shows that 16 of the married-couple family households (1.4%) and 85 of the single-parent households (26.1%) are living below the poverty level. Within the married-couple family households, those with no children have the highest poverty rate, with 16 households (3.5%) falling below the poverty line. Among the single-parent households, those with 3 or 4 children have the highest poverty rate, with 23 household (100.0%) living below poverty.
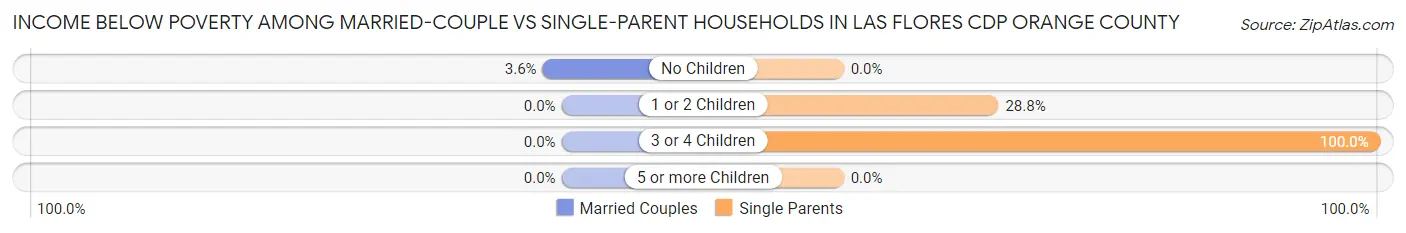
| Children | Married-Couple Families | Single-Parent Households |
| No Children | 16 (3.5%) | 0 (0.0%) |
| 1 or 2 Children | 0 (0.0%) | 62 (28.8%) |
| 3 or 4 Children | 0 (0.0%) | 23 (100.0%) |
| 5 or more Children | 0 (0.0%) | 0 (0.0%) |
| Total | 16 (1.4%) | 85 (26.1%) |
Race in Las Flores CDP Orange County
The most populous races in Las Flores CDP Orange County are White / Caucasian (4,454 | 77.4%), Hispanic or Latino (933 | 16.2%), and Two or more Races (602 | 10.5%).
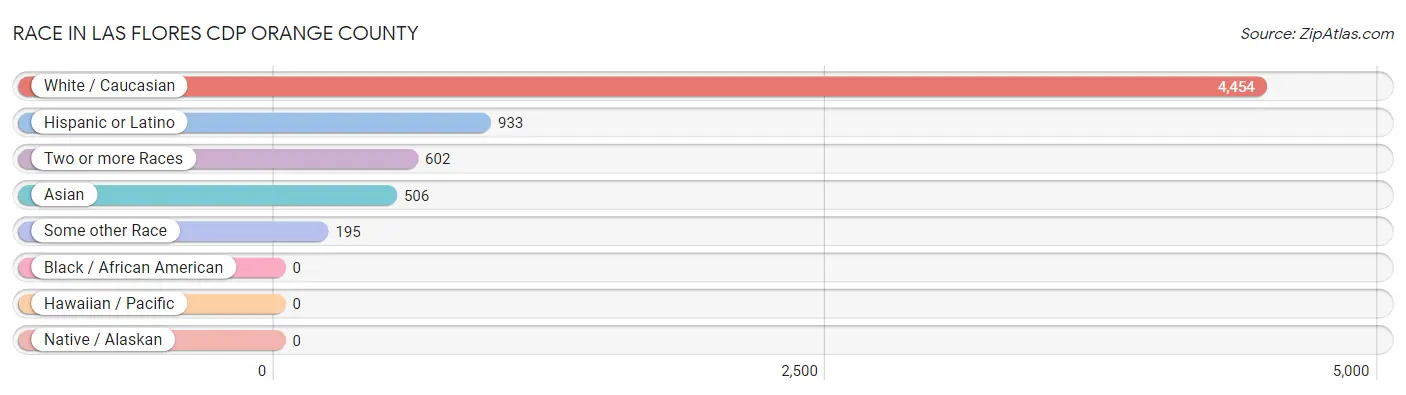
| Race | # Population | % Population |
| Asian | 506 | 8.8% |
| Black / African American | 0 | 0.0% |
| Hawaiian / Pacific | 0 | 0.0% |
| Hispanic or Latino | 933 | 16.2% |
| Native / Alaskan | 0 | 0.0% |
| White / Caucasian | 4,454 | 77.4% |
| Two or more Races | 602 | 10.5% |
| Some other Race | 195 | 3.4% |
| Total | 5,757 | 100.0% |
Ancestry in Las Flores CDP Orange County
The most populous ancestries reported in Las Flores CDP Orange County are German (629 | 10.9%), English (627 | 10.9%), Mexican (614 | 10.7%), Irish (509 | 8.8%), and American (412 | 7.2%), together accounting for 48.5% of all Las Flores CDP Orange County residents.
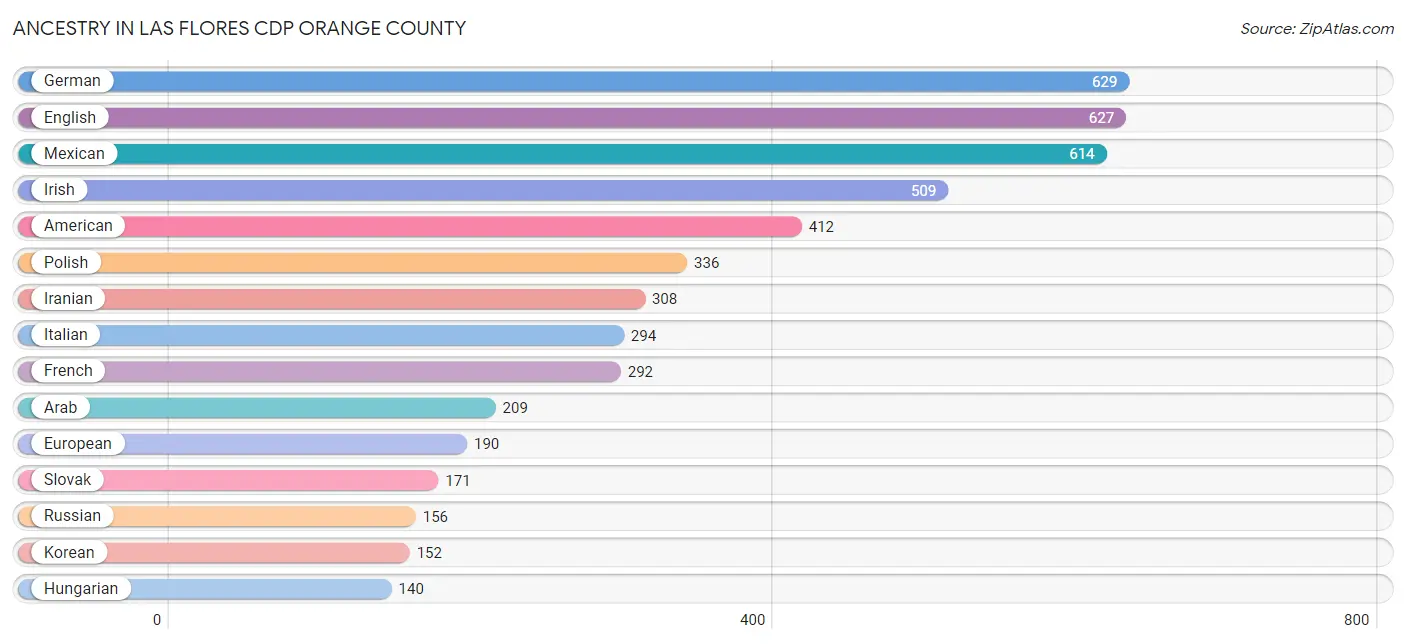
| Ancestry | # Population | % Population |
| American | 412 | 7.2% |
| Arab | 209 | 3.6% |
| Armenian | 43 | 0.7% |
| Austrian | 11 | 0.2% |
| Bhutanese | 71 | 1.2% |
| British | 75 | 1.3% |
| Burmese | 61 | 1.1% |
| Central American | 55 | 1.0% |
| Cherokee | 14 | 0.2% |
| Cuban | 31 | 0.5% |
| Dutch | 39 | 0.7% |
| Egyptian | 88 | 1.5% |
| English | 627 | 10.9% |
| European | 190 | 3.3% |
| Finnish | 46 | 0.8% |
| French | 292 | 5.1% |
| French Canadian | 13 | 0.2% |
| German | 629 | 10.9% |
| Guatemalan | 55 | 1.0% |
| Hungarian | 140 | 2.4% |
| Indian (Asian) | 137 | 2.4% |
| Iranian | 308 | 5.3% |
| Irish | 509 | 8.8% |
| Italian | 294 | 5.1% |
| Japanese | 72 | 1.3% |
| Korean | 152 | 2.6% |
| Laotian | 10 | 0.2% |
| Malaysian | 74 | 1.3% |
| Mexican | 614 | 10.7% |
| Northern European | 23 | 0.4% |
| Norwegian | 11 | 0.2% |
| Polish | 336 | 5.8% |
| Portuguese | 13 | 0.2% |
| Puerto Rican | 38 | 0.7% |
| Russian | 156 | 2.7% |
| Scotch-Irish | 47 | 0.8% |
| Scottish | 52 | 0.9% |
| Serbian | 57 | 1.0% |
| Slovak | 171 | 3.0% |
| Sri Lankan | 21 | 0.4% |
| Swedish | 47 | 0.8% |
| Swiss | 101 | 1.8% |
| Thai | 85 | 1.5% |
| Ukrainian | 75 | 1.3% |
| Welsh | 12 | 0.2% | View All 45 Rows |
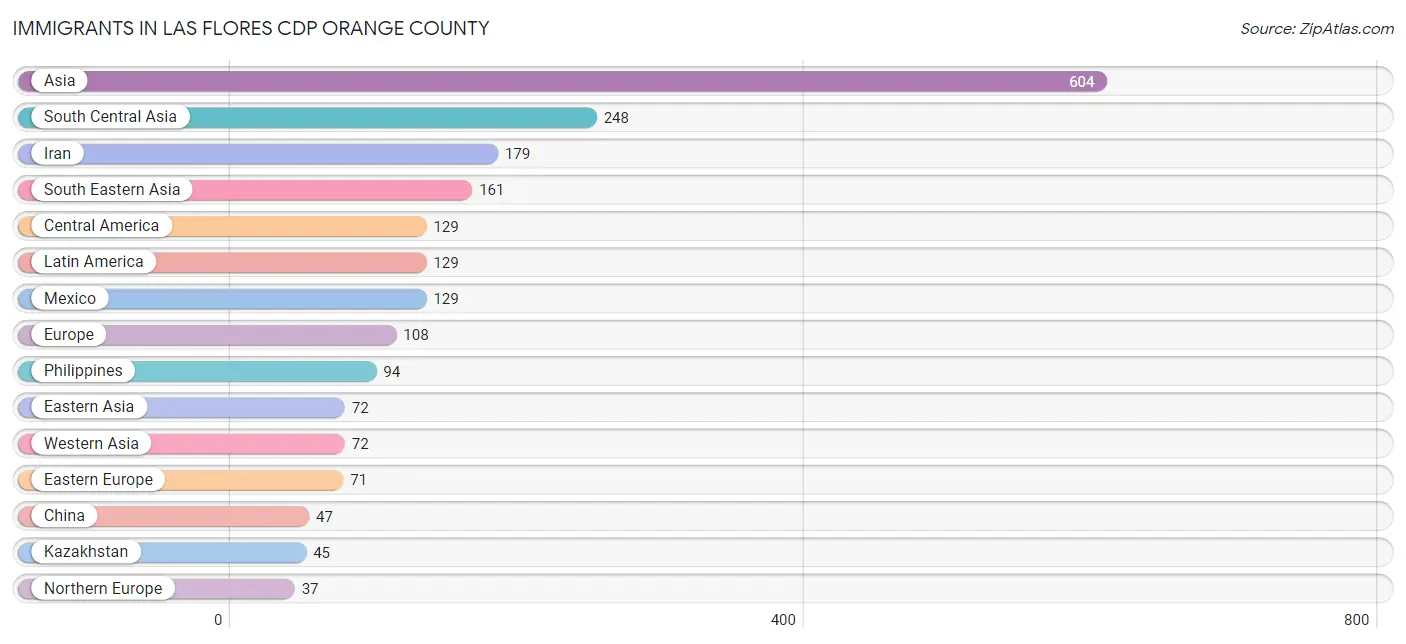
Immigrants in Las Flores CDP Orange County
The most numerous immigrant groups reported in Las Flores CDP Orange County came from Asia (604 | 10.5%), South Central Asia (248 | 4.3%), Iran (179 | 3.1%), South Eastern Asia (161 | 2.8%), and Central America (129 | 2.2%), together accounting for 22.9% of all Las Flores CDP Orange County residents.
| Immigration Origin | # Population | % Population |
| Africa | 16 | 0.3% |
| Asia | 604 | 10.5% |
| Cambodia | 24 | 0.4% |
| Central America | 129 | 2.2% |
| China | 47 | 0.8% |
| Eastern Asia | 72 | 1.3% |
| Eastern Europe | 71 | 1.2% |
| Egypt | 16 | 0.3% |
| Europe | 108 | 1.9% |
| India | 24 | 0.4% |
| Indonesia | 10 | 0.2% |
| Iran | 179 | 3.1% |
| Japan | 6 | 0.1% |
| Kazakhstan | 45 | 0.8% |
| Korea | 19 | 0.3% |
| Laos | 26 | 0.4% |
| Latin America | 129 | 2.2% |
| Mexico | 129 | 2.2% |
| Northern Africa | 16 | 0.3% |
| Northern Europe | 37 | 0.6% |
| Philippines | 94 | 1.6% |
| Russia | 14 | 0.2% |
| Saudi Arabia | 20 | 0.4% |
| Serbia | 16 | 0.3% |
| South Central Asia | 248 | 4.3% |
| South Eastern Asia | 161 | 2.8% |
| Vietnam | 7 | 0.1% |
| Western Asia | 72 | 1.3% | View All 28 Rows |
Sex and Age in Las Flores CDP Orange County
Sex and Age in Las Flores CDP Orange County
The most populous age groups in Las Flores CDP Orange County are 50 to 54 Years (465 | 15.8%) for men and 25 to 29 Years (344 | 12.2%) for women.
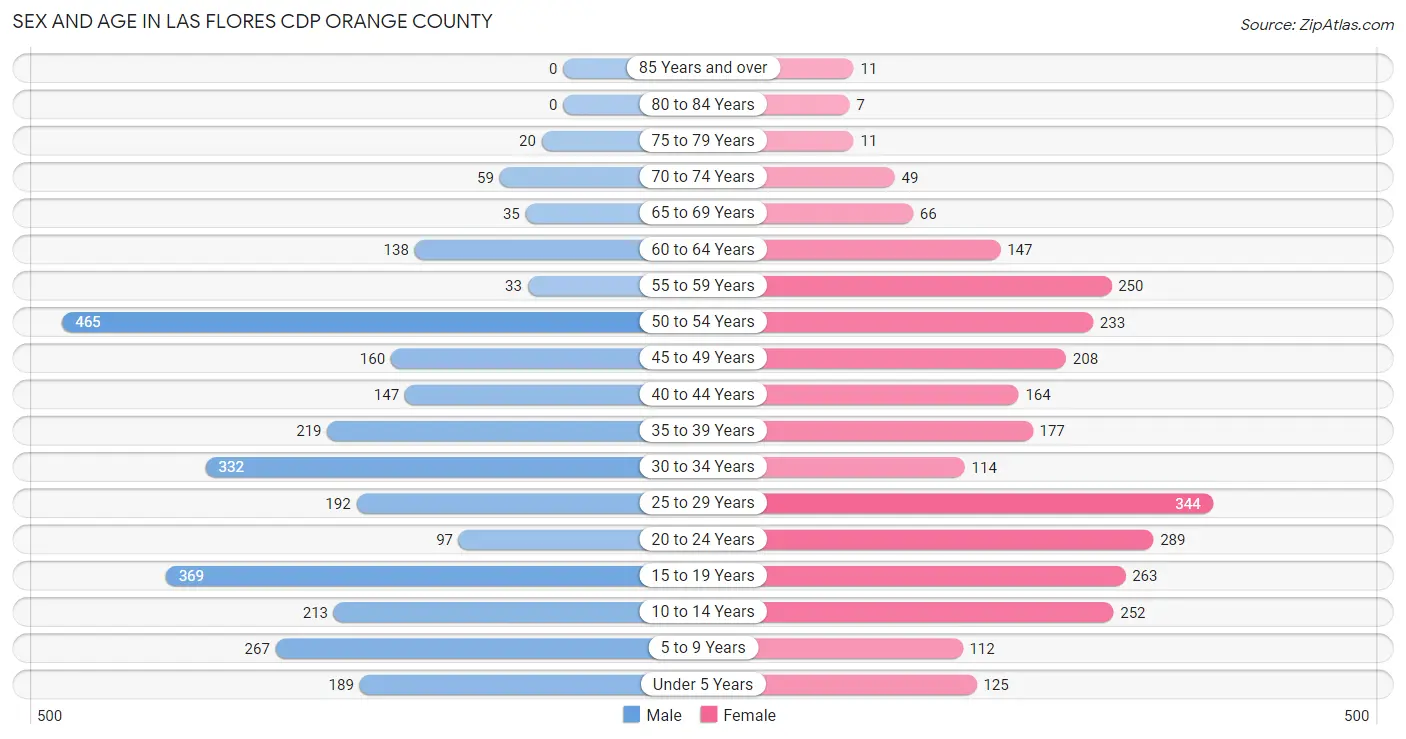
| Age Bracket | Male | Female |
| Under 5 Years | 189 (6.4%) | 125 (4.4%) |
| 5 to 9 Years | 267 (9.1%) | 112 (4.0%) |
| 10 to 14 Years | 213 (7.3%) | 252 (8.9%) |
| 15 to 19 Years | 369 (12.6%) | 263 (9.3%) |
| 20 to 24 Years | 97 (3.3%) | 289 (10.2%) |
| 25 to 29 Years | 192 (6.5%) | 344 (12.2%) |
| 30 to 34 Years | 332 (11.3%) | 114 (4.0%) |
| 35 to 39 Years | 219 (7.5%) | 177 (6.3%) |
| 40 to 44 Years | 147 (5.0%) | 164 (5.8%) |
| 45 to 49 Years | 160 (5.4%) | 208 (7.4%) |
| 50 to 54 Years | 465 (15.8%) | 233 (8.3%) |
| 55 to 59 Years | 33 (1.1%) | 250 (8.9%) |
| 60 to 64 Years | 138 (4.7%) | 147 (5.2%) |
| 65 to 69 Years | 35 (1.2%) | 66 (2.3%) |
| 70 to 74 Years | 59 (2.0%) | 49 (1.7%) |
| 75 to 79 Years | 20 (0.7%) | 11 (0.4%) |
| 80 to 84 Years | 0 (0.0%) | 7 (0.3%) |
| 85 Years and over | 0 (0.0%) | 11 (0.4%) |
| Total | 2,935 (100.0%) | 2,822 (100.0%) |
Families and Households in Las Flores CDP Orange County
Median Family Size in Las Flores CDP Orange County
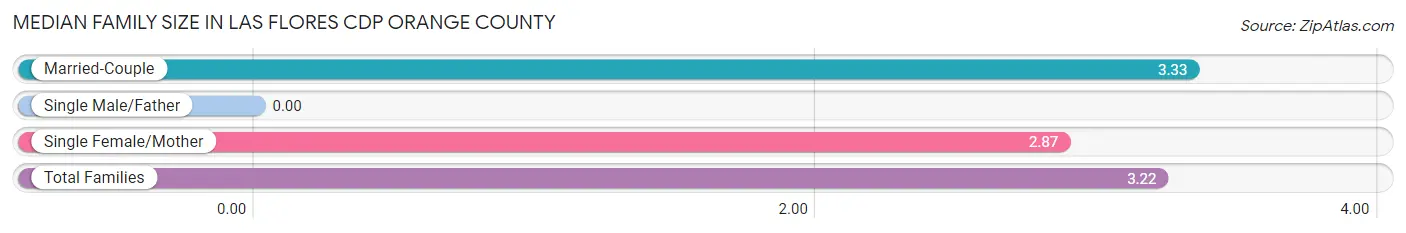
| Family Type | # Families | Family Size |
| Married-Couple | 1,120 (77.5%) | 3.33 |
| Single Male/Father | 0 (0.0%) | - |
| Single Female/Mother | 326 (22.5%) | 2.87 |
| Total Families | 1,446 (100.0%) | 3.22 |
Median Household Size in Las Flores CDP Orange County
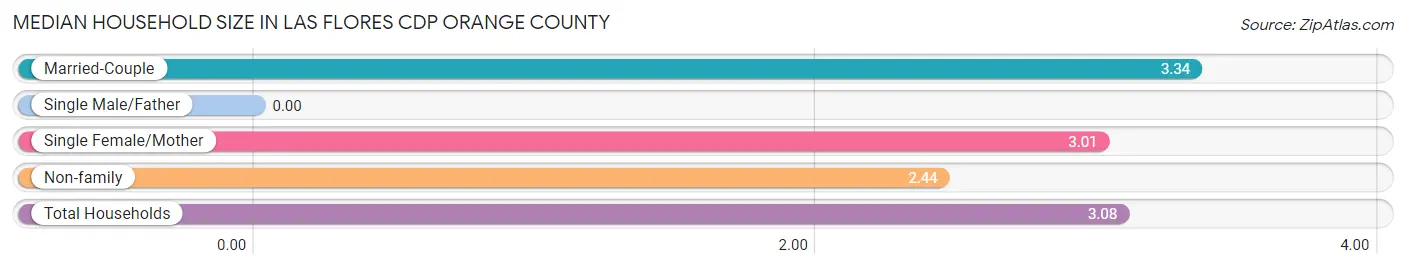
| Household Type | # Households | Household Size |
| Married-Couple | 1,120 (59.9%) | 3.34 |
| Single Male/Father | 0 (0.0%) | - |
| Single Female/Mother | 326 (17.4%) | 3.01 |
| Non-family | 424 (22.7%) | 2.44 |
| Total Households | 1,870 (100.0%) | 3.08 |
Household Size by Marriage Status in Las Flores CDP Orange County
Out of a total of 1,870 households in Las Flores CDP Orange County, 1,446 (77.3%) are family households, while 424 (22.7%) are nonfamily households. The most numerous type of family households are 2-person households, comprising 568, and the most common type of nonfamily households are 2-person households, comprising 172.
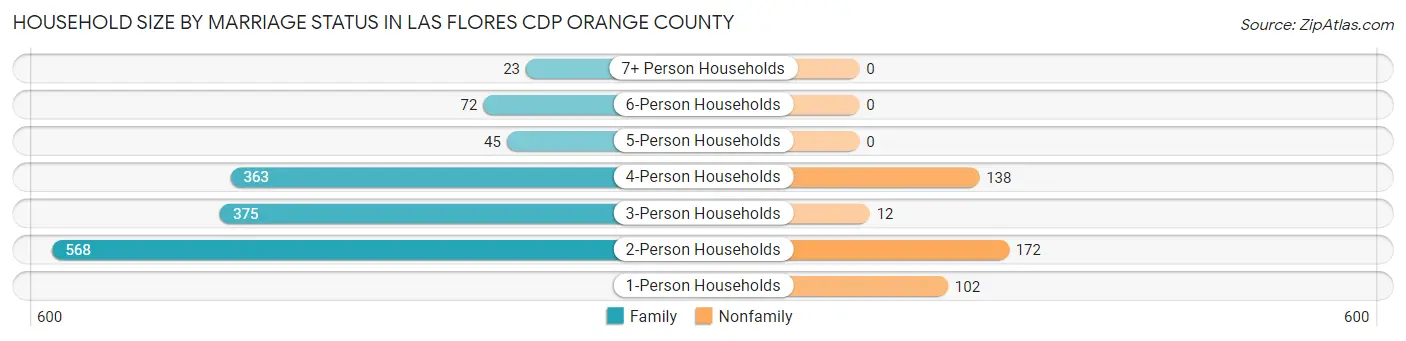
| Household Size | Family Households | Nonfamily Households |
| 1-Person Households | - | 102 (5.4%) |
| 2-Person Households | 568 (30.4%) | 172 (9.2%) |
| 3-Person Households | 375 (20.1%) | 12 (0.6%) |
| 4-Person Households | 363 (19.4%) | 138 (7.4%) |
| 5-Person Households | 45 (2.4%) | 0 (0.0%) |
| 6-Person Households | 72 (3.8%) | 0 (0.0%) |
| 7+ Person Households | 23 (1.2%) | 0 (0.0%) |
| Total | 1,446 (77.3%) | 424 (22.7%) |
Female Fertility in Las Flores CDP Orange County
Fertility by Age in Las Flores CDP Orange County
Average fertility rate in Las Flores CDP Orange County is 67.0 births per 1,000 women. Women in the age bracket of 20 to 34 years have the highest fertility rate with 124.0 births per 1,000 women. Women in the age bracket of 20 to 34 years acount for 85.3% of all women with births.
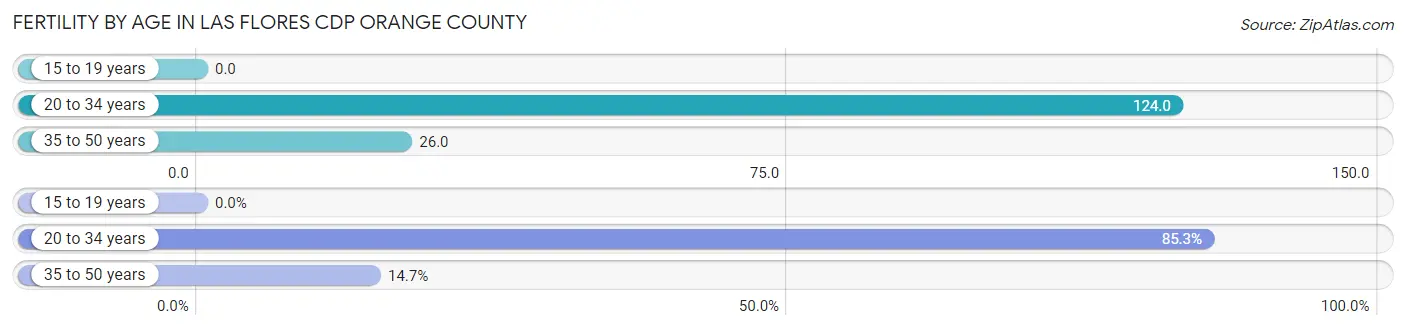
| Age Bracket | Women with Births | Births / 1,000 Women |
| 15 to 19 years | 0 (0.0%) | 0.0 |
| 20 to 34 years | 93 (85.3%) | 124.0 |
| 35 to 50 years | 16 (14.7%) | 26.0 |
| Total | 109 (100.0%) | 67.0 |
Fertility by Age by Marriage Status in Las Flores CDP Orange County
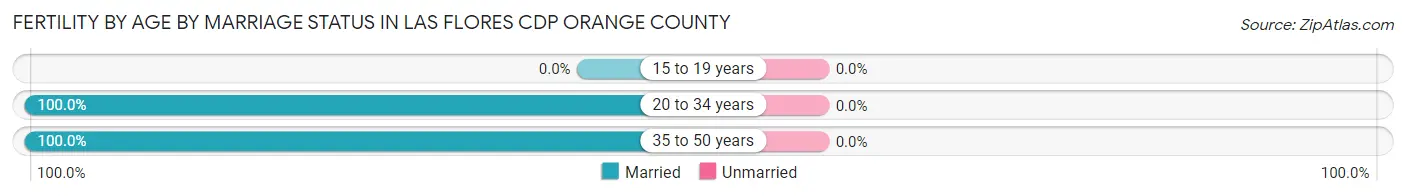
| Age Bracket | Married | Unmarried |
| 15 to 19 years | 0 (0.0%) | 0 (0.0%) |
| 20 to 34 years | 93 (100.0%) | 0 (0.0%) |
| 35 to 50 years | 16 (100.0%) | 0 (0.0%) |
| Total | 109 (100.0%) | 0 (0.0%) |
Fertility by Education in Las Flores CDP Orange County
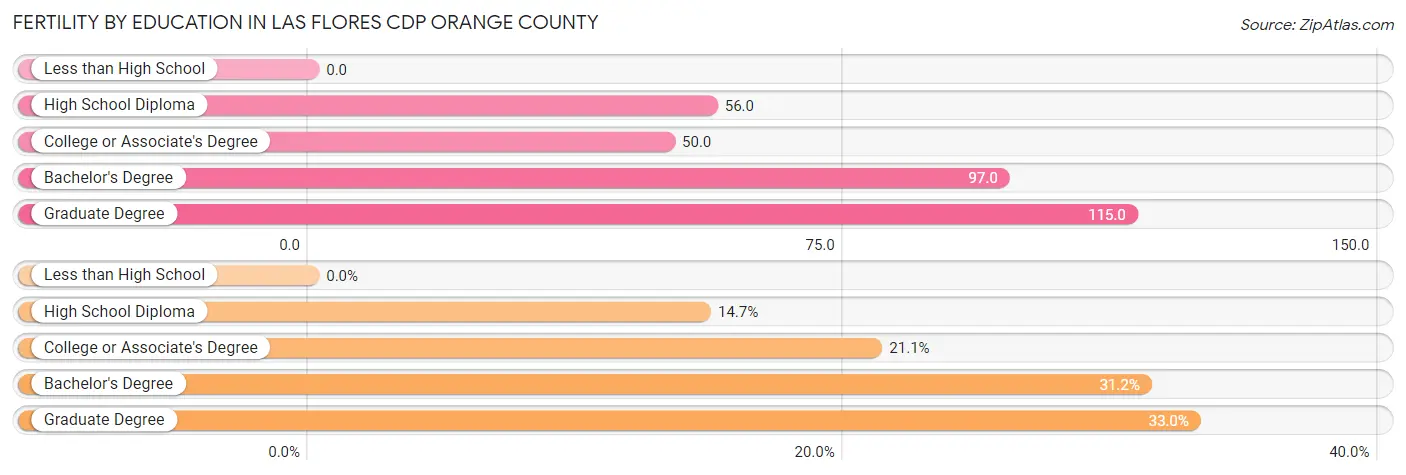
| Educational Attainment | Women with Births | Births / 1,000 Women |
| Less than High School | 0 (0.0%) | 0.0 |
| High School Diploma | 16 (14.7%) | 56.0 |
| College or Associate's Degree | 23 (21.1%) | 50.0 |
| Bachelor's Degree | 34 (31.2%) | 97.0 |
| Graduate Degree | 36 (33.0%) | 115.0 |
| Total | 109 (100.0%) | 67.0 |
Fertility by Education by Marriage Status in Las Flores CDP Orange County
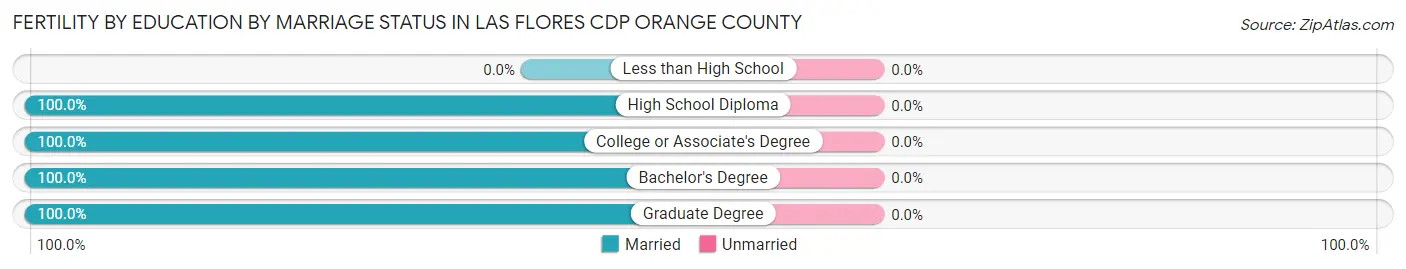
| Educational Attainment | Married | Unmarried |
| Less than High School | 0 (0.0%) | 0 (0.0%) |
| High School Diploma | 16 (100.0%) | 0 (0.0%) |
| College or Associate's Degree | 23 (100.0%) | 0 (0.0%) |
| Bachelor's Degree | 34 (100.0%) | 0 (0.0%) |
| Graduate Degree | 36 (100.0%) | 0 (0.0%) |
| Total | 109 (100.0%) | 0 (0.0%) |
Employment Characteristics in Las Flores CDP Orange County
Employment by Class of Employer in Las Flores CDP Orange County
Among the 3,220 employed individuals in Las Flores CDP Orange County, private company employees (2,478 | 77.0%), local government employees (235 | 7.3%), and self-employed (incorporated) (149 | 4.6%) make up the most common classes of employment.
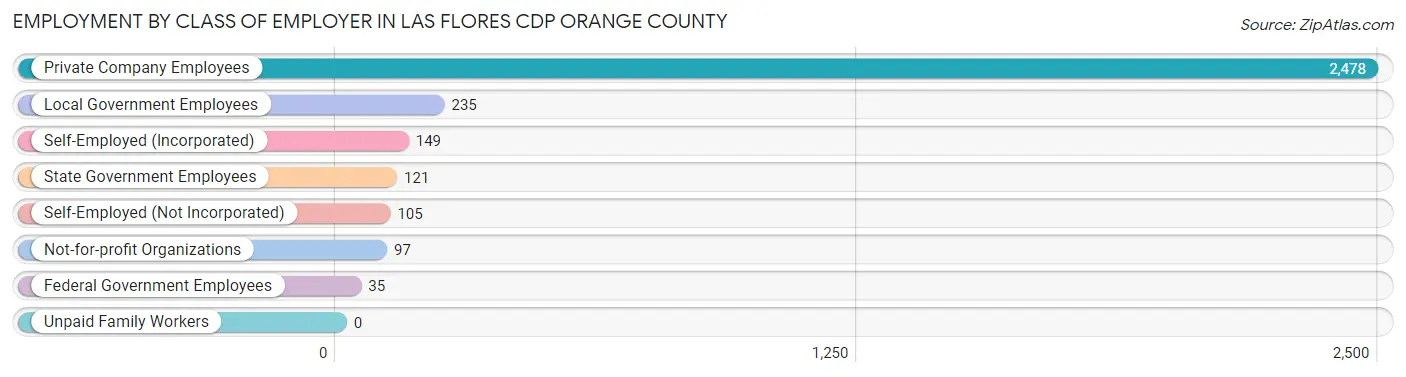
| Employer Class | # Employees | % Employees |
| Private Company Employees | 2,478 | 77.0% |
| Self-Employed (Incorporated) | 149 | 4.6% |
| Self-Employed (Not Incorporated) | 105 | 3.3% |
| Not-for-profit Organizations | 97 | 3.0% |
| Local Government Employees | 235 | 7.3% |
| State Government Employees | 121 | 3.8% |
| Federal Government Employees | 35 | 1.1% |
| Unpaid Family Workers | 0 | 0.0% |
| Total | 3,220 | 100.0% |
Employment Status by Age in Las Flores CDP Orange County
According to the labor force statistics for Las Flores CDP Orange County, out of the total population over 16 years of age (4,404), 76.6% or 3,373 individuals are in the labor force, with 3.4% or 115 of them unemployed. The age group with the highest labor force participation rate is 30 to 34 years, with 96.4% or 430 individuals in the labor force. Within the labor force, the 16 to 19 years age range has the highest percentage of unemployed individuals, with 14.5% or 11 of them being unemployed.
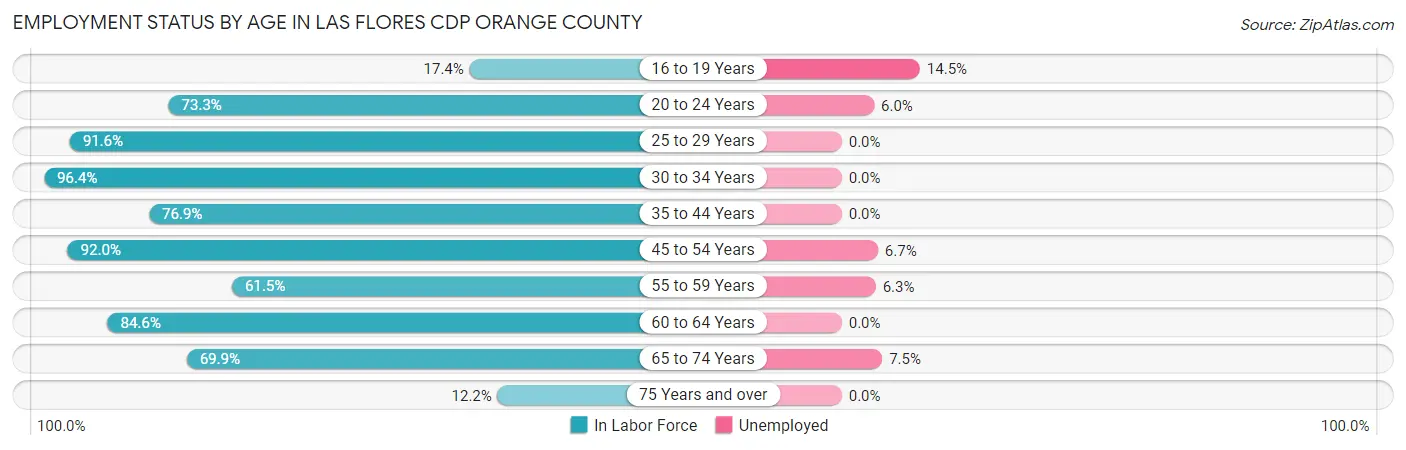
| Age Bracket | In Labor Force | Unemployed |
| 16 to 19 Years | 76 (17.4%) | 11 (14.5%) |
| 20 to 24 Years | 283 (73.3%) | 17 (6.0%) |
| 25 to 29 Years | 491 (91.6%) | 0 (0.0%) |
| 30 to 34 Years | 430 (96.4%) | 0 (0.0%) |
| 35 to 44 Years | 544 (76.9%) | 0 (0.0%) |
| 45 to 54 Years | 981 (92.0%) | 66 (6.7%) |
| 55 to 59 Years | 174 (61.5%) | 11 (6.3%) |
| 60 to 64 Years | 241 (84.6%) | 0 (0.0%) |
| 65 to 74 Years | 146 (69.9%) | 11 (7.5%) |
| 75 Years and over | 6 (12.2%) | 0 (0.0%) |
| Total | 3,373 (76.6%) | 115 (3.4%) |
Employment Status by Educational Attainment in Las Flores CDP Orange County
According to labor force statistics for Las Flores CDP Orange County, 86.1% of individuals (2,861) out of the total population between 25 and 64 years of age (3,323) are in the labor force, with 2.7% or 77 of them being unemployed. The group with the highest labor force participation rate are those with the educational attainment of less than high school, with 100.0% or 31 individuals in the labor force. Within the labor force, individuals with college / associate degree education have the highest percentage of unemployment, with 5.3% or 50 of them being unemployed.
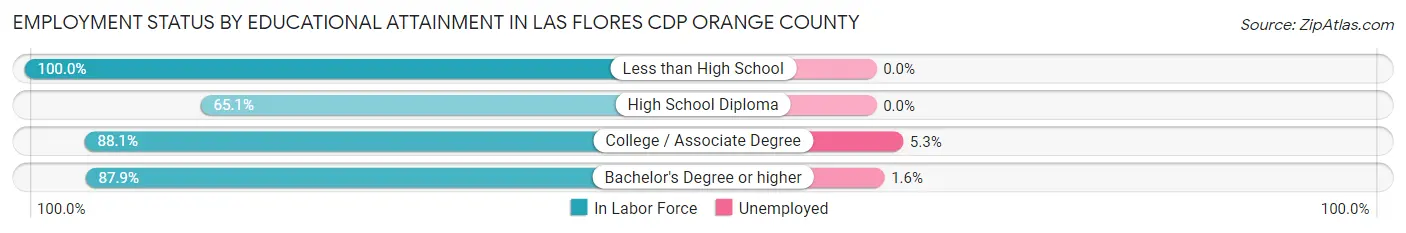
| Educational Attainment | In Labor Force | Unemployed |
| Less than High School | 31 (100.0%) | 0 (0.0%) |
| High School Diploma | 188 (65.1%) | 0 (0.0%) |
| College / Associate Degree | 947 (88.1%) | 57 (5.3%) |
| Bachelor's Degree or higher | 1,695 (87.9%) | 31 (1.6%) |
| Total | 2,861 (86.1%) | 90 (2.7%) |
Employment Occupations by Sex in Las Flores CDP Orange County
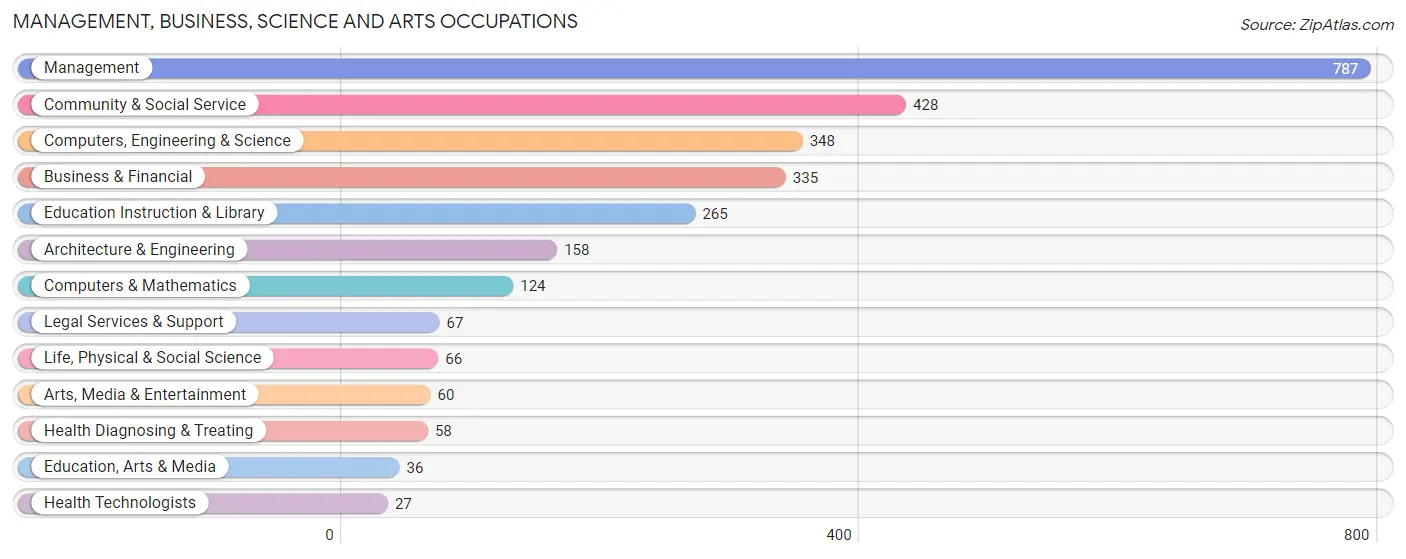
Management, Business, Science and Arts Occupations
The most common Management, Business, Science and Arts occupations in Las Flores CDP Orange County are Management (787 | 24.2%), Community & Social Service (428 | 13.1%), Computers, Engineering & Science (348 | 10.7%), Business & Financial (335 | 10.3%), and Education Instruction & Library (265 | 8.1%).
Management, Business, Science and Arts Occupations by Sex
Within the Management, Business, Science and Arts occupations in Las Flores CDP Orange County, the most male-oriented occupations are Legal Services & Support (92.5%), Architecture & Engineering (91.1%), and Computers, Engineering & Science (76.1%), while the most female-oriented occupations are Education, Arts & Media (100.0%), Health Technologists (100.0%), and Arts, Media & Entertainment (78.3%).
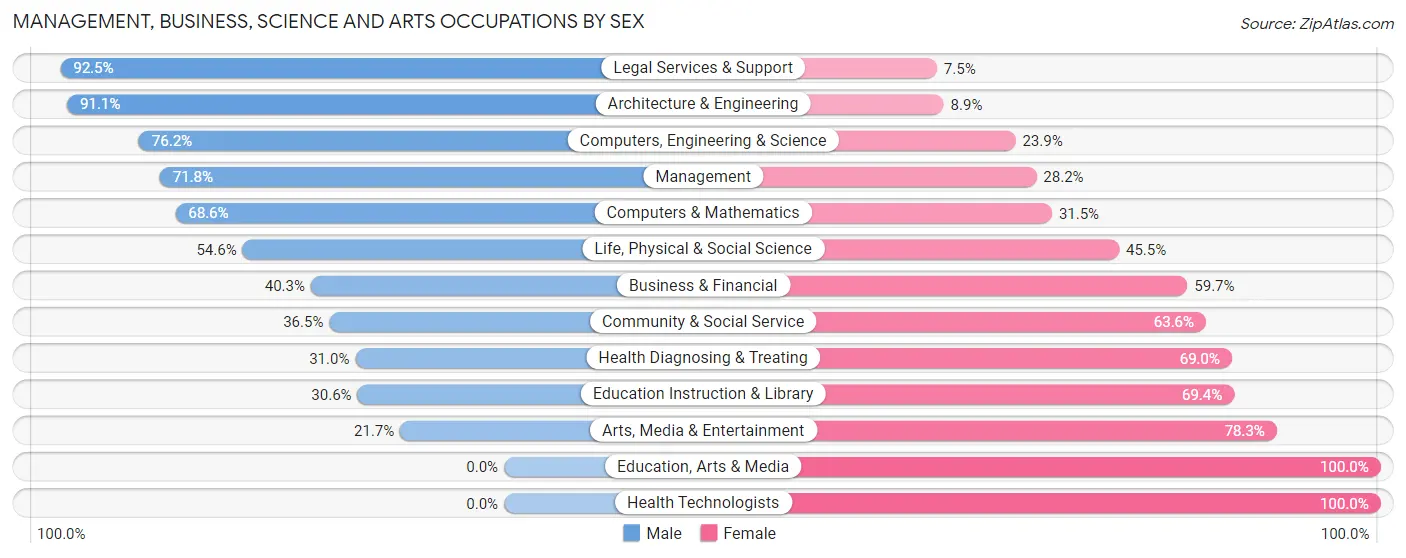
| Occupation | Male | Female |
| Management | 565 (71.8%) | 222 (28.2%) |
| Business & Financial | 135 (40.3%) | 200 (59.7%) |
| Computers, Engineering & Science | 265 (76.1%) | 83 (23.8%) |
| Computers & Mathematics | 85 (68.5%) | 39 (31.5%) |
| Architecture & Engineering | 144 (91.1%) | 14 (8.9%) |
| Life, Physical & Social Science | 36 (54.5%) | 30 (45.5%) |
| Community & Social Service | 156 (36.4%) | 272 (63.5%) |
| Education, Arts & Media | 0 (0.0%) | 36 (100.0%) |
| Legal Services & Support | 62 (92.5%) | 5 (7.5%) |
| Education Instruction & Library | 81 (30.6%) | 184 (69.4%) |
| Arts, Media & Entertainment | 13 (21.7%) | 47 (78.3%) |
| Health Diagnosing & Treating | 18 (31.0%) | 40 (69.0%) |
| Health Technologists | 0 (0.0%) | 27 (100.0%) |
| Total (Category) | 1,139 (58.2%) | 817 (41.8%) |
| Total (Overall) | 1,684 (51.7%) | 1,572 (48.3%) |
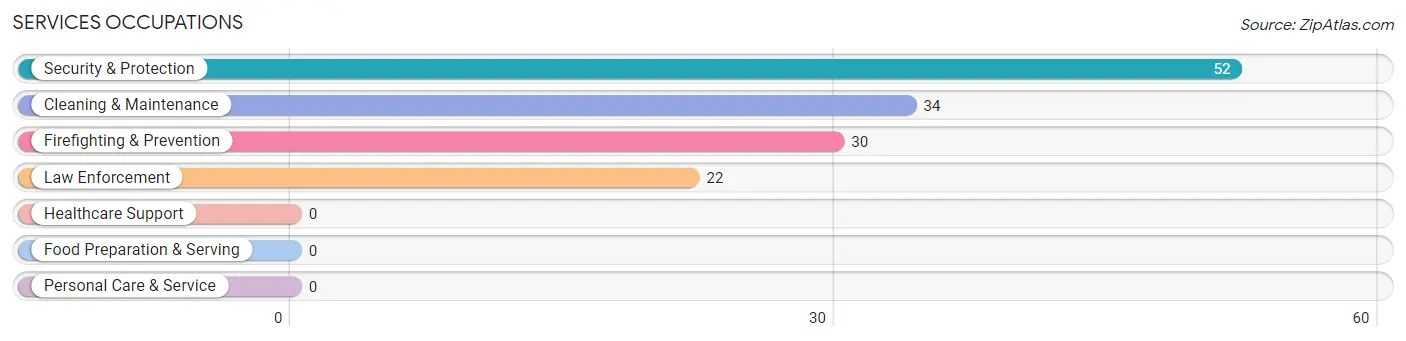
Services Occupations
The most common Services occupations in Las Flores CDP Orange County are Security & Protection (52 | 1.6%), Cleaning & Maintenance (34 | 1.0%), Firefighting & Prevention (30 | 0.9%), and Law Enforcement (22 | 0.7%).
Services Occupations by Sex
Within the Services occupations in Las Flores CDP Orange County, the most male-oriented occupations are Cleaning & Maintenance (100.0%), Firefighting & Prevention (50.0%), and Security & Protection (28.8%), while the most female-oriented occupations are Law Enforcement (100.0%), Security & Protection (71.2%), and Firefighting & Prevention (50.0%).
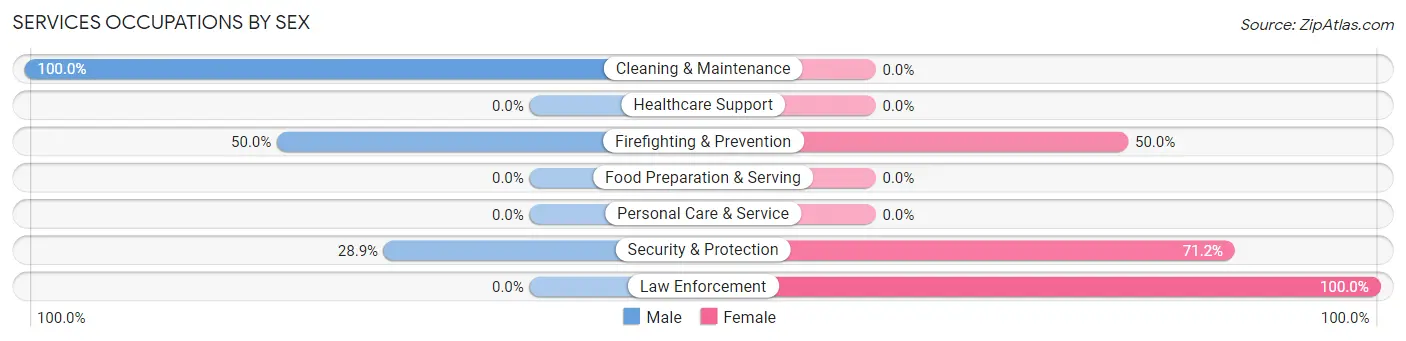
| Occupation | Male | Female |
| Healthcare Support | 0 (0.0%) | 0 (0.0%) |
| Security & Protection | 15 (28.8%) | 37 (71.2%) |
| Firefighting & Prevention | 15 (50.0%) | 15 (50.0%) |
| Law Enforcement | 0 (0.0%) | 22 (100.0%) |
| Food Preparation & Serving | 0 (0.0%) | 0 (0.0%) |
| Cleaning & Maintenance | 34 (100.0%) | 0 (0.0%) |
| Personal Care & Service | 0 (0.0%) | 0 (0.0%) |
| Total (Category) | 49 (57.0%) | 37 (43.0%) |
| Total (Overall) | 1,684 (51.7%) | 1,572 (48.3%) |
Sales and Office Occupations
The most common Sales and Office occupations in Las Flores CDP Orange County are Sales & Related (513 | 15.8%), and Office & Administration (393 | 12.1%).

Sales and Office Occupations by Sex
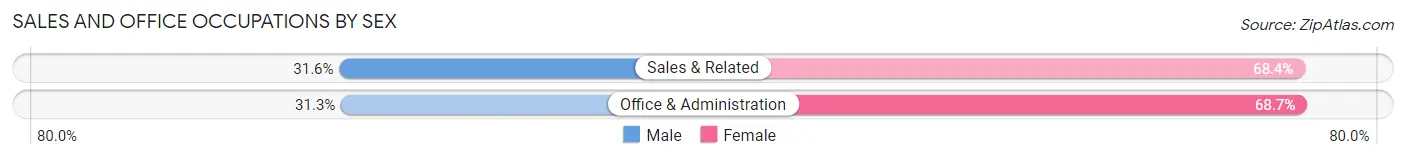
| Occupation | Male | Female |
| Sales & Related | 162 (31.6%) | 351 (68.4%) |
| Office & Administration | 123 (31.3%) | 270 (68.7%) |
| Total (Category) | 285 (31.5%) | 621 (68.5%) |
| Total (Overall) | 1,684 (51.7%) | 1,572 (48.3%) |
Natural Resources, Construction and Maintenance Occupations
The most common Natural Resources, Construction and Maintenance occupations in Las Flores CDP Orange County are Construction & Extraction (145 | 4.4%), and Installation, Maintenance & Repair (108 | 3.3%).
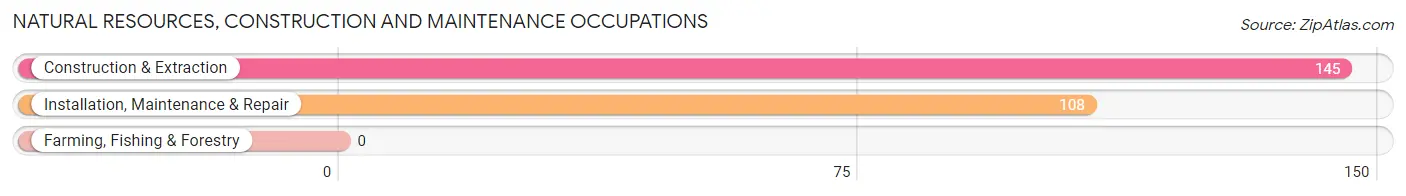
Natural Resources, Construction and Maintenance Occupations by Sex

| Occupation | Male | Female |
| Farming, Fishing & Forestry | 0 (0.0%) | 0 (0.0%) |
| Construction & Extraction | 145 (100.0%) | 0 (0.0%) |
| Installation, Maintenance & Repair | 24 (22.2%) | 84 (77.8%) |
| Total (Category) | 169 (66.8%) | 84 (33.2%) |
| Total (Overall) | 1,684 (51.7%) | 1,572 (48.3%) |
Production, Transportation and Moving Occupations
The most common Production, Transportation and Moving occupations in Las Flores CDP Orange County are Material Moving (42 | 1.3%), and Transportation (13 | 0.4%).
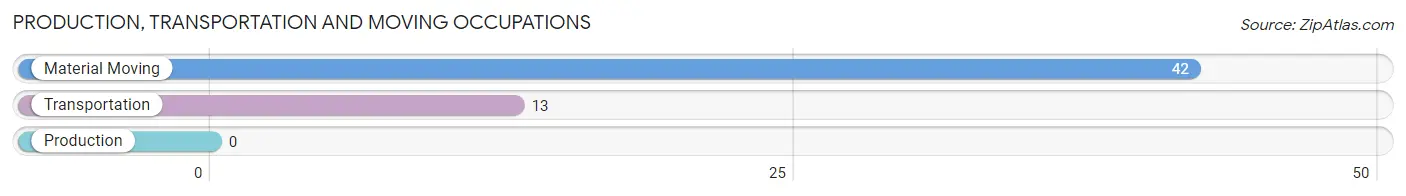
Production, Transportation and Moving Occupations by Sex
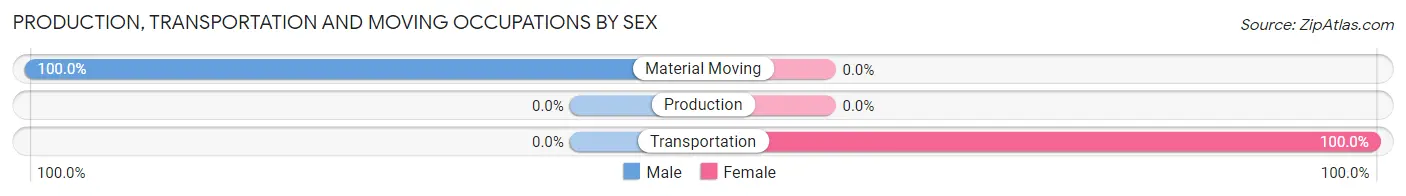
| Occupation | Male | Female |
| Production | 0 (0.0%) | 0 (0.0%) |
| Transportation | 0 (0.0%) | 13 (100.0%) |
| Material Moving | 42 (100.0%) | 0 (0.0%) |
| Total (Category) | 42 (76.4%) | 13 (23.6%) |
| Total (Overall) | 1,684 (51.7%) | 1,572 (48.3%) |
Employment Industries by Sex in Las Flores CDP Orange County
Employment Industries in Las Flores CDP Orange County
The major employment industries in Las Flores CDP Orange County include Retail Trade (554 | 17.0%), Educational Services (384 | 11.8%), Professional & Scientific (345 | 10.6%), Manufacturing (288 | 8.8%), and Construction (281 | 8.6%).
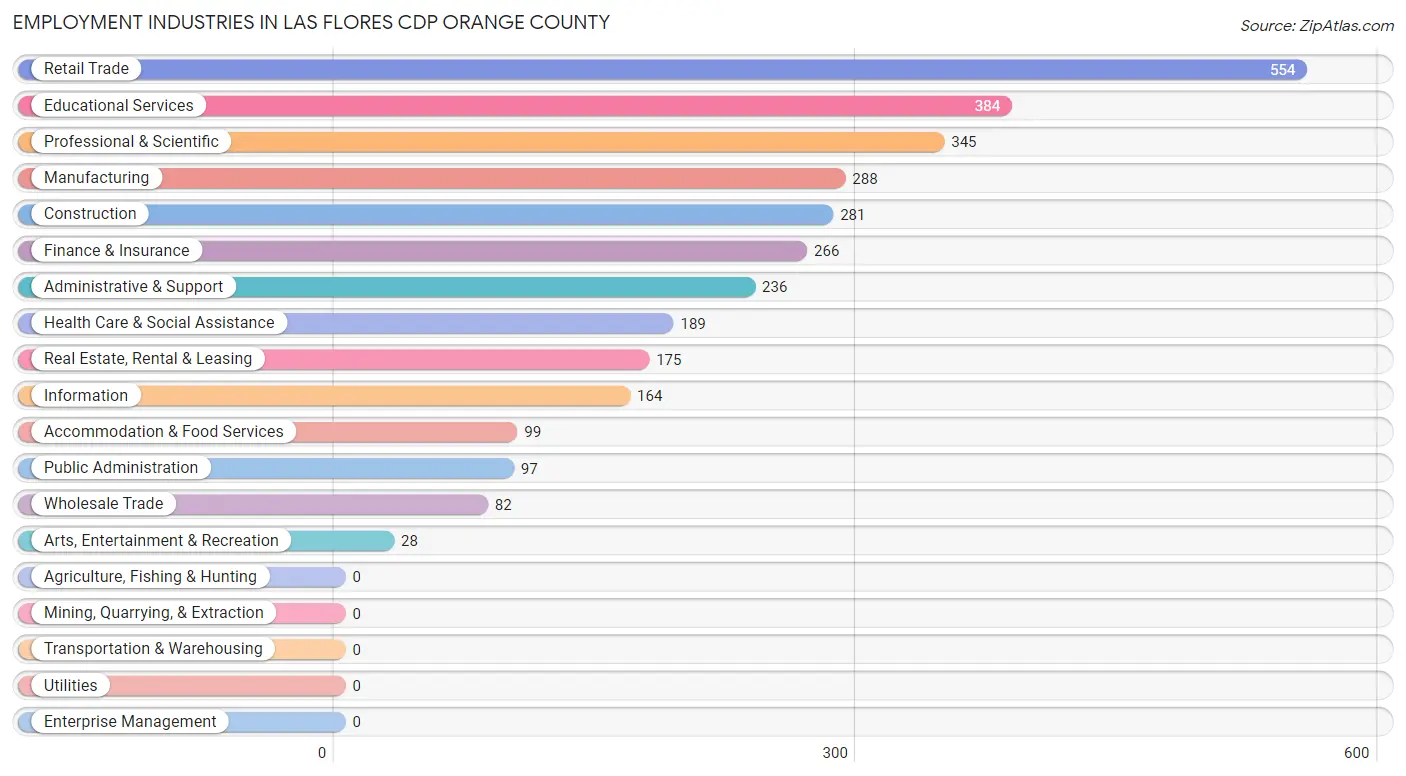
Employment Industries by Sex in Las Flores CDP Orange County
The Las Flores CDP Orange County industries that see more men than women are Arts, Entertainment & Recreation (100.0%), Information (86.6%), and Manufacturing (84.4%), whereas the industries that tend to have a higher number of women are Health Care & Social Assistance (79.9%), Retail Trade (78.2%), and Educational Services (71.9%).
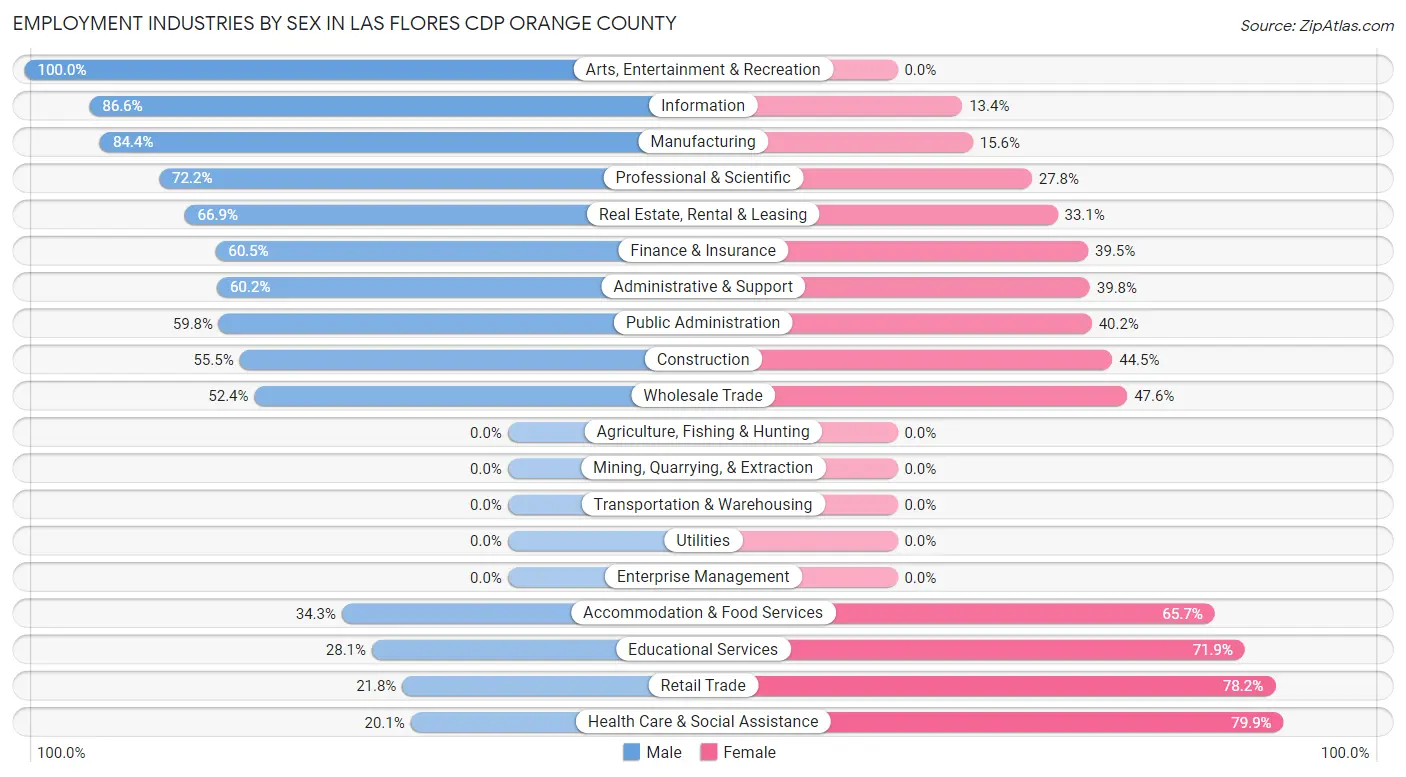
| Industry | Male | Female |
| Agriculture, Fishing & Hunting | 0 (0.0%) | 0 (0.0%) |
| Mining, Quarrying, & Extraction | 0 (0.0%) | 0 (0.0%) |
| Construction | 156 (55.5%) | 125 (44.5%) |
| Manufacturing | 243 (84.4%) | 45 (15.6%) |
| Wholesale Trade | 43 (52.4%) | 39 (47.6%) |
| Retail Trade | 121 (21.8%) | 433 (78.2%) |
| Transportation & Warehousing | 0 (0.0%) | 0 (0.0%) |
| Utilities | 0 (0.0%) | 0 (0.0%) |
| Information | 142 (86.6%) | 22 (13.4%) |
| Finance & Insurance | 161 (60.5%) | 105 (39.5%) |
| Real Estate, Rental & Leasing | 117 (66.9%) | 58 (33.1%) |
| Professional & Scientific | 249 (72.2%) | 96 (27.8%) |
| Enterprise Management | 0 (0.0%) | 0 (0.0%) |
| Administrative & Support | 142 (60.2%) | 94 (39.8%) |
| Educational Services | 108 (28.1%) | 276 (71.9%) |
| Health Care & Social Assistance | 38 (20.1%) | 151 (79.9%) |
| Arts, Entertainment & Recreation | 28 (100.0%) | 0 (0.0%) |
| Accommodation & Food Services | 34 (34.3%) | 65 (65.7%) |
| Public Administration | 58 (59.8%) | 39 (40.2%) |
| Total | 1,684 (51.7%) | 1,572 (48.3%) |
Education in Las Flores CDP Orange County
School Enrollment in Las Flores CDP Orange County
The most common levels of schooling among the 1,795 students in Las Flores CDP Orange County are high school (582 | 32.4%), middle school (423 | 23.6%), and college / undergraduate (289 | 16.1%).
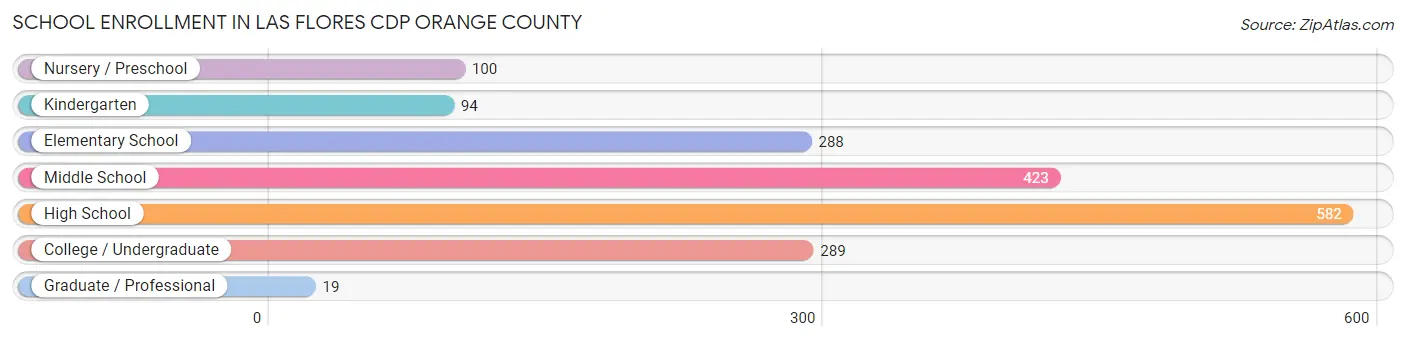
| School Level | # Students | % Students |
| Nursery / Preschool | 100 | 5.6% |
| Kindergarten | 94 | 5.2% |
| Elementary School | 288 | 16.0% |
| Middle School | 423 | 23.6% |
| High School | 582 | 32.4% |
| College / Undergraduate | 289 | 16.1% |
| Graduate / Professional | 19 | 1.1% |
| Total | 1,795 | 100.0% |
School Enrollment by Age by Funding Source in Las Flores CDP Orange County
Out of a total of 1,795 students who are enrolled in schools in Las Flores CDP Orange County, 176 (9.8%) attend a private institution, while the remaining 1,619 (90.2%) are enrolled in public schools. The age group of 35 years and over has the highest likelihood of being enrolled in private schools, with 62 (76.5% in the age bracket) enrolled. Conversely, the age group of 10 to 14 year olds has the lowest likelihood of being enrolled in a private school, with 452 (100.0% in the age bracket) attending a public institution.
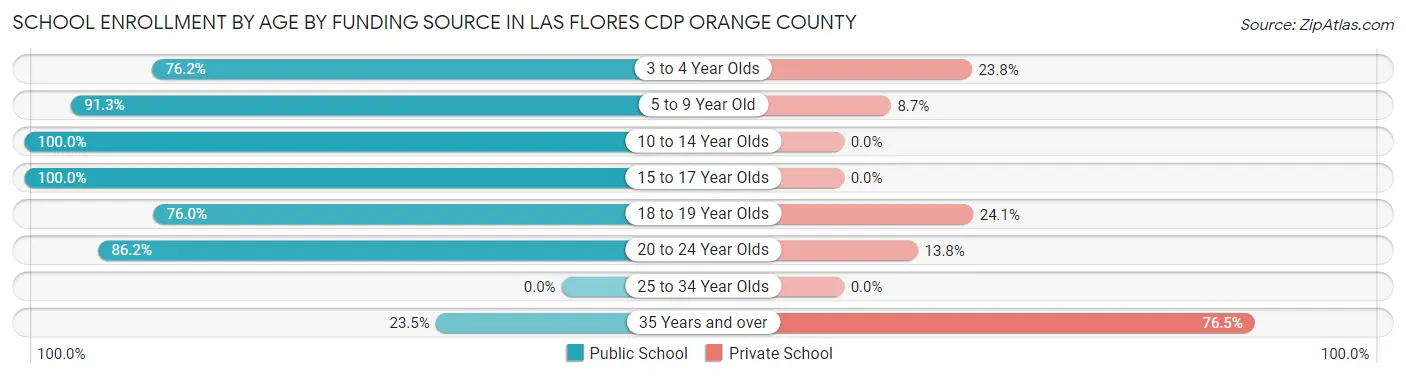
| Age Bracket | Public School | Private School |
| 3 to 4 Year Olds | 64 (76.2%) | 20 (23.8%) |
| 5 to 9 Year Old | 346 (91.3%) | 33 (8.7%) |
| 10 to 14 Year Olds | 452 (100.0%) | 0 (0.0%) |
| 15 to 17 Year Olds | 474 (100.0%) | 0 (0.0%) |
| 18 to 19 Year Olds | 120 (75.9%) | 38 (24.0%) |
| 20 to 24 Year Olds | 144 (86.2%) | 23 (13.8%) |
| 25 to 34 Year Olds | 0 (0.0%) | 0 (0.0%) |
| 35 Years and over | 19 (23.5%) | 62 (76.5%) |
| Total | 1,619 (90.2%) | 176 (9.8%) |
Educational Attainment by Field of Study in Las Flores CDP Orange County
Business (524 | 25.0%), engineering (373 | 17.8%), social sciences (206 | 9.8%), computers & mathematics (183 | 8.7%), and education (161 | 7.7%) are the most common fields of study among 2,097 individuals in Las Flores CDP Orange County who have obtained a bachelor's degree or higher.
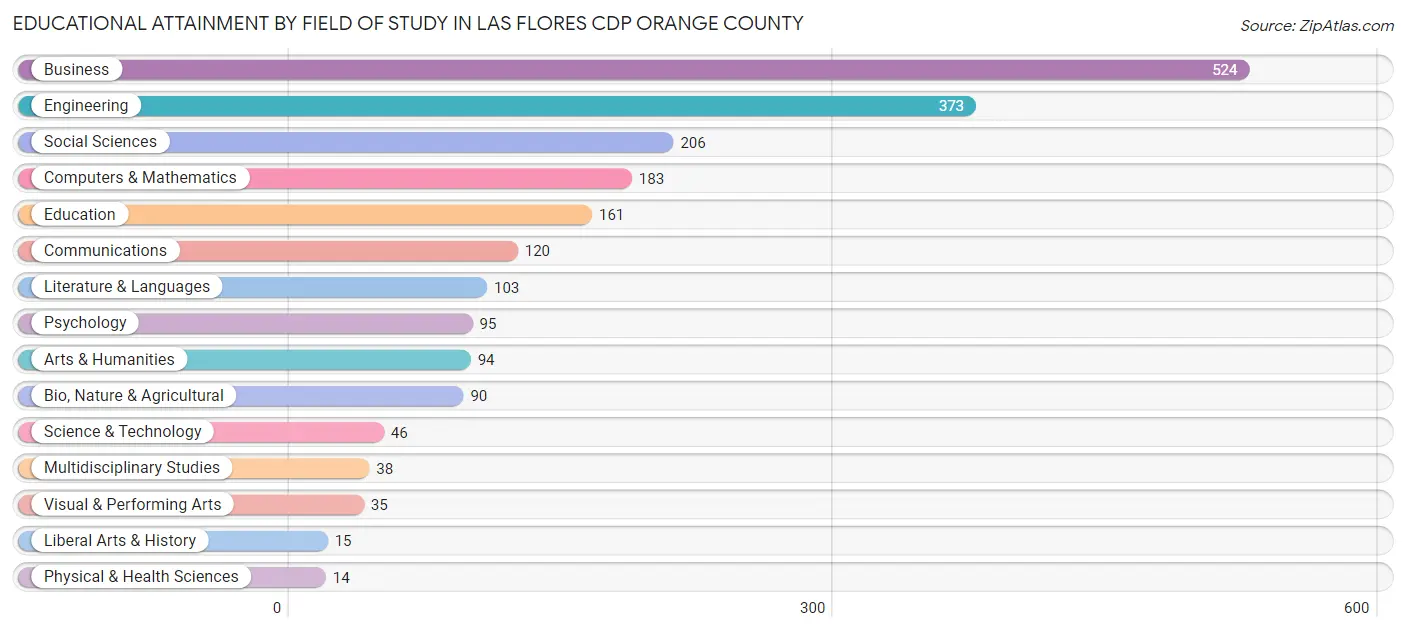
| Field of Study | # Graduates | % Graduates |
| Computers & Mathematics | 183 | 8.7% |
| Bio, Nature & Agricultural | 90 | 4.3% |
| Physical & Health Sciences | 14 | 0.7% |
| Psychology | 95 | 4.5% |
| Social Sciences | 206 | 9.8% |
| Engineering | 373 | 17.8% |
| Multidisciplinary Studies | 38 | 1.8% |
| Science & Technology | 46 | 2.2% |
| Business | 524 | 25.0% |
| Education | 161 | 7.7% |
| Literature & Languages | 103 | 4.9% |
| Liberal Arts & History | 15 | 0.7% |
| Visual & Performing Arts | 35 | 1.7% |
| Communications | 120 | 5.7% |
| Arts & Humanities | 94 | 4.5% |
| Total | 2,097 | 100.0% |
Transportation & Commute in Las Flores CDP Orange County
Vehicle Availability by Sex in Las Flores CDP Orange County
The most prevalent vehicle ownership categories in Las Flores CDP Orange County are males with 2 vehicles (764, accounting for 45.4%) and females with 2 vehicles (657, making up 49.7%).
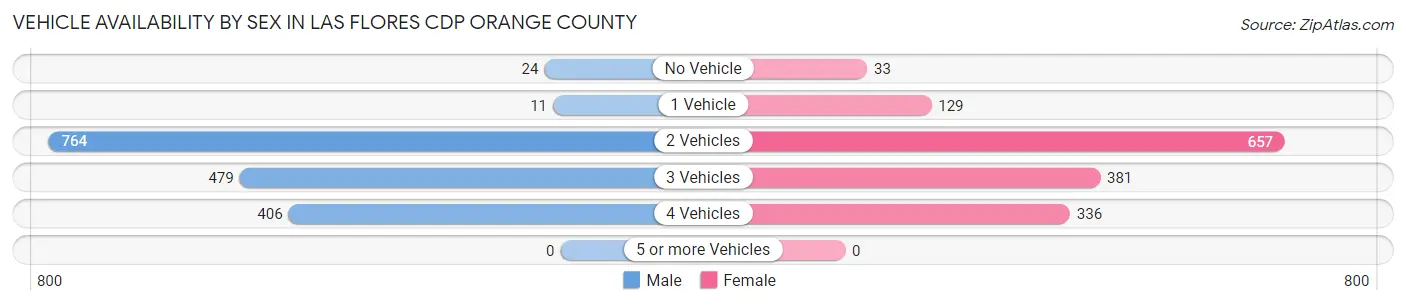
| Vehicles Available | Male | Female |
| No Vehicle | 24 (1.4%) | 33 (2.1%) |
| 1 Vehicle | 11 (0.6%) | 129 (8.4%) |
| 2 Vehicles | 764 (45.4%) | 657 (42.8%) |
| 3 Vehicles | 479 (28.4%) | 381 (24.8%) |
| 4 Vehicles | 406 (24.1%) | 336 (21.9%) |
| 5 or more Vehicles | 0 (0.0%) | 0 (0.0%) |
| Total | 1,684 (100.0%) | 1,536 (100.0%) |
Commute Time in Las Flores CDP Orange County
The most frequently occuring commute durations in Las Flores CDP Orange County are 20 to 24 minutes (529 commuters, 19.6%), 30 to 34 minutes (475 commuters, 17.6%), and 10 to 14 minutes (446 commuters, 16.5%).
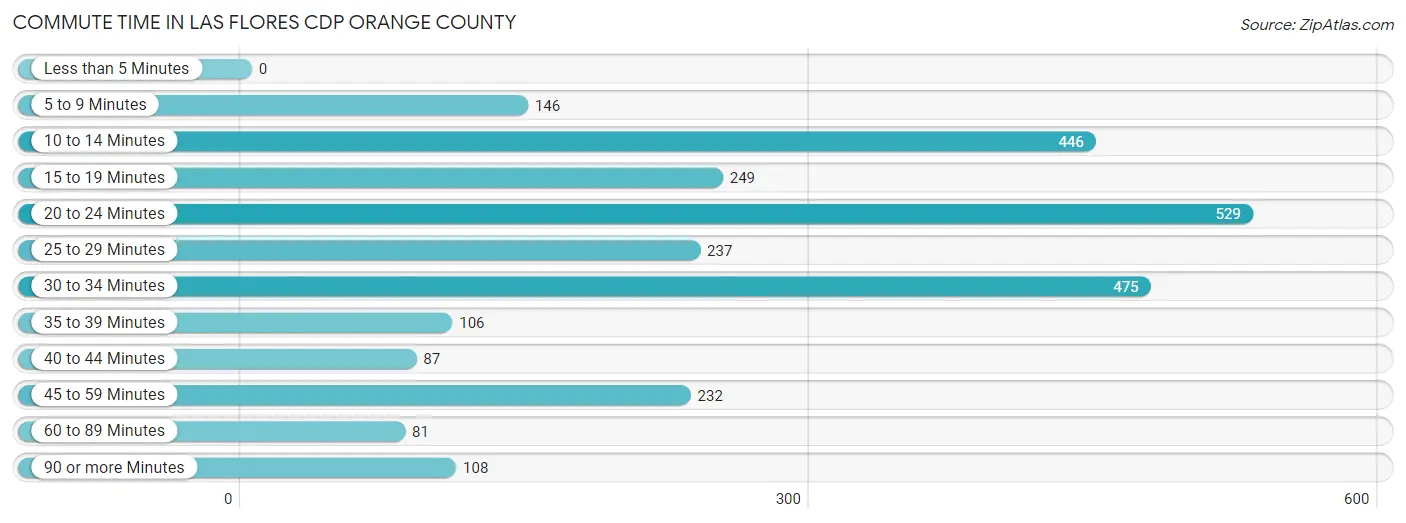
| Commute Time | # Commuters | % Commuters |
| Less than 5 Minutes | 0 | 0.0% |
| 5 to 9 Minutes | 146 | 5.4% |
| 10 to 14 Minutes | 446 | 16.5% |
| 15 to 19 Minutes | 249 | 9.2% |
| 20 to 24 Minutes | 529 | 19.6% |
| 25 to 29 Minutes | 237 | 8.8% |
| 30 to 34 Minutes | 475 | 17.6% |
| 35 to 39 Minutes | 106 | 3.9% |
| 40 to 44 Minutes | 87 | 3.2% |
| 45 to 59 Minutes | 232 | 8.6% |
| 60 to 89 Minutes | 81 | 3.0% |
| 90 or more Minutes | 108 | 4.0% |
Commute Time by Sex in Las Flores CDP Orange County
The most common commute times in Las Flores CDP Orange County are 20 to 24 minutes (339 commuters, 23.8%) for males and 30 to 34 minutes (310 commuters, 24.3%) for females.
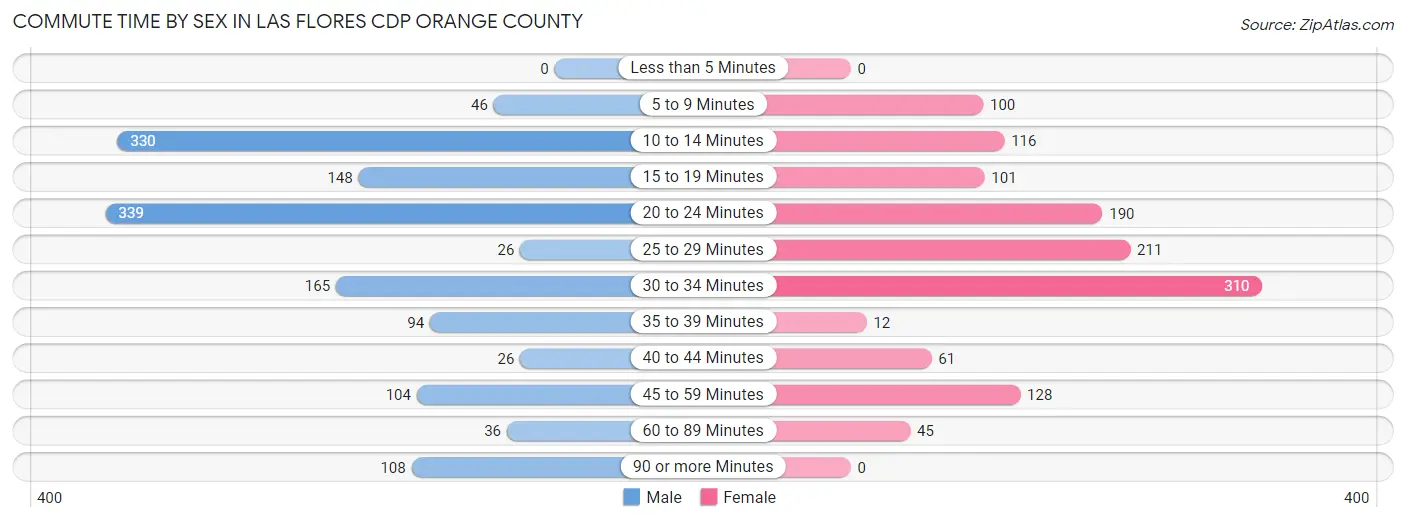
| Commute Time | Male | Female |
| Less than 5 Minutes | 0 (0.0%) | 0 (0.0%) |
| 5 to 9 Minutes | 46 (3.2%) | 100 (7.9%) |
| 10 to 14 Minutes | 330 (23.2%) | 116 (9.1%) |
| 15 to 19 Minutes | 148 (10.4%) | 101 (7.9%) |
| 20 to 24 Minutes | 339 (23.8%) | 190 (14.9%) |
| 25 to 29 Minutes | 26 (1.8%) | 211 (16.6%) |
| 30 to 34 Minutes | 165 (11.6%) | 310 (24.3%) |
| 35 to 39 Minutes | 94 (6.6%) | 12 (0.9%) |
| 40 to 44 Minutes | 26 (1.8%) | 61 (4.8%) |
| 45 to 59 Minutes | 104 (7.3%) | 128 (10.1%) |
| 60 to 89 Minutes | 36 (2.5%) | 45 (3.5%) |
| 90 or more Minutes | 108 (7.6%) | 0 (0.0%) |
Time of Departure to Work by Sex in Las Flores CDP Orange County
The most frequent times of departure to work in Las Flores CDP Orange County are 8:00 AM to 8:29 AM (639, 44.9%) for males and 6:30 AM to 6:59 AM (215, 16.9%) for females.
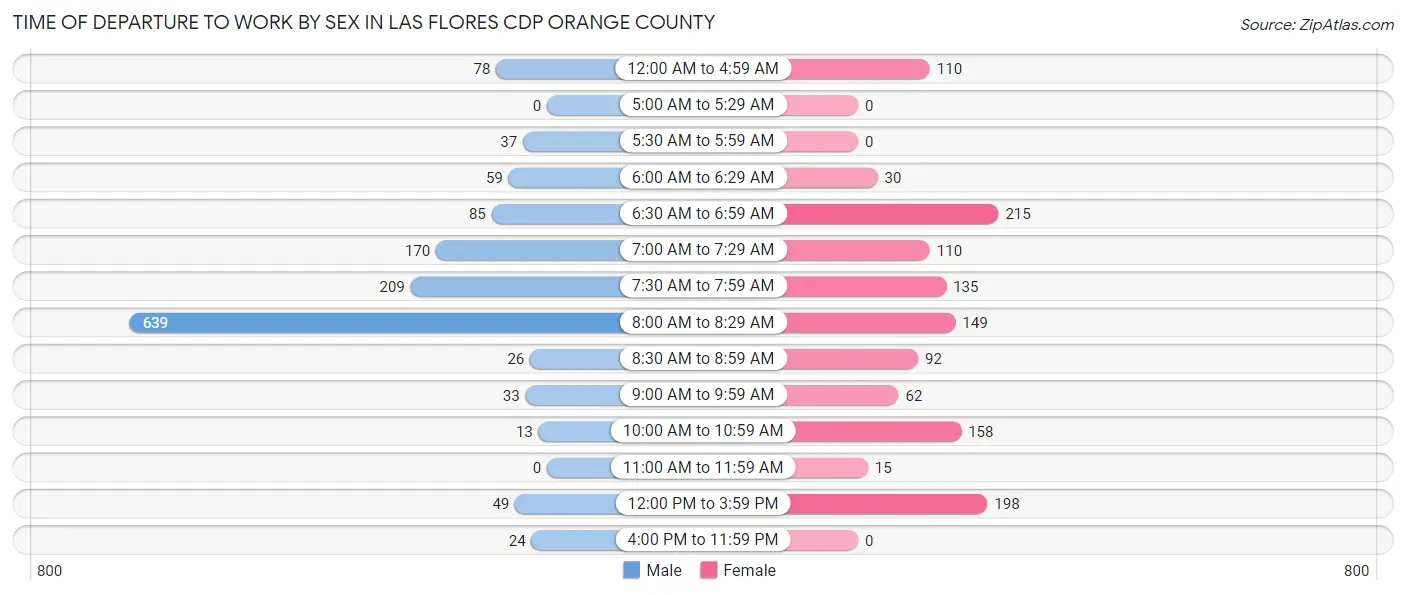
| Time of Departure | Male | Female |
| 12:00 AM to 4:59 AM | 78 (5.5%) | 110 (8.6%) |
| 5:00 AM to 5:29 AM | 0 (0.0%) | 0 (0.0%) |
| 5:30 AM to 5:59 AM | 37 (2.6%) | 0 (0.0%) |
| 6:00 AM to 6:29 AM | 59 (4.2%) | 30 (2.4%) |
| 6:30 AM to 6:59 AM | 85 (6.0%) | 215 (16.9%) |
| 7:00 AM to 7:29 AM | 170 (11.9%) | 110 (8.6%) |
| 7:30 AM to 7:59 AM | 209 (14.7%) | 135 (10.6%) |
| 8:00 AM to 8:29 AM | 639 (44.9%) | 149 (11.7%) |
| 8:30 AM to 8:59 AM | 26 (1.8%) | 92 (7.2%) |
| 9:00 AM to 9:59 AM | 33 (2.3%) | 62 (4.9%) |
| 10:00 AM to 10:59 AM | 13 (0.9%) | 158 (12.4%) |
| 11:00 AM to 11:59 AM | 0 (0.0%) | 15 (1.2%) |
| 12:00 PM to 3:59 PM | 49 (3.5%) | 198 (15.5%) |
| 4:00 PM to 11:59 PM | 24 (1.7%) | 0 (0.0%) |
| Total | 1,422 (100.0%) | 1,274 (100.0%) |
Housing Occupancy in Las Flores CDP Orange County
Occupancy by Ownership in Las Flores CDP Orange County
Of the total 1,870 dwellings in Las Flores CDP Orange County, owner-occupied units account for 1,350 (72.2%), while renter-occupied units make up 520 (27.8%).
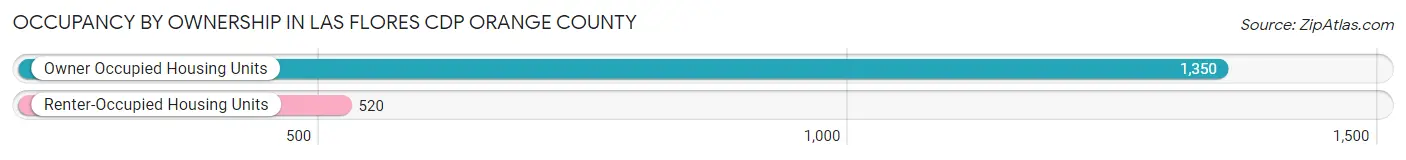
| Occupancy | # Housing Units | % Housing Units |
| Owner Occupied Housing Units | 1,350 | 72.2% |
| Renter-Occupied Housing Units | 520 | 27.8% |
| Total Occupied Housing Units | 1,870 | 100.0% |
Occupancy by Household Size in Las Flores CDP Orange County
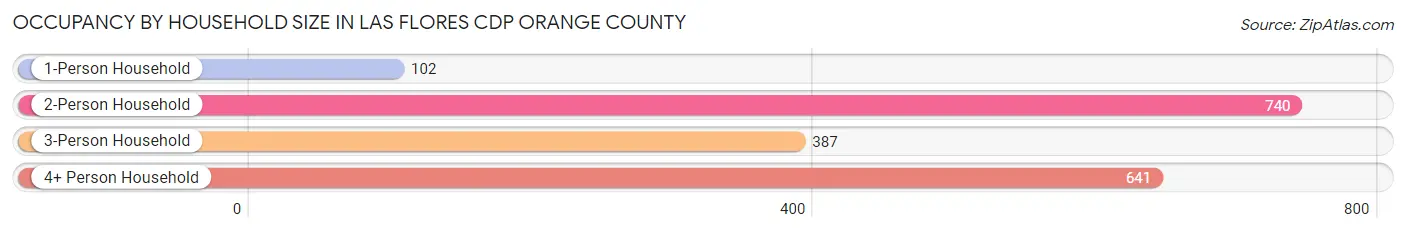
| Household Size | # Housing Units | % Housing Units |
| 1-Person Household | 102 | 5.4% |
| 2-Person Household | 740 | 39.6% |
| 3-Person Household | 387 | 20.7% |
| 4+ Person Household | 641 | 34.3% |
| Total Housing Units | 1,870 | 100.0% |
Occupancy by Ownership by Household Size in Las Flores CDP Orange County
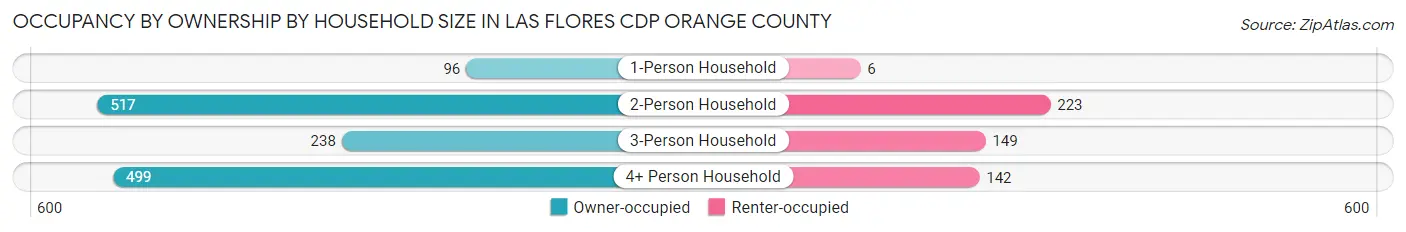
| Household Size | Owner-occupied | Renter-occupied |
| 1-Person Household | 96 (94.1%) | 6 (5.9%) |
| 2-Person Household | 517 (69.9%) | 223 (30.1%) |
| 3-Person Household | 238 (61.5%) | 149 (38.5%) |
| 4+ Person Household | 499 (77.8%) | 142 (22.2%) |
| Total Housing Units | 1,350 (72.2%) | 520 (27.8%) |
Occupancy by Educational Attainment in Las Flores CDP Orange County
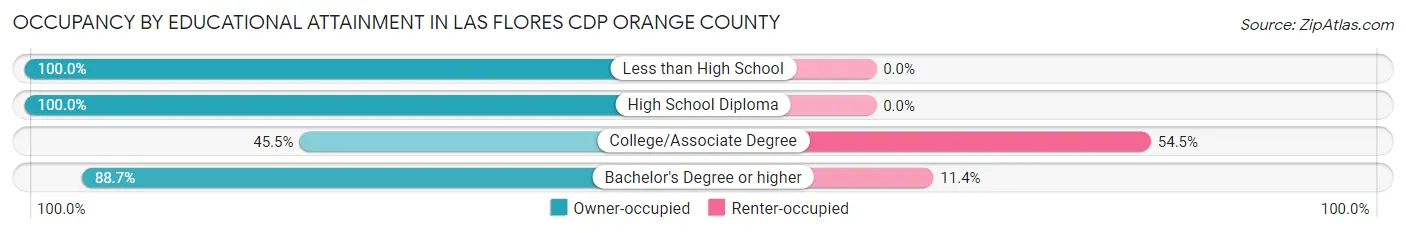
| Household Size | Owner-occupied | Renter-occupied |
| Less than High School | 20 (100.0%) | 0 (0.0%) |
| High School Diploma | 37 (100.0%) | 0 (0.0%) |
| College/Associate Degree | 332 (45.5%) | 397 (54.5%) |
| Bachelor's Degree or higher | 961 (88.6%) | 123 (11.4%) |
Occupancy by Age of Householder in Las Flores CDP Orange County
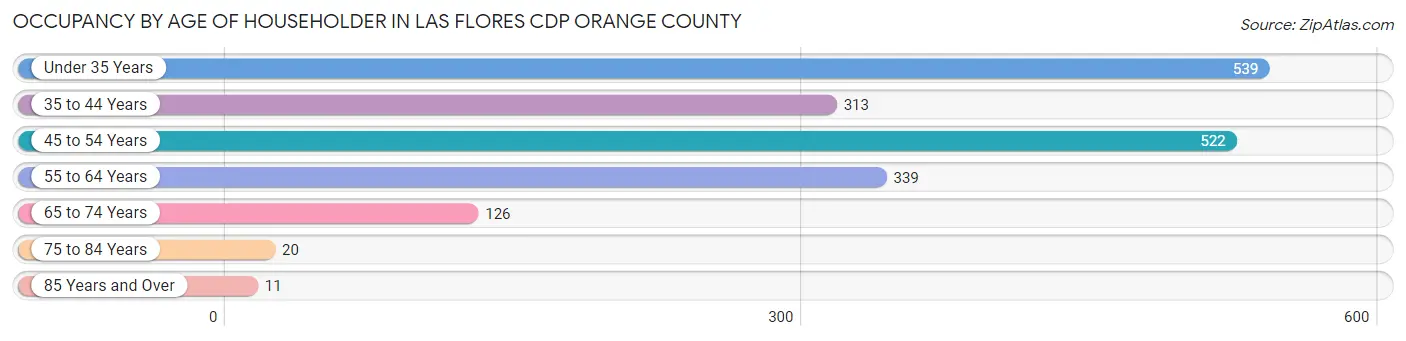
| Age Bracket | # Households | % Households |
| Under 35 Years | 539 | 28.8% |
| 35 to 44 Years | 313 | 16.7% |
| 45 to 54 Years | 522 | 27.9% |
| 55 to 64 Years | 339 | 18.1% |
| 65 to 74 Years | 126 | 6.7% |
| 75 to 84 Years | 20 | 1.1% |
| 85 Years and Over | 11 | 0.6% |
| Total | 1,870 | 100.0% |
Housing Finances in Las Flores CDP Orange County
Median Income by Occupancy in Las Flores CDP Orange County
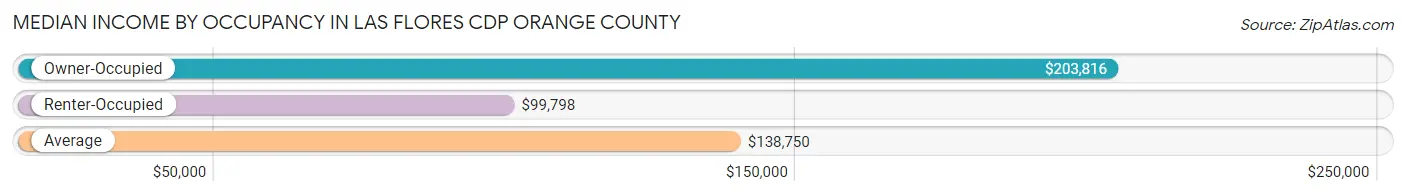
| Occupancy Type | # Households | Median Income |
| Owner-Occupied | 1,350 (72.2%) | $203,816 |
| Renter-Occupied | 520 (27.8%) | $99,798 |
| Average | 1,870 (100.0%) | $138,750 |
Occupancy by Householder Income Bracket in Las Flores CDP Orange County
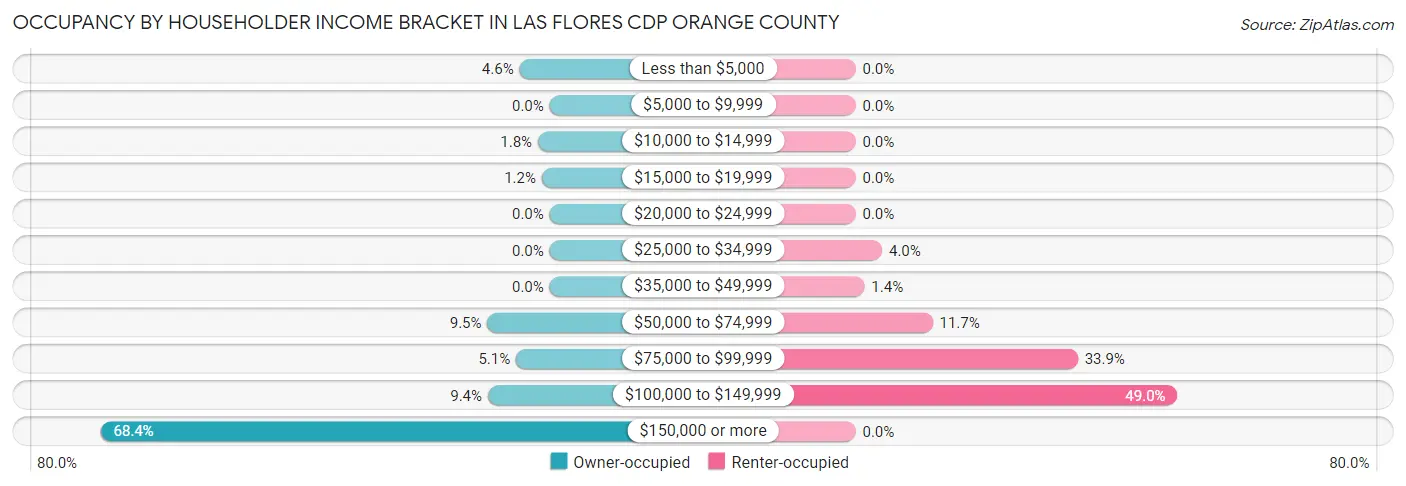
| Income Bracket | Owner-occupied | Renter-occupied |
| Less than $5,000 | 62 (4.6%) | 0 (0.0%) |
| $5,000 to $9,999 | 0 (0.0%) | 0 (0.0%) |
| $10,000 to $14,999 | 24 (1.8%) | 0 (0.0%) |
| $15,000 to $19,999 | 16 (1.2%) | 0 (0.0%) |
| $20,000 to $24,999 | 0 (0.0%) | 0 (0.0%) |
| $25,000 to $34,999 | 0 (0.0%) | 21 (4.0%) |
| $35,000 to $49,999 | 0 (0.0%) | 7 (1.3%) |
| $50,000 to $74,999 | 128 (9.5%) | 61 (11.7%) |
| $75,000 to $99,999 | 69 (5.1%) | 176 (33.9%) |
| $100,000 to $149,999 | 127 (9.4%) | 255 (49.0%) |
| $150,000 or more | 924 (68.4%) | 0 (0.0%) |
| Total | 1,350 (100.0%) | 520 (100.0%) |
Monthly Housing Cost Tiers in Las Flores CDP Orange County
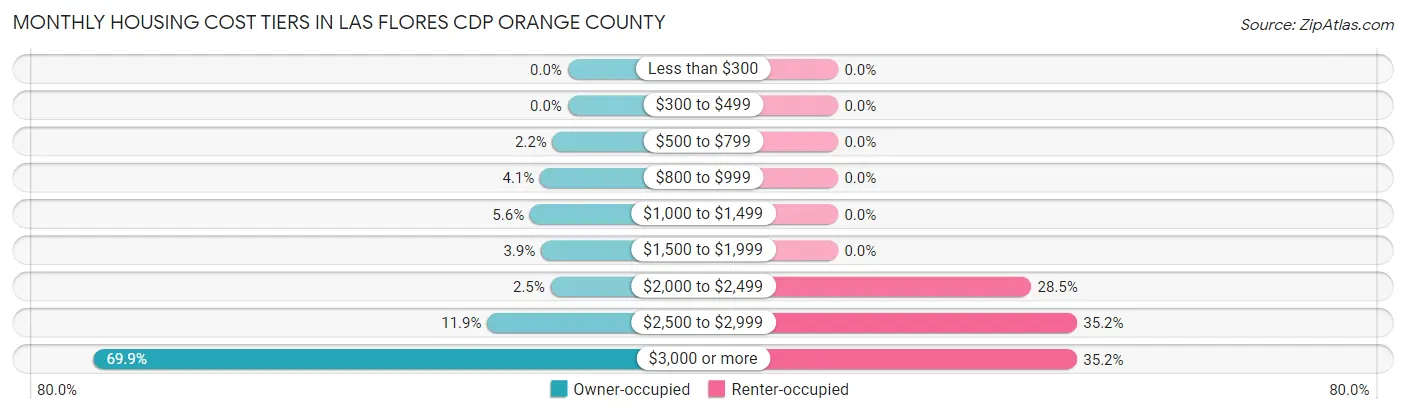
| Monthly Cost | Owner-occupied | Renter-occupied |
| Less than $300 | 0 (0.0%) | 0 (0.0%) |
| $300 to $499 | 0 (0.0%) | 0 (0.0%) |
| $500 to $799 | 30 (2.2%) | 0 (0.0%) |
| $800 to $999 | 55 (4.1%) | 0 (0.0%) |
| $1,000 to $1,499 | 75 (5.6%) | 0 (0.0%) |
| $1,500 to $1,999 | 53 (3.9%) | 0 (0.0%) |
| $2,000 to $2,499 | 34 (2.5%) | 148 (28.5%) |
| $2,500 to $2,999 | 160 (11.8%) | 183 (35.2%) |
| $3,000 or more | 943 (69.9%) | 183 (35.2%) |
| Total | 1,350 (100.0%) | 520 (100.0%) |
Physical Housing Characteristics in Las Flores CDP Orange County
Housing Structures in Las Flores CDP Orange County
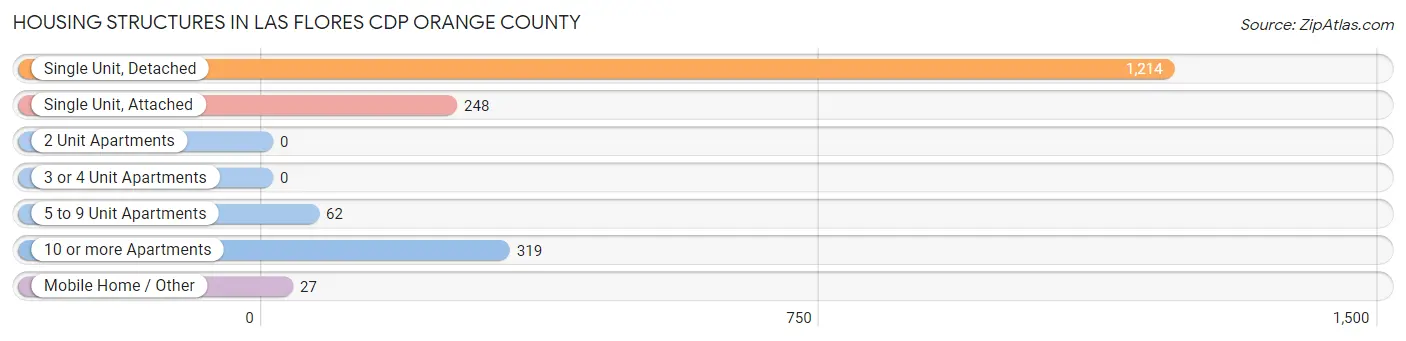
| Structure Type | # Housing Units | % Housing Units |
| Single Unit, Detached | 1,214 | 64.9% |
| Single Unit, Attached | 248 | 13.3% |
| 2 Unit Apartments | 0 | 0.0% |
| 3 or 4 Unit Apartments | 0 | 0.0% |
| 5 to 9 Unit Apartments | 62 | 3.3% |
| 10 or more Apartments | 319 | 17.1% |
| Mobile Home / Other | 27 | 1.4% |
| Total | 1,870 | 100.0% |
Housing Structures by Occupancy in Las Flores CDP Orange County
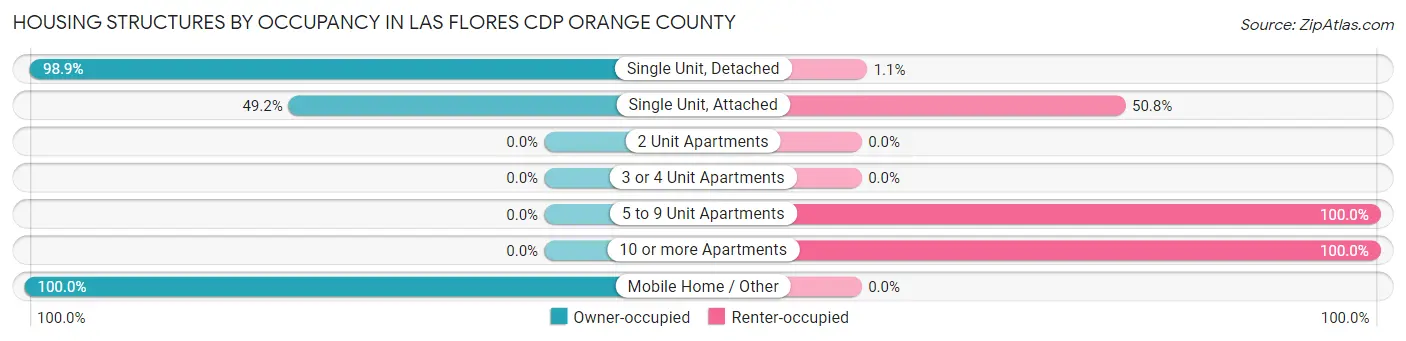
| Structure Type | Owner-occupied | Renter-occupied |
| Single Unit, Detached | 1,201 (98.9%) | 13 (1.1%) |
| Single Unit, Attached | 122 (49.2%) | 126 (50.8%) |
| 2 Unit Apartments | 0 (0.0%) | 0 (0.0%) |
| 3 or 4 Unit Apartments | 0 (0.0%) | 0 (0.0%) |
| 5 to 9 Unit Apartments | 0 (0.0%) | 62 (100.0%) |
| 10 or more Apartments | 0 (0.0%) | 319 (100.0%) |
| Mobile Home / Other | 27 (100.0%) | 0 (0.0%) |
| Total | 1,350 (72.2%) | 520 (27.8%) |
Housing Structures by Number of Rooms in Las Flores CDP Orange County
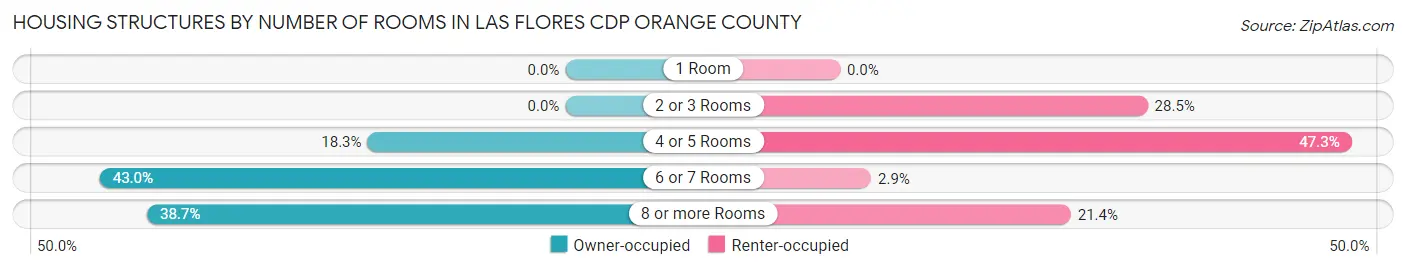
| Number of Rooms | Owner-occupied | Renter-occupied |
| 1 Room | 0 (0.0%) | 0 (0.0%) |
| 2 or 3 Rooms | 0 (0.0%) | 148 (28.5%) |
| 4 or 5 Rooms | 247 (18.3%) | 246 (47.3%) |
| 6 or 7 Rooms | 581 (43.0%) | 15 (2.9%) |
| 8 or more Rooms | 522 (38.7%) | 111 (21.3%) |
| Total | 1,350 (100.0%) | 520 (100.0%) |
Housing Structure by Heating Type in Las Flores CDP Orange County
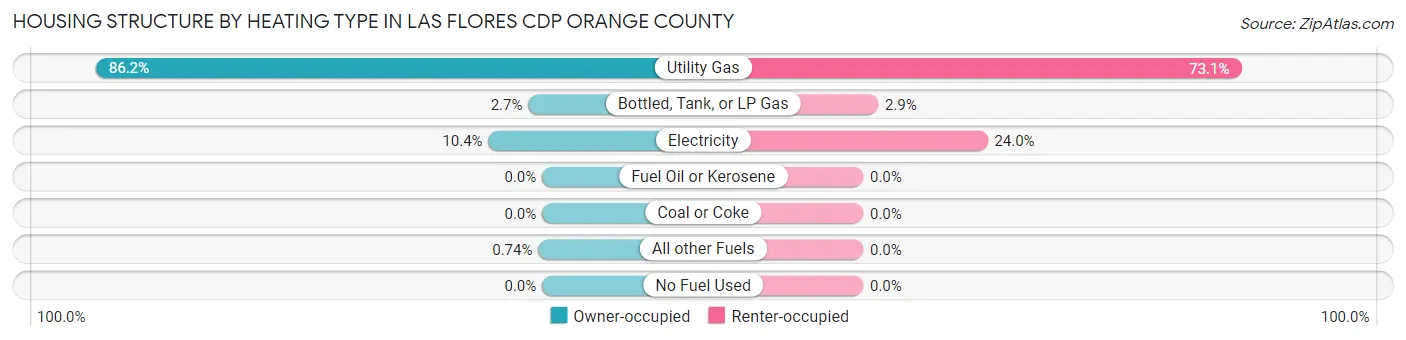
| Heating Type | Owner-occupied | Renter-occupied |
| Utility Gas | 1,164 (86.2%) | 380 (73.1%) |
| Bottled, Tank, or LP Gas | 36 (2.7%) | 15 (2.9%) |
| Electricity | 140 (10.4%) | 125 (24.0%) |
| Fuel Oil or Kerosene | 0 (0.0%) | 0 (0.0%) |
| Coal or Coke | 0 (0.0%) | 0 (0.0%) |
| All other Fuels | 10 (0.7%) | 0 (0.0%) |
| No Fuel Used | 0 (0.0%) | 0 (0.0%) |
| Total | 1,350 (100.0%) | 520 (100.0%) |
Household Vehicle Usage in Las Flores CDP Orange County
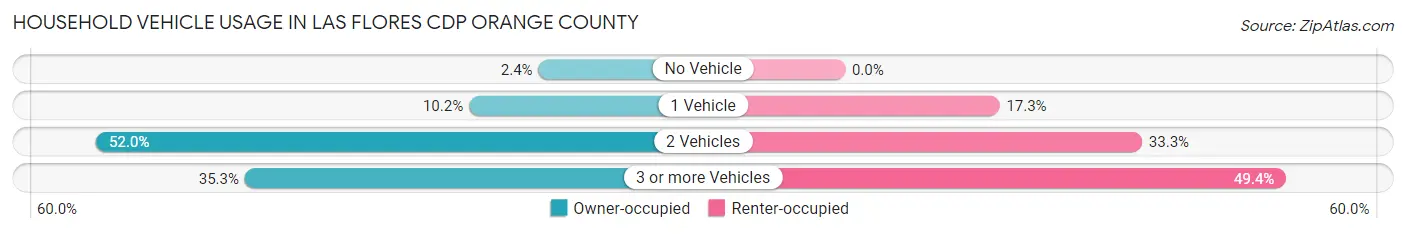
| Vehicles per Household | Owner-occupied | Renter-occupied |
| No Vehicle | 33 (2.4%) | 0 (0.0%) |
| 1 Vehicle | 138 (10.2%) | 90 (17.3%) |
| 2 Vehicles | 702 (52.0%) | 173 (33.3%) |
| 3 or more Vehicles | 477 (35.3%) | 257 (49.4%) |
| Total | 1,350 (100.0%) | 520 (100.0%) |
Real Estate & Mortgages in Las Flores CDP Orange County
Real Estate and Mortgage Overview in Las Flores CDP Orange County
| Characteristic | Without Mortgage | With Mortgage |
| Housing Units | 124 | 1,226 |
| Median Property Value | $891,300 | $982,300 |
| Median Household Income | - | - |
| Monthly Housing Costs | - | - |
| Real Estate Taxes | $7,308 | $0 |
Property Value by Mortgage Status in Las Flores CDP Orange County
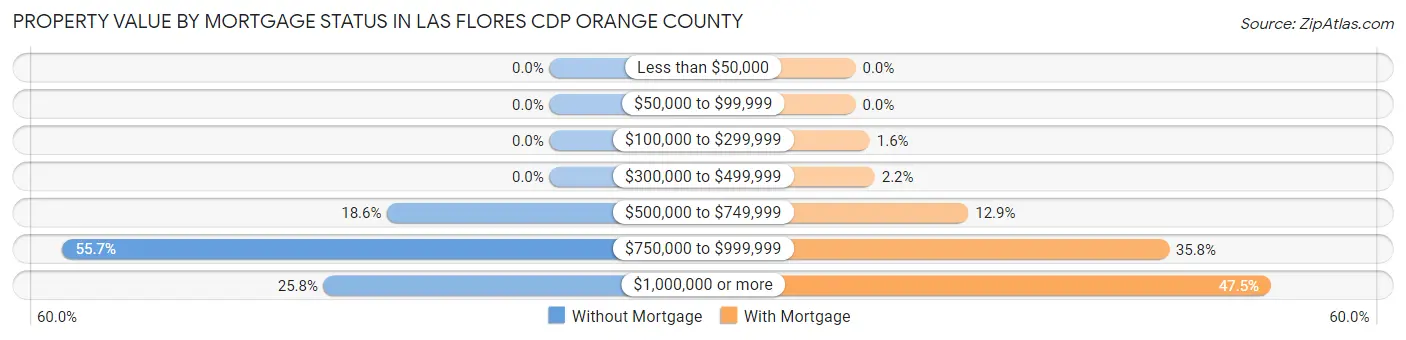
| Property Value | Without Mortgage | With Mortgage |
| Less than $50,000 | 0 (0.0%) | 0 (0.0%) |
| $50,000 to $99,999 | 0 (0.0%) | 0 (0.0%) |
| $100,000 to $299,999 | 0 (0.0%) | 20 (1.6%) |
| $300,000 to $499,999 | 0 (0.0%) | 27 (2.2%) |
| $500,000 to $749,999 | 23 (18.5%) | 158 (12.9%) |
| $750,000 to $999,999 | 69 (55.6%) | 439 (35.8%) |
| $1,000,000 or more | 32 (25.8%) | 582 (47.5%) |
| Total | 124 (100.0%) | 1,226 (100.0%) |
Household Income by Mortgage Status in Las Flores CDP Orange County
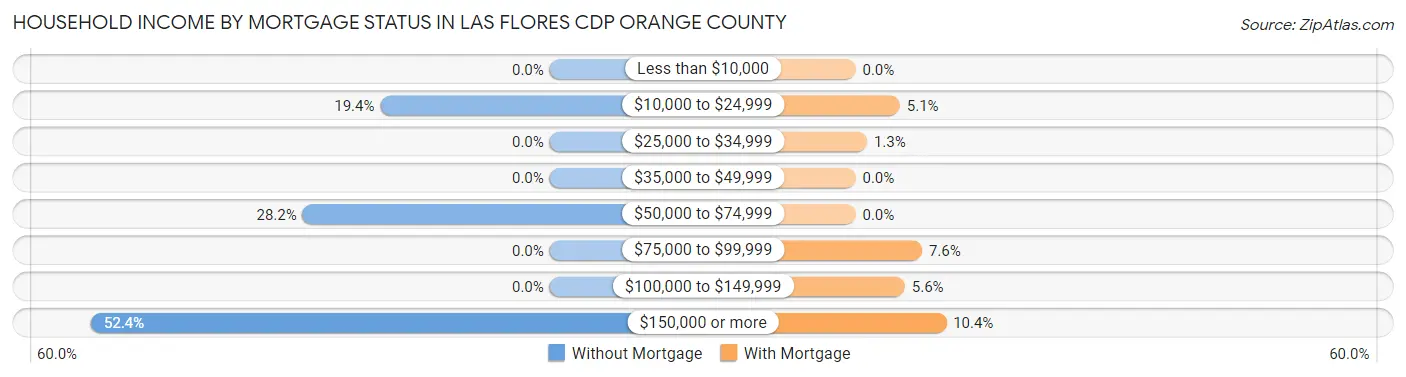
| Household Income | Without Mortgage | With Mortgage |
| Less than $10,000 | 0 (0.0%) | 0 (0.0%) |
| $10,000 to $24,999 | 24 (19.4%) | 62 (5.1%) |
| $25,000 to $34,999 | 0 (0.0%) | 16 (1.3%) |
| $35,000 to $49,999 | 0 (0.0%) | 0 (0.0%) |
| $50,000 to $74,999 | 35 (28.2%) | 0 (0.0%) |
| $75,000 to $99,999 | 0 (0.0%) | 93 (7.6%) |
| $100,000 to $149,999 | 0 (0.0%) | 69 (5.6%) |
| $150,000 or more | 65 (52.4%) | 127 (10.4%) |
| Total | 124 (100.0%) | 1,226 (100.0%) |
Property Value to Household Income Ratio in Las Flores CDP Orange County
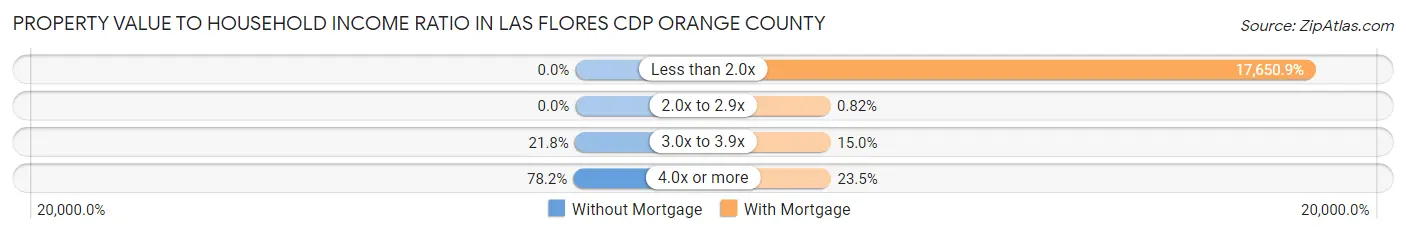
| Value-to-Income Ratio | Without Mortgage | With Mortgage |
| Less than 2.0x | 0 (0.0%) | 216,400 (17,650.9%) |
| 2.0x to 2.9x | 0 (0.0%) | 10 (0.8%) |
| 3.0x to 3.9x | 27 (21.8%) | 184 (15.0%) |
| 4.0x or more | 97 (78.2%) | 288 (23.5%) |
| Total | 124 (100.0%) | 1,226 (100.0%) |
Real Estate Taxes by Mortgage Status in Las Flores CDP Orange County
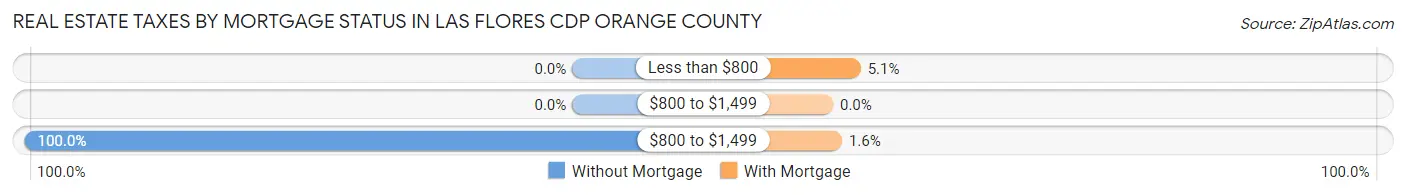
| Property Taxes | Without Mortgage | With Mortgage |
| Less than $800 | 0 (0.0%) | 62 (5.1%) |
| $800 to $1,499 | 0 (0.0%) | 0 (0.0%) |
| $800 to $1,499 | 124 (100.0%) | 20 (1.6%) |
| Total | 124 (100.0%) | 1,226 (100.0%) |
Health & Disability in Las Flores CDP Orange County
Health Insurance Coverage by Age in Las Flores CDP Orange County
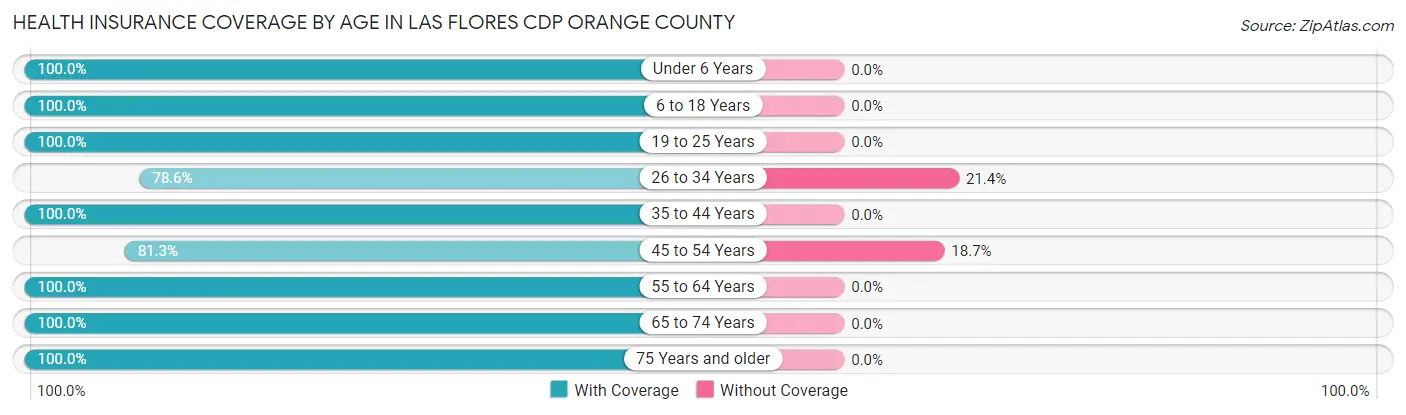
| Age Bracket | With Coverage | Without Coverage |
| Under 6 Years | 391 (100.0%) | 0 (0.0%) |
| 6 to 18 Years | 1,399 (100.0%) | 0 (0.0%) |
| 19 to 25 Years | 452 (100.0%) | 0 (0.0%) |
| 26 to 34 Years | 720 (78.6%) | 196 (21.4%) |
| 35 to 44 Years | 707 (100.0%) | 0 (0.0%) |
| 45 to 54 Years | 867 (81.3%) | 199 (18.7%) |
| 55 to 64 Years | 568 (100.0%) | 0 (0.0%) |
| 65 to 74 Years | 209 (100.0%) | 0 (0.0%) |
| 75 Years and older | 49 (100.0%) | 0 (0.0%) |
| Total | 5,362 (93.1%) | 395 (6.9%) |
Health Insurance Coverage by Citizenship Status in Las Flores CDP Orange County

| Citizenship Status | With Coverage | Without Coverage |
| Native Born | 391 (100.0%) | 0 (0.0%) |
| Foreign Born, Citizen | 1,399 (100.0%) | 0 (0.0%) |
| Foreign Born, not a Citizen | 452 (100.0%) | 0 (0.0%) |
Health Insurance Coverage by Household Income in Las Flores CDP Orange County
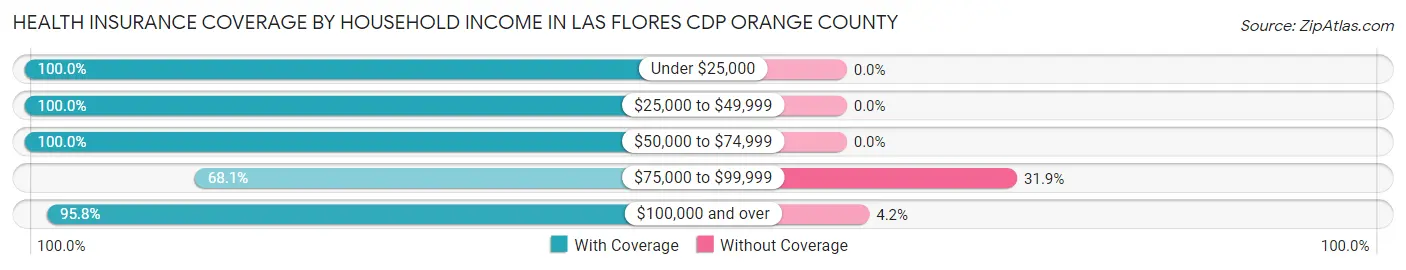
| Household Income | With Coverage | Without Coverage |
| Under $25,000 | 217 (100.0%) | 0 (0.0%) |
| $25,000 to $49,999 | 57 (100.0%) | 0 (0.0%) |
| $50,000 to $74,999 | 554 (100.0%) | 0 (0.0%) |
| $75,000 to $99,999 | 461 (68.1%) | 216 (31.9%) |
| $100,000 and over | 4,073 (95.8%) | 179 (4.2%) |
Public vs Private Health Insurance Coverage by Age in Las Flores CDP Orange County
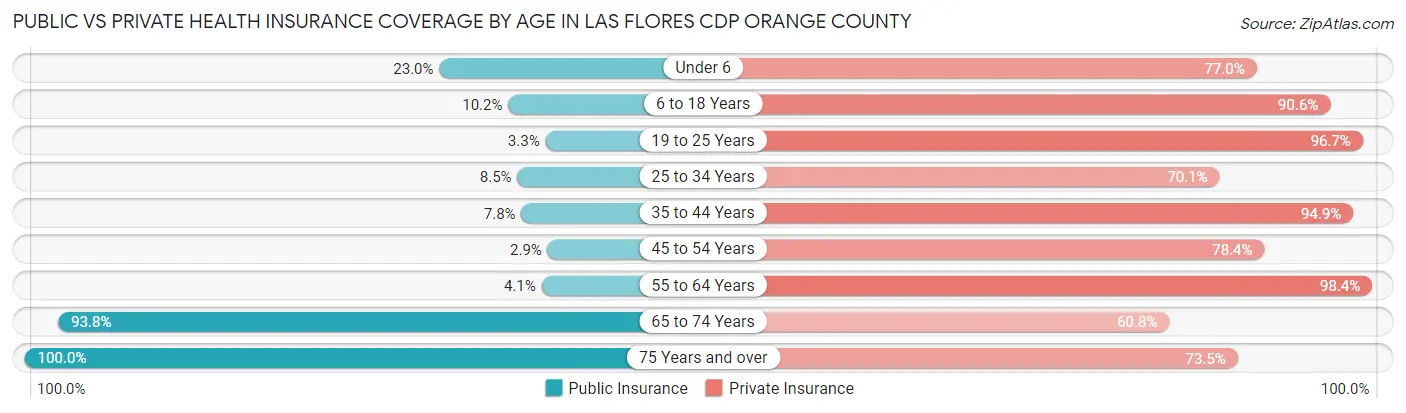
| Age Bracket | Public Insurance | Private Insurance |
| Under 6 | 90 (23.0%) | 301 (77.0%) |
| 6 to 18 Years | 143 (10.2%) | 1,268 (90.6%) |
| 19 to 25 Years | 15 (3.3%) | 437 (96.7%) |
| 25 to 34 Years | 78 (8.5%) | 642 (70.1%) |
| 35 to 44 Years | 55 (7.8%) | 671 (94.9%) |
| 45 to 54 Years | 31 (2.9%) | 836 (78.4%) |
| 55 to 64 Years | 23 (4.1%) | 559 (98.4%) |
| 65 to 74 Years | 196 (93.8%) | 127 (60.8%) |
| 75 Years and over | 49 (100.0%) | 36 (73.5%) |
| Total | 680 (11.8%) | 4,877 (84.7%) |
Disability Status by Sex by Age in Las Flores CDP Orange County
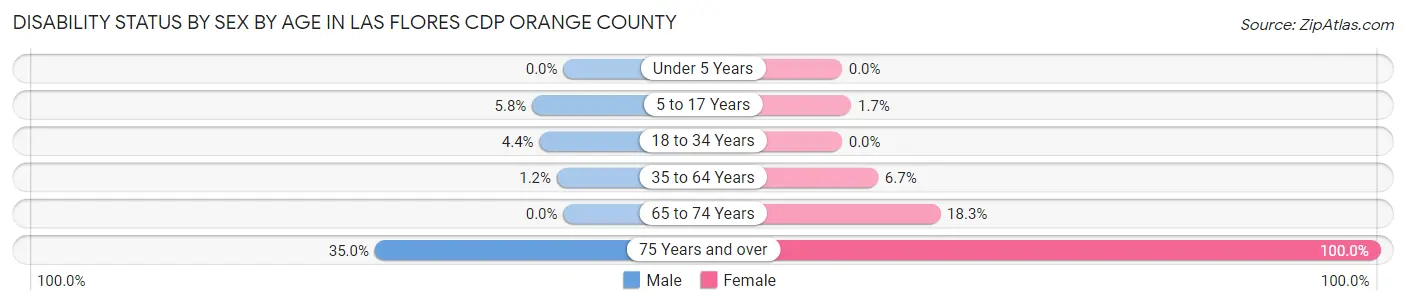
| Age Bracket | Male | Female |
| Under 5 Years | 0 (0.0%) | 0 (0.0%) |
| 5 to 17 Years | 46 (5.8%) | 9 (1.7%) |
| 18 to 34 Years | 30 (4.4%) | 0 (0.0%) |
| 35 to 64 Years | 14 (1.2%) | 79 (6.7%) |
| 65 to 74 Years | 0 (0.0%) | 21 (18.3%) |
| 75 Years and over | 7 (35.0%) | 29 (100.0%) |
Disability Class by Sex by Age in Las Flores CDP Orange County
Disability Class: Hearing Difficulty
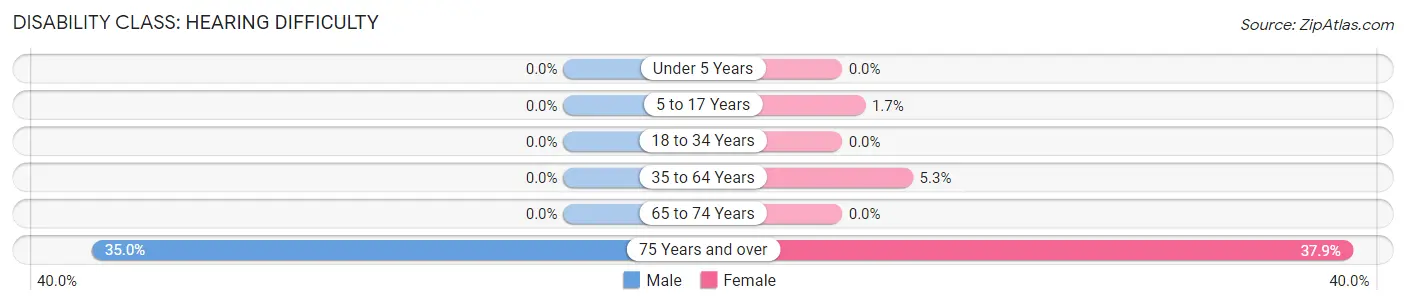
| Age Bracket | Male | Female |
| Under 5 Years | 0 (0.0%) | 0 (0.0%) |
| 5 to 17 Years | 0 (0.0%) | 9 (1.7%) |
| 18 to 34 Years | 0 (0.0%) | 0 (0.0%) |
| 35 to 64 Years | 0 (0.0%) | 62 (5.3%) |
| 65 to 74 Years | 0 (0.0%) | 0 (0.0%) |
| 75 Years and over | 7 (35.0%) | 11 (37.9%) |
Disability Class: Vision Difficulty
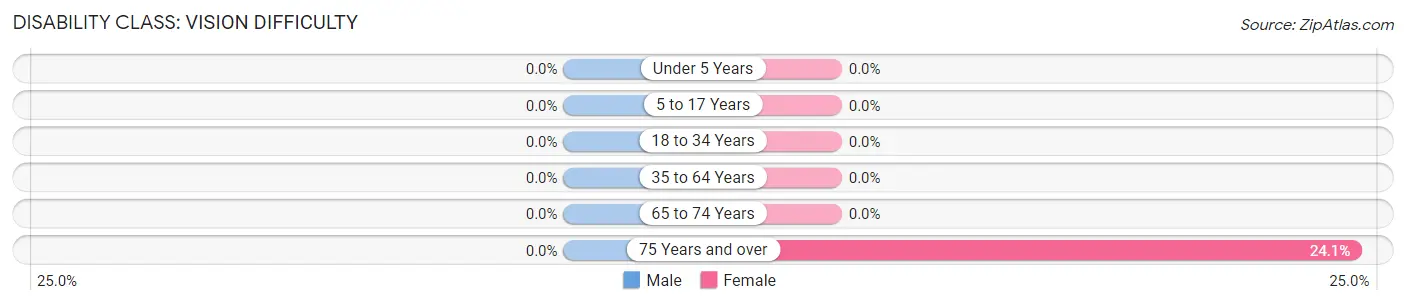
| Age Bracket | Male | Female |
| Under 5 Years | 0 (0.0%) | 0 (0.0%) |
| 5 to 17 Years | 0 (0.0%) | 0 (0.0%) |
| 18 to 34 Years | 0 (0.0%) | 0 (0.0%) |
| 35 to 64 Years | 0 (0.0%) | 0 (0.0%) |
| 65 to 74 Years | 0 (0.0%) | 0 (0.0%) |
| 75 Years and over | 0 (0.0%) | 7 (24.1%) |
Disability Class: Cognitive Difficulty
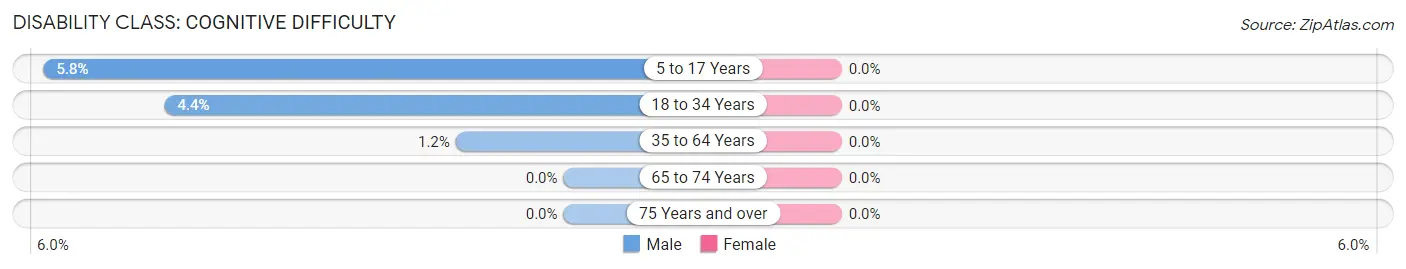
| Age Bracket | Male | Female |
| 5 to 17 Years | 46 (5.8%) | 0 (0.0%) |
| 18 to 34 Years | 30 (4.4%) | 0 (0.0%) |
| 35 to 64 Years | 14 (1.2%) | 0 (0.0%) |
| 65 to 74 Years | 0 (0.0%) | 0 (0.0%) |
| 75 Years and over | 0 (0.0%) | 0 (0.0%) |
Disability Class: Ambulatory Difficulty
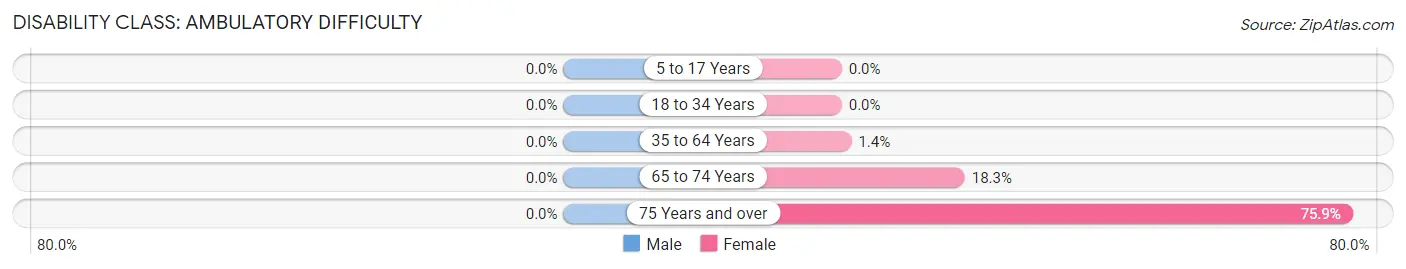
| Age Bracket | Male | Female |
| 5 to 17 Years | 0 (0.0%) | 0 (0.0%) |
| 18 to 34 Years | 0 (0.0%) | 0 (0.0%) |
| 35 to 64 Years | 0 (0.0%) | 17 (1.4%) |
| 65 to 74 Years | 0 (0.0%) | 21 (18.3%) |
| 75 Years and over | 0 (0.0%) | 22 (75.9%) |
Disability Class: Self-Care Difficulty
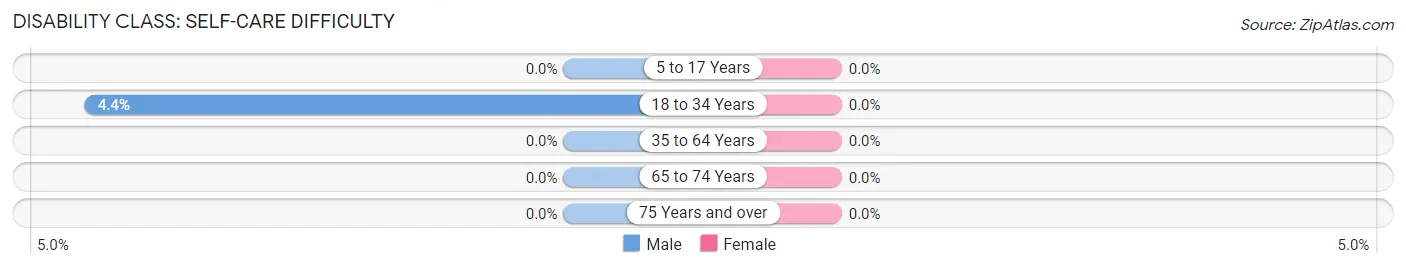
| Age Bracket | Male | Female |
| 5 to 17 Years | 0 (0.0%) | 0 (0.0%) |
| 18 to 34 Years | 30 (4.4%) | 0 (0.0%) |
| 35 to 64 Years | 0 (0.0%) | 0 (0.0%) |
| 65 to 74 Years | 0 (0.0%) | 0 (0.0%) |
| 75 Years and over | 0 (0.0%) | 0 (0.0%) |
Technology Access in Las Flores CDP Orange County
Computing Device Access in Las Flores CDP Orange County
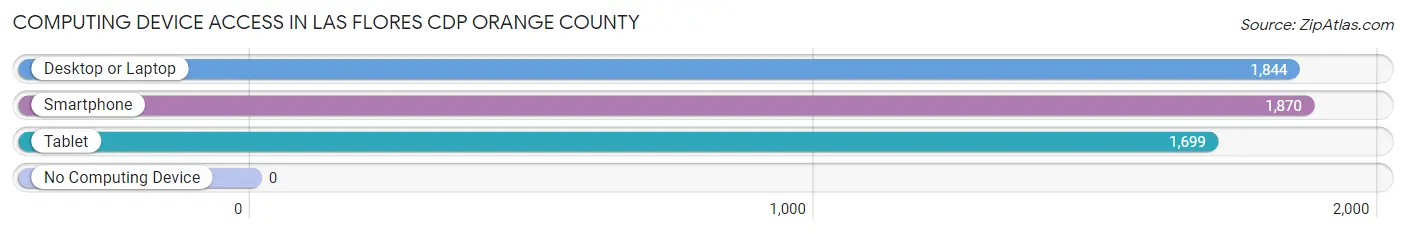
| Device Type | # Households | % Households |
| Desktop or Laptop | 1,844 | 98.6% |
| Smartphone | 1,870 | 100.0% |
| Tablet | 1,699 | 90.9% |
| No Computing Device | 0 | 0.0% |
| Total | 1,870 | 100.0% |
Internet Access in Las Flores CDP Orange County
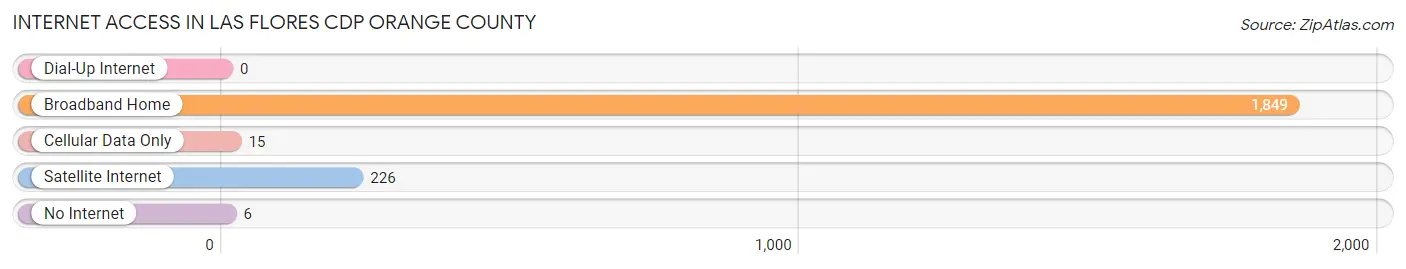
| Internet Type | # Households | % Households |
| Dial-Up Internet | 0 | 0.0% |
| Broadband Home | 1,849 | 98.9% |
| Cellular Data Only | 15 | 0.8% |
| Satellite Internet | 226 | 12.1% |
| No Internet | 6 | 0.3% |
| Total | 1,870 | 100.0% |
Las Flores CDP Orange County Summary
History
Las Flores CDP is a census-designated place located in Orange County, California. It is located in the foothills of the Santa Ana Mountains, and is bordered by the cities of Rancho Santa Margarita, Mission Viejo, and Coto de Caza. The area was originally inhabited by the Acjachemen Native American tribe, and was later settled by Spanish missionaries in the late 1700s. The area was then part of the Rancho Mission Viejo, a large land grant given to the Mission San Juan Capistrano in 1845. The area was later subdivided and developed in the late 1960s and early 1970s.
Geography
Las Flores CDP is located in the foothills of the Santa Ana Mountains, and is bordered by the cities of Rancho Santa Margarita, Mission Viejo, and Coto de Caza. The area is approximately 4.5 square miles in size, and has an elevation of 1,000 feet. The terrain is mostly rolling hills, with some flat areas. The climate is Mediterranean, with hot, dry summers and mild, wet winters.
Economy
Las Flores CDP has a diverse economy, with a mix of residential, commercial, and industrial businesses. The area is home to several large employers, including the Mission Viejo Company, which is a major developer of residential and commercial properties in the area. Other major employers include the Las Flores Medical Center, the Las Flores Shopping Center, and the Las Flores Country Club.
Demographics
As of the 2010 census, the population of Las Flores CDP was 8,468. The population is predominantly white (77.3%), with smaller percentages of Hispanic (14.2%), Asian (4.2%), and African American (2.2%) residents. The median household income is $90,845, and the median age is 39. The area is well-educated, with over 80% of residents having a high school diploma or higher.
Las Flores CDP is a diverse and vibrant community, with a mix of residential, commercial, and industrial businesses. The area is well-served by public transportation, and is close to major highways and airports. The area is also home to several parks and recreational facilities, making it a great place to live and work.
Common Questions
What is Per Capita Income in Las Flores CDP Orange County?
Per Capita income in Las Flores CDP Orange County is $60,817.
What is the Median Family Income in Las Flores CDP Orange County?
Median Family Income in Las Flores CDP Orange County is $197,500.
What is the Median Household income in Las Flores CDP Orange County?
Median Household Income in Las Flores CDP Orange County is $138,750.
What is Income or Wage Gap in Las Flores CDP Orange County?
Income or Wage Gap in Las Flores CDP Orange County is 28.2%.
Women in Las Flores CDP Orange County earn 71.8 cents for every dollar earned by a man.
What is Inequality or Gini Index in Las Flores CDP Orange County?
Inequality or Gini Index in Las Flores CDP Orange County is 0.38.
What is the Total Population of Las Flores CDP Orange County?
Total Population of Las Flores CDP Orange County is 5,757.
What is the Total Male Population of Las Flores CDP Orange County?
Total Male Population of Las Flores CDP Orange County is 2,935.
What is the Total Female Population of Las Flores CDP Orange County?
Total Female Population of Las Flores CDP Orange County is 2,822.
What is the Ratio of Males per 100 Females in Las Flores CDP Orange County?
There are 104.00 Males per 100 Females in Las Flores CDP Orange County.
What is the Ratio of Females per 100 Males in Las Flores CDP Orange County?
There are 96.15 Females per 100 Males in Las Flores CDP Orange County.
What is the Median Population Age in Las Flores CDP Orange County?
Median Population Age in Las Flores CDP Orange County is 31.6 Years.
What is the Average Family Size in Las Flores CDP Orange County
Average Family Size in Las Flores CDP Orange County is 3.2 People.
What is the Average Household Size in Las Flores CDP Orange County
Average Household Size in Las Flores CDP Orange County is 3.1 People.
How Large is the Labor Force in Las Flores CDP Orange County?
There are 3,373 People in the Labor Forcein in Las Flores CDP Orange County.
What is the Percentage of People in the Labor Force in Las Flores CDP Orange County?
76.6% of People are in the Labor Force in Las Flores CDP Orange County.
What is the Unemployment Rate in Las Flores CDP Orange County?
Unemployment Rate in Las Flores CDP Orange County is 3.4%.